NiiVue
NiiVue is a WebGL2 viewer for medical and neuroimaging data, built and maintained by Chris Rorden’s lab (University of South Carolina) and used across the neuroimaging community for displaying NIfTI and DICOM volumes, statistical overlays, and cortical surface meshes. It renders axial/coronal/sagittal slices, a multiplanar grid, and a full 3D volume render from the same data, all in the browser with no server-side image processing. ipyniivue is the official Python/anywidget wrapper that shinywidgets builds on.
render_niivue takes a function that returns a configured ipyniivue.NiiVue instance (volumes and/or meshes already loaded) and handles the Shiny-specific plumbing: the canvas tracks its container’s size, including full_screen and fill layouts, so you don’t hand-tune pixel heights. The headline feature is location(), a reactive accessor that reports the crosshair’s position – voxel indices, millimeter coordinates, and the intensity under the cursor – every time the user clicks or drags, so you can drive a readout, a linked plot, or a table from wherever someone is looking in the scan.
Reach for NiiVue when your data is volumetric (NIfTI, DICOM, or a mesh) and you want slice/3D viewing with real anatomical coordinates. For 3D scenes built from arbitrary geometry (points, meshes you construct yourself), see k3d, ipyvolume, or pythreejs instead.
Installation
pip install 'shinywidgets[niivue]'This installs ipyniivue. A few recipes below also use nibabel (pip install nibabel) to read or build NIfTI files on the Python side – it’s not required for render_niivue itself.
Quick start
A minimal viewer of a public MNI152 template scan. NiiVue’s demo images are plain HTTPS files; passing a URL means the browser fetches the volume directly, so nothing is downloaded to your machine or re-encoded by Python.
from ipyniivue import NiiVue, Volume
from shiny.express import ui
from shinywidgets import render_niivue

ui.page_opts(title="NiiVue quickstart", fillable=True)


@render_niivue
def brain():
    nv = NiiVue()
    nv.load_volumes([Volume(url="https://niivue.com/demos/images/mni152.nii.gz")])
    return nv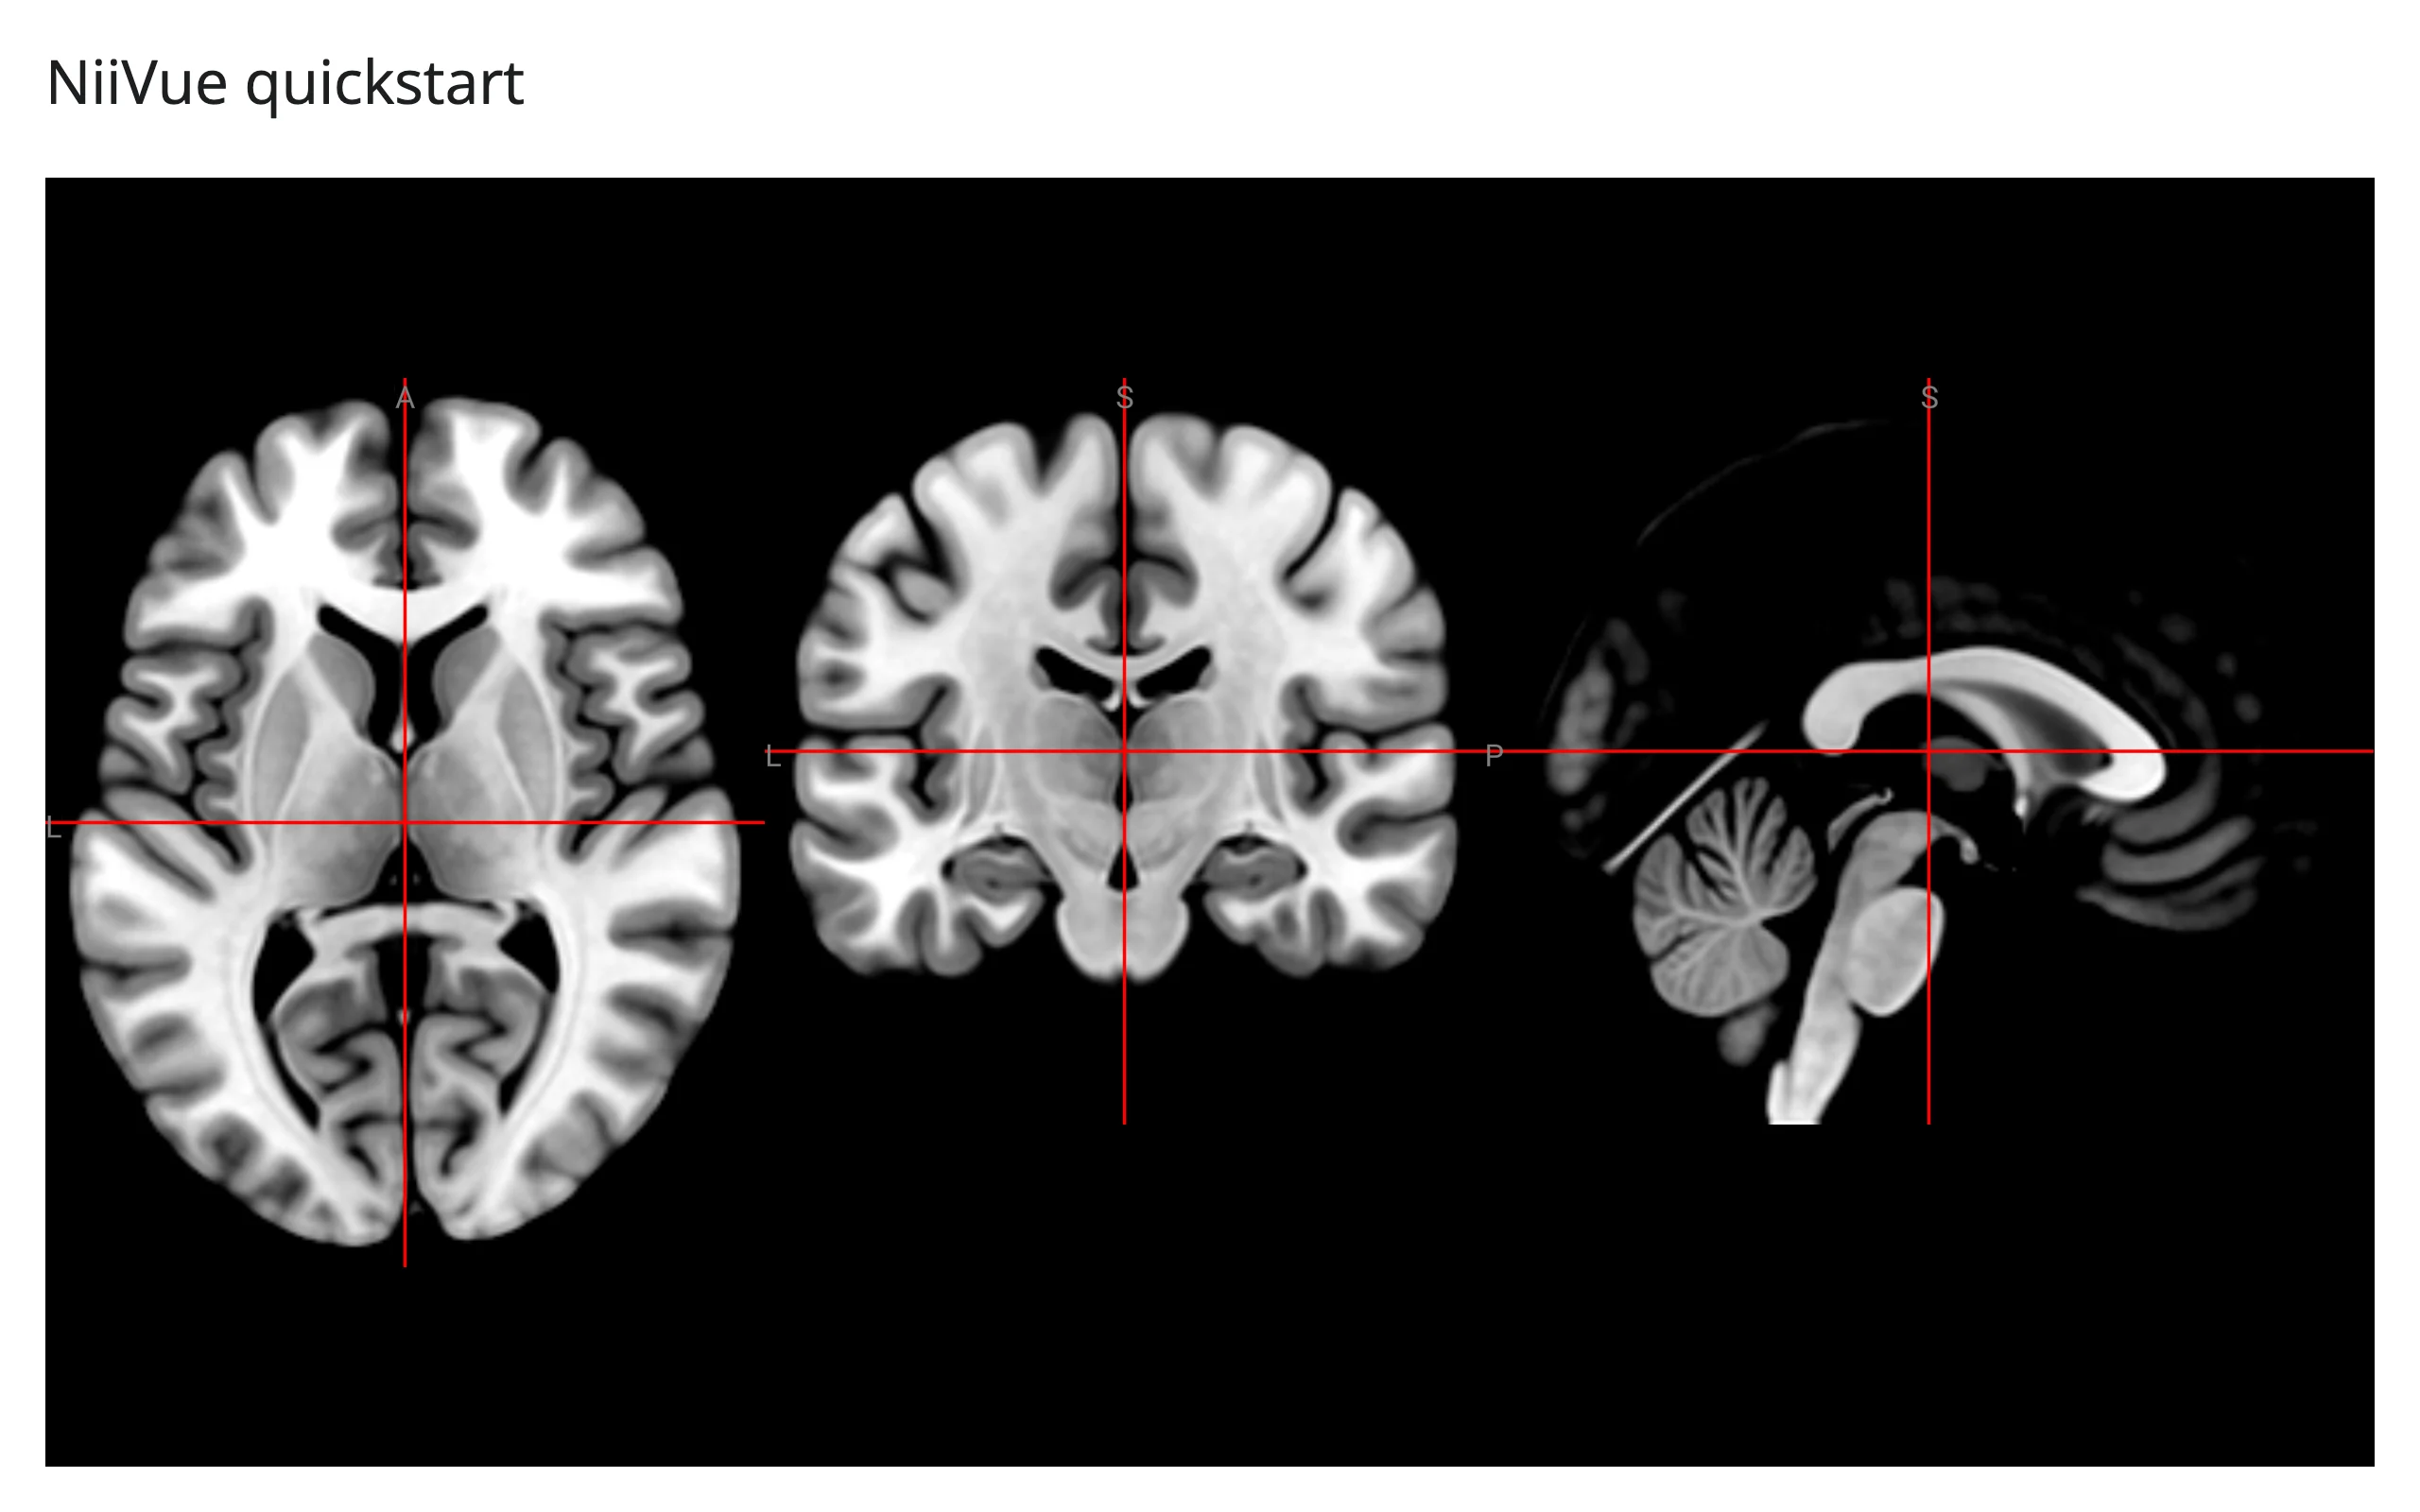
With no explicit height, NiiVue’s default multiplanar layout picks axial/coronal/sagittal panes (or adds a 3D render pane too, if the container is roomy enough) and adapts to the container’s aspect ratio automatically.
What you can build
Every slice type, switched live
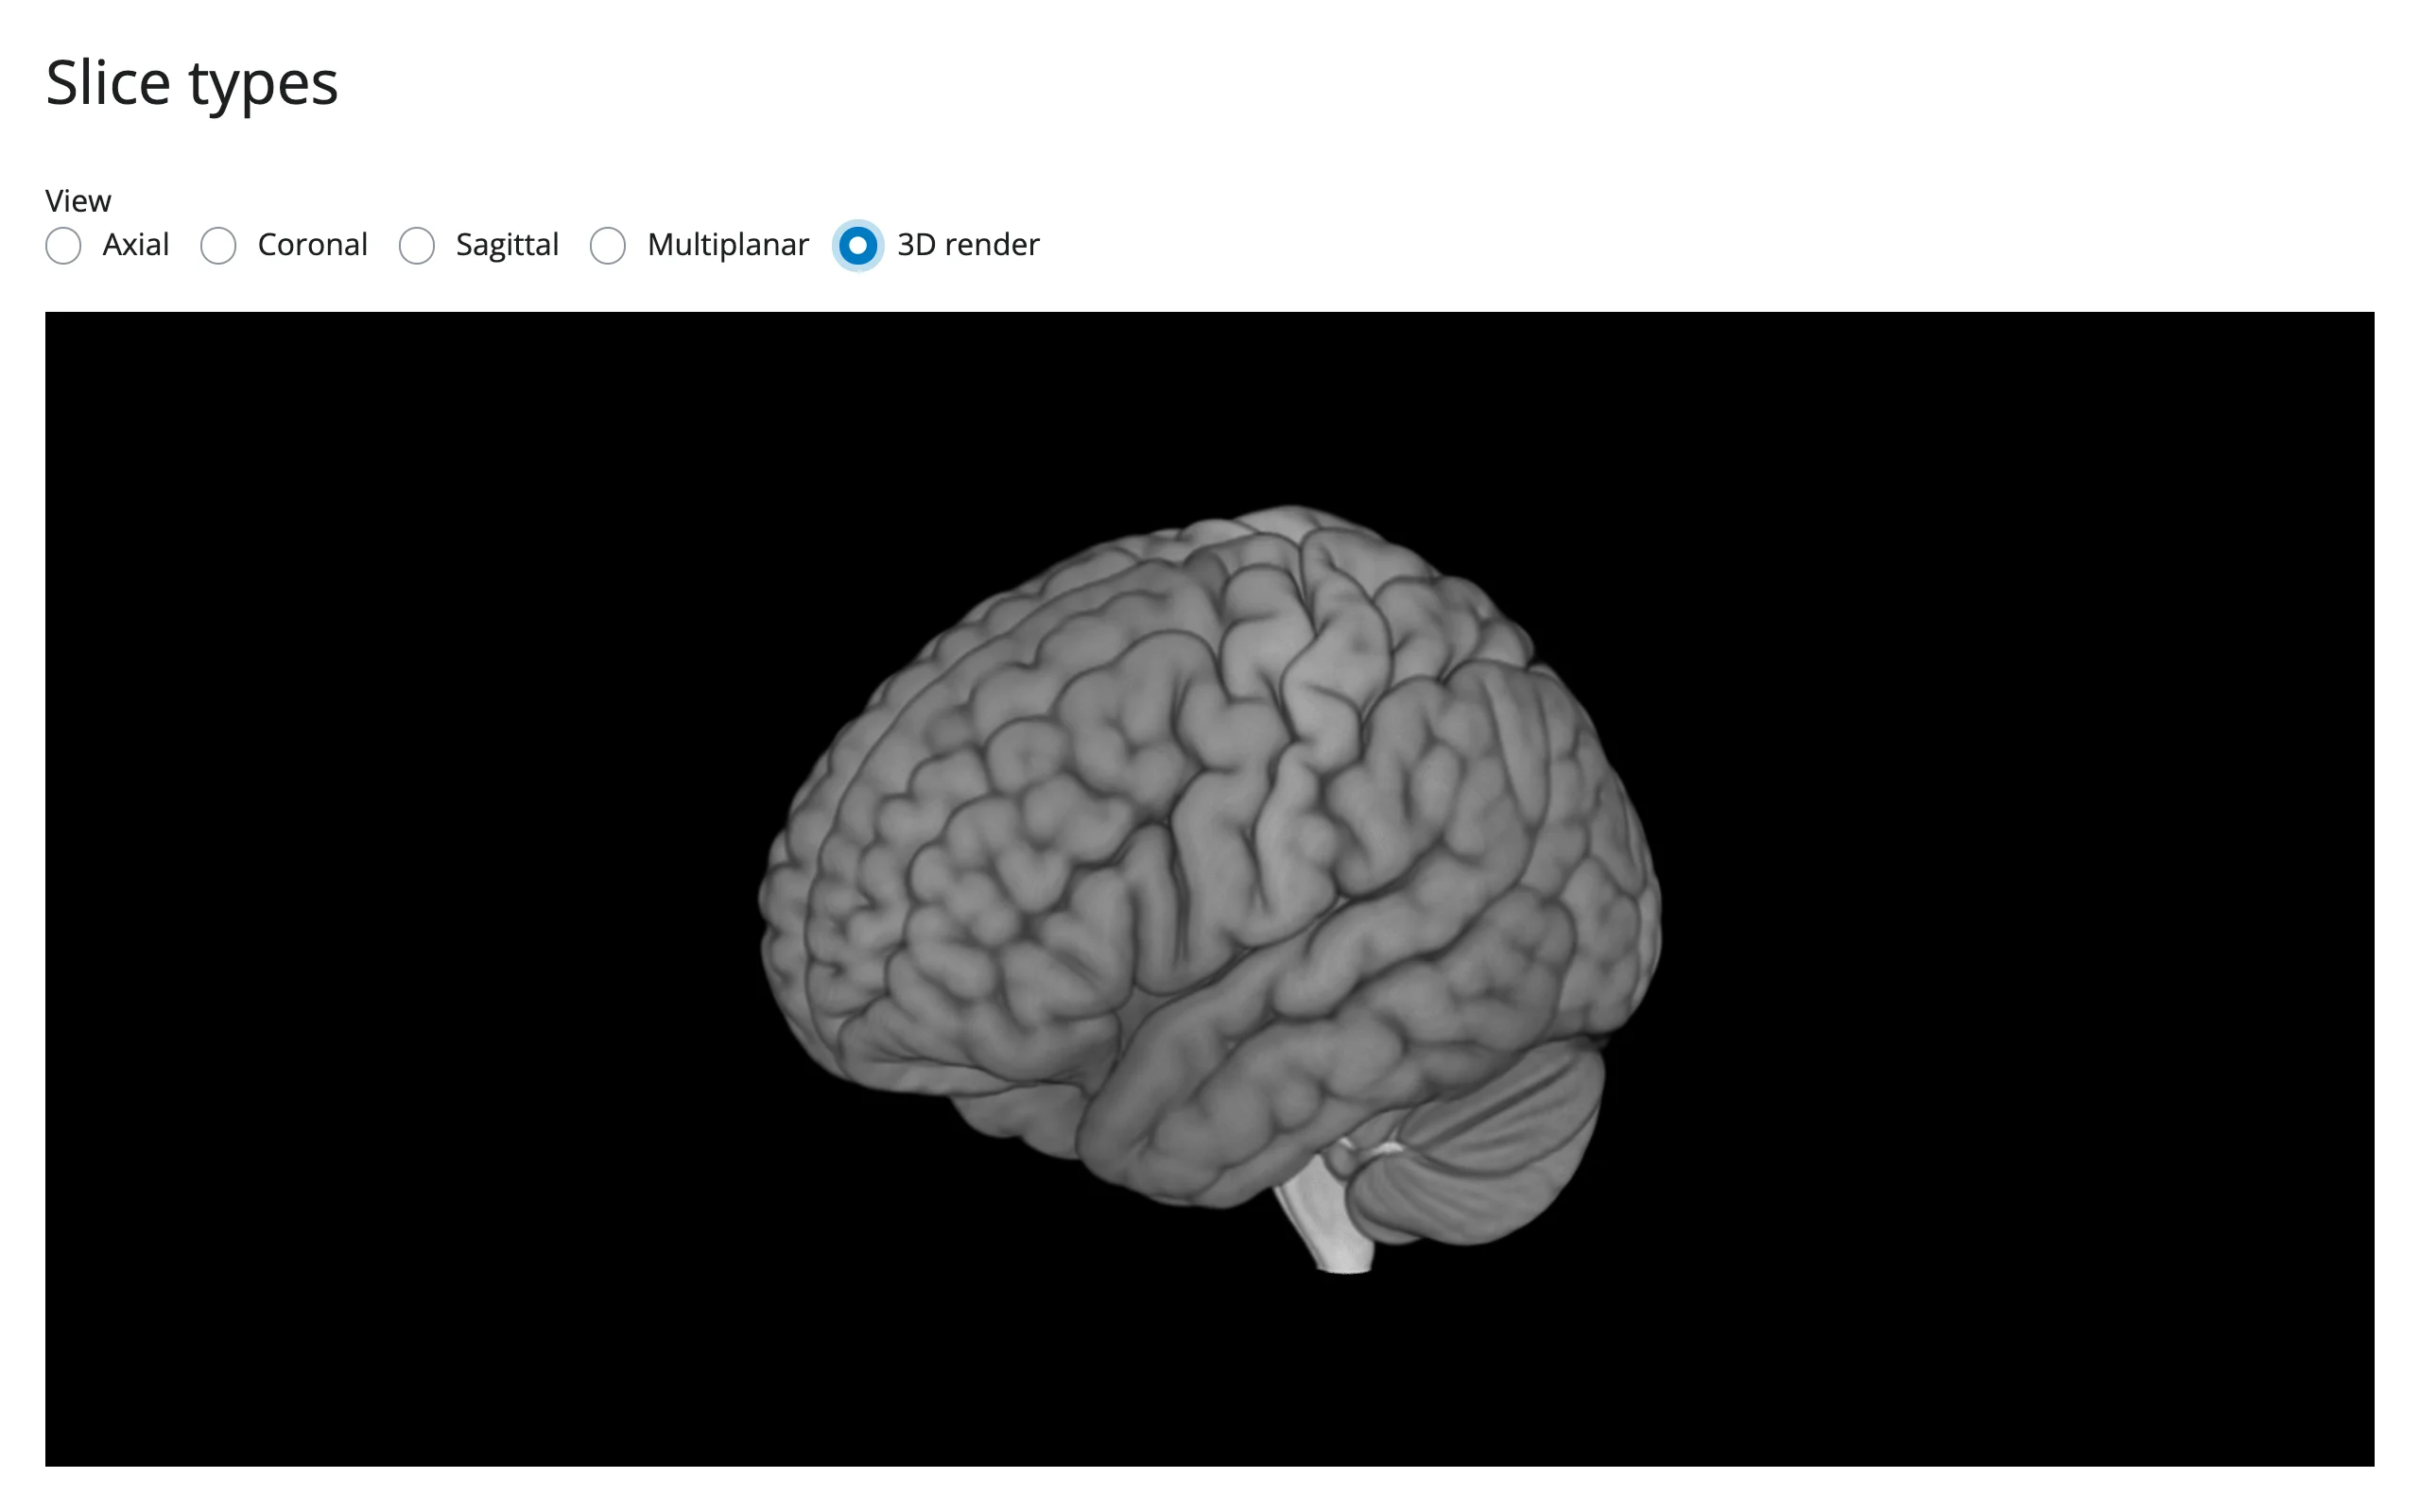
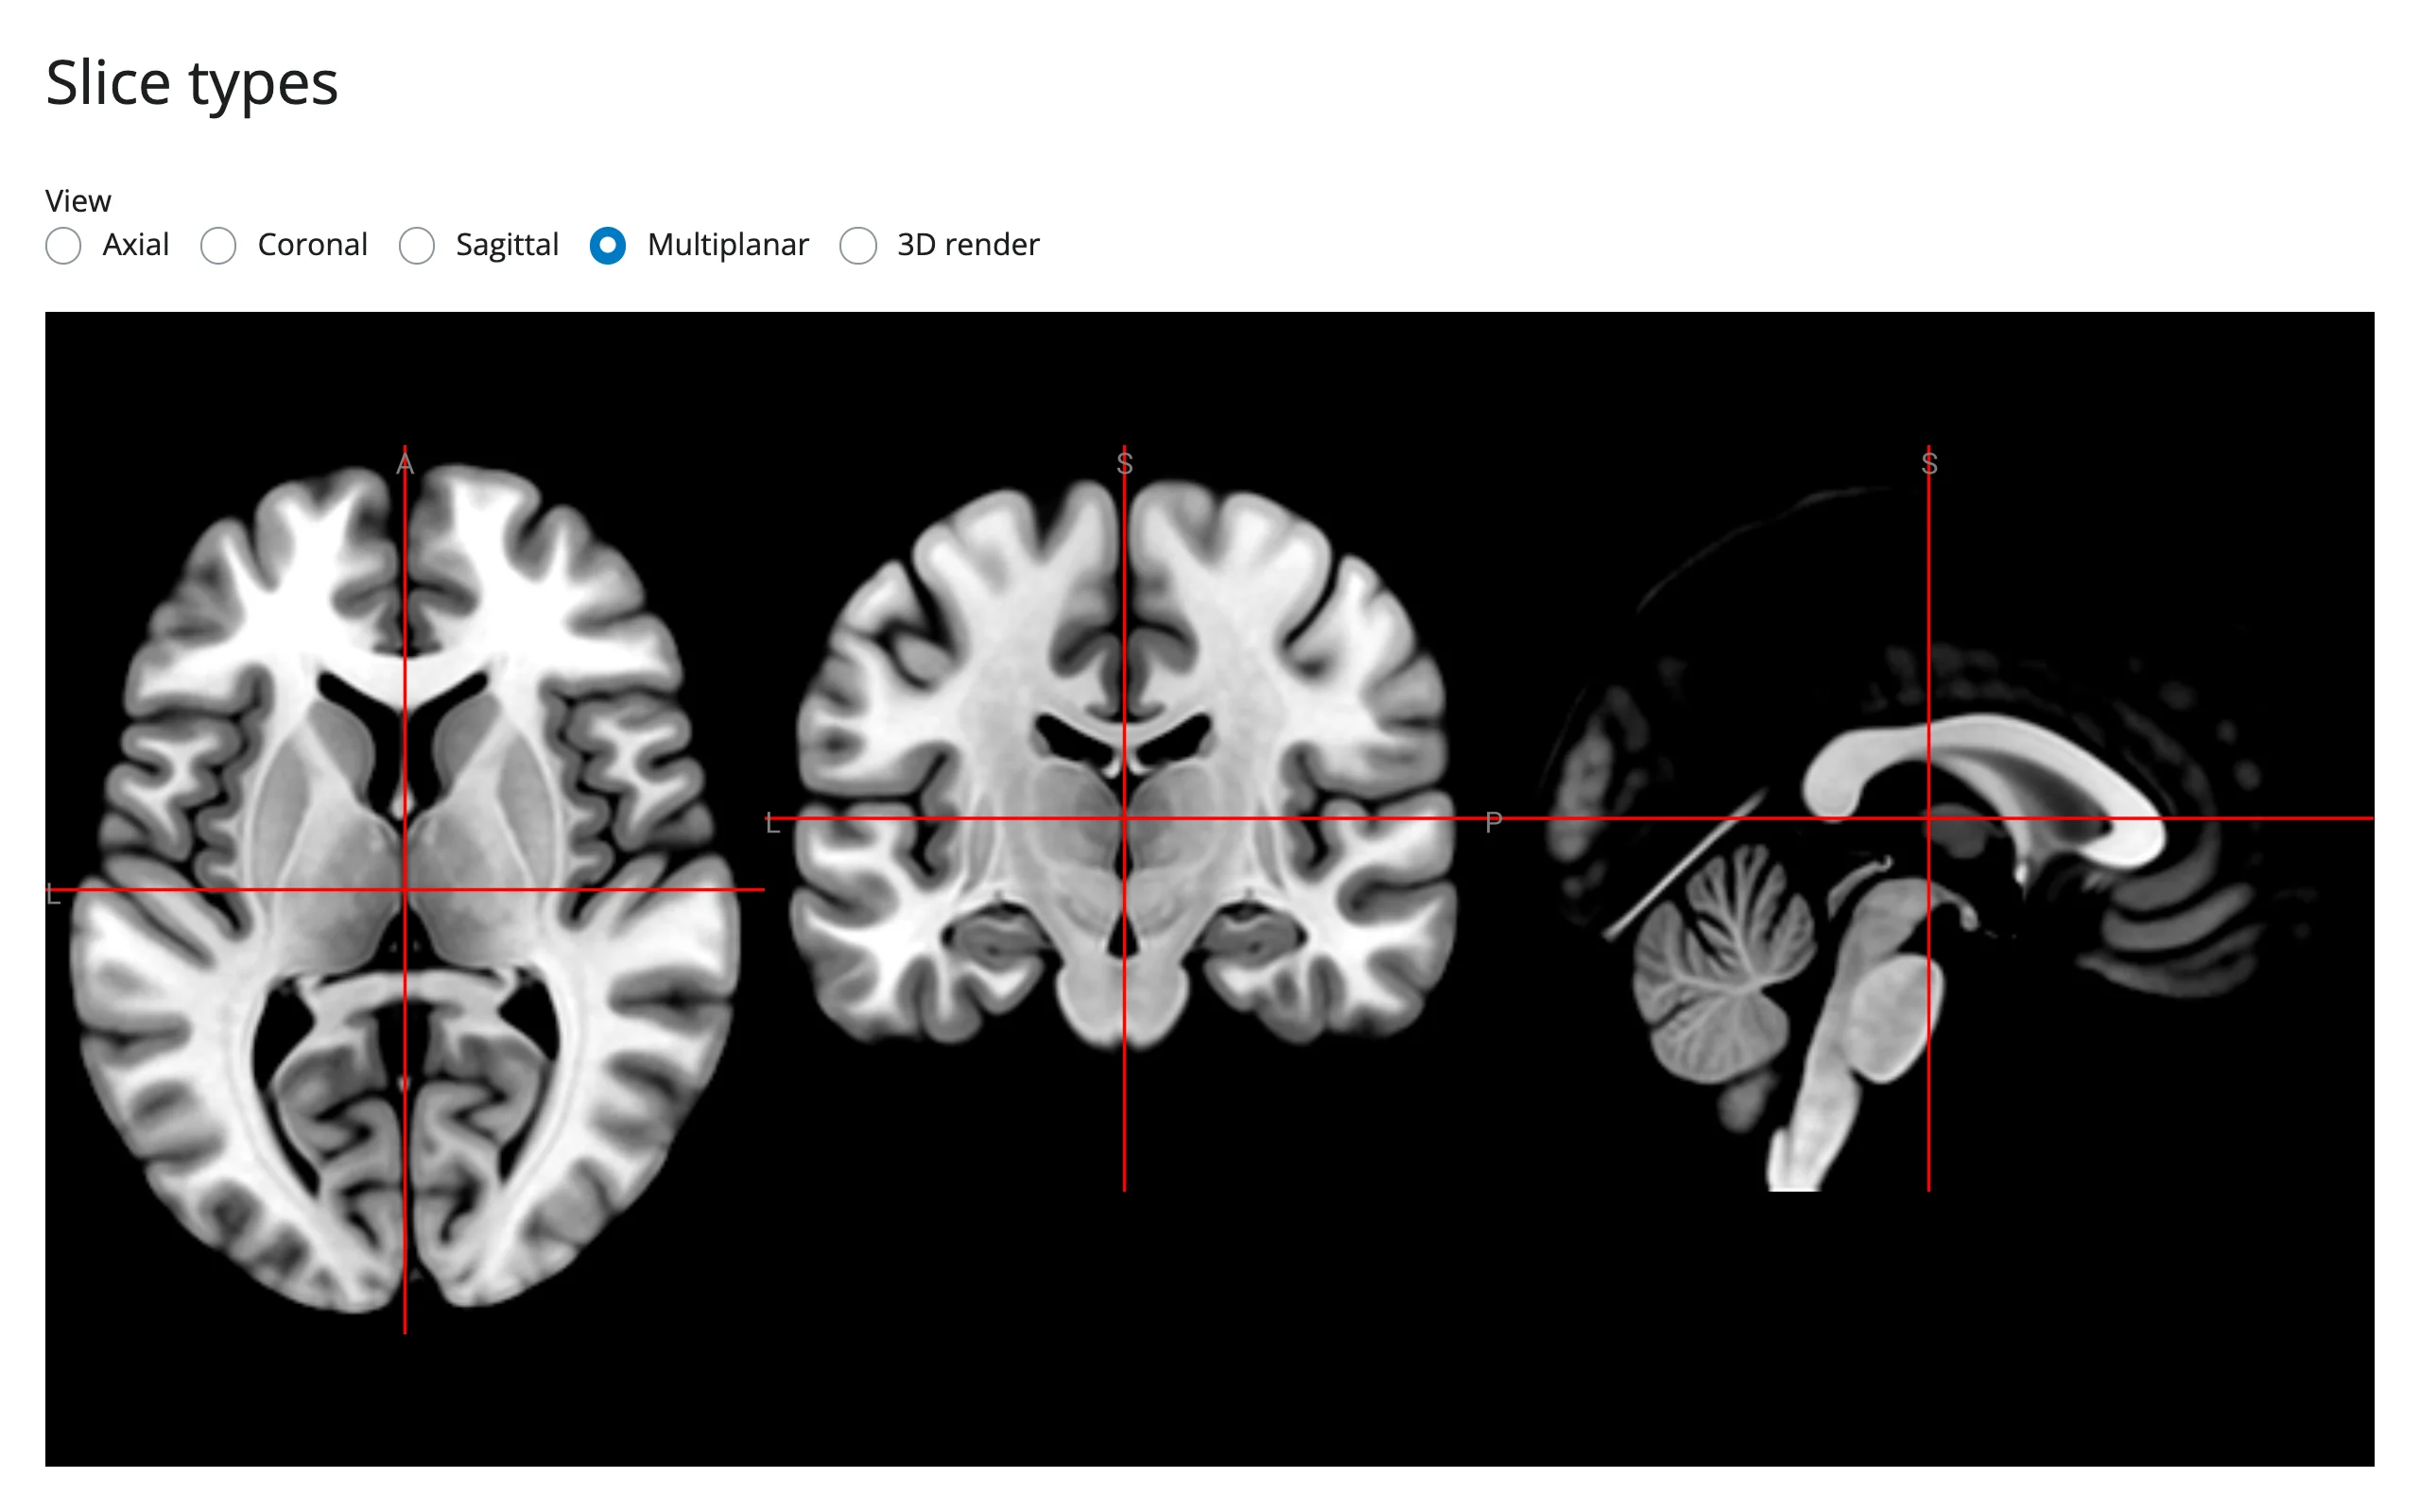
set_slice_type changes the view – 2D axial/coronal/sagittal, a multiplanar grid, or a ray-cast 3D render – without re-sending the volume.
from ipyniivue import NiiVue, SliceType, Volume
from shiny import reactive
from shiny.express import input, ui
from shinywidgets import render_niivue

SLICES = {
    "Axial": SliceType.AXIAL,
    "Coronal": SliceType.CORONAL,
    "Sagittal": SliceType.SAGITTAL,
    "Multiplanar": SliceType.MULTIPLANAR,
    "3D render": SliceType.RENDER,
}

ui.page_opts(title="Slice types", fillable=True)
ui.input_radio_buttons("view", "View", list(SLICES), selected="Multiplanar", inline=True)


@render_niivue
def brain():
    nv = NiiVue()
    nv.load_volumes([Volume(url="https://niivue.com/demos/images/mni152.nii.gz")])
    return nv


@reactive.effect
def _():
brain.widget.set_slice_type(SLICES[input.view()])| Multiplanar | 3D render |
|---|---|
 |
|
Statistical overlays with live thresholds
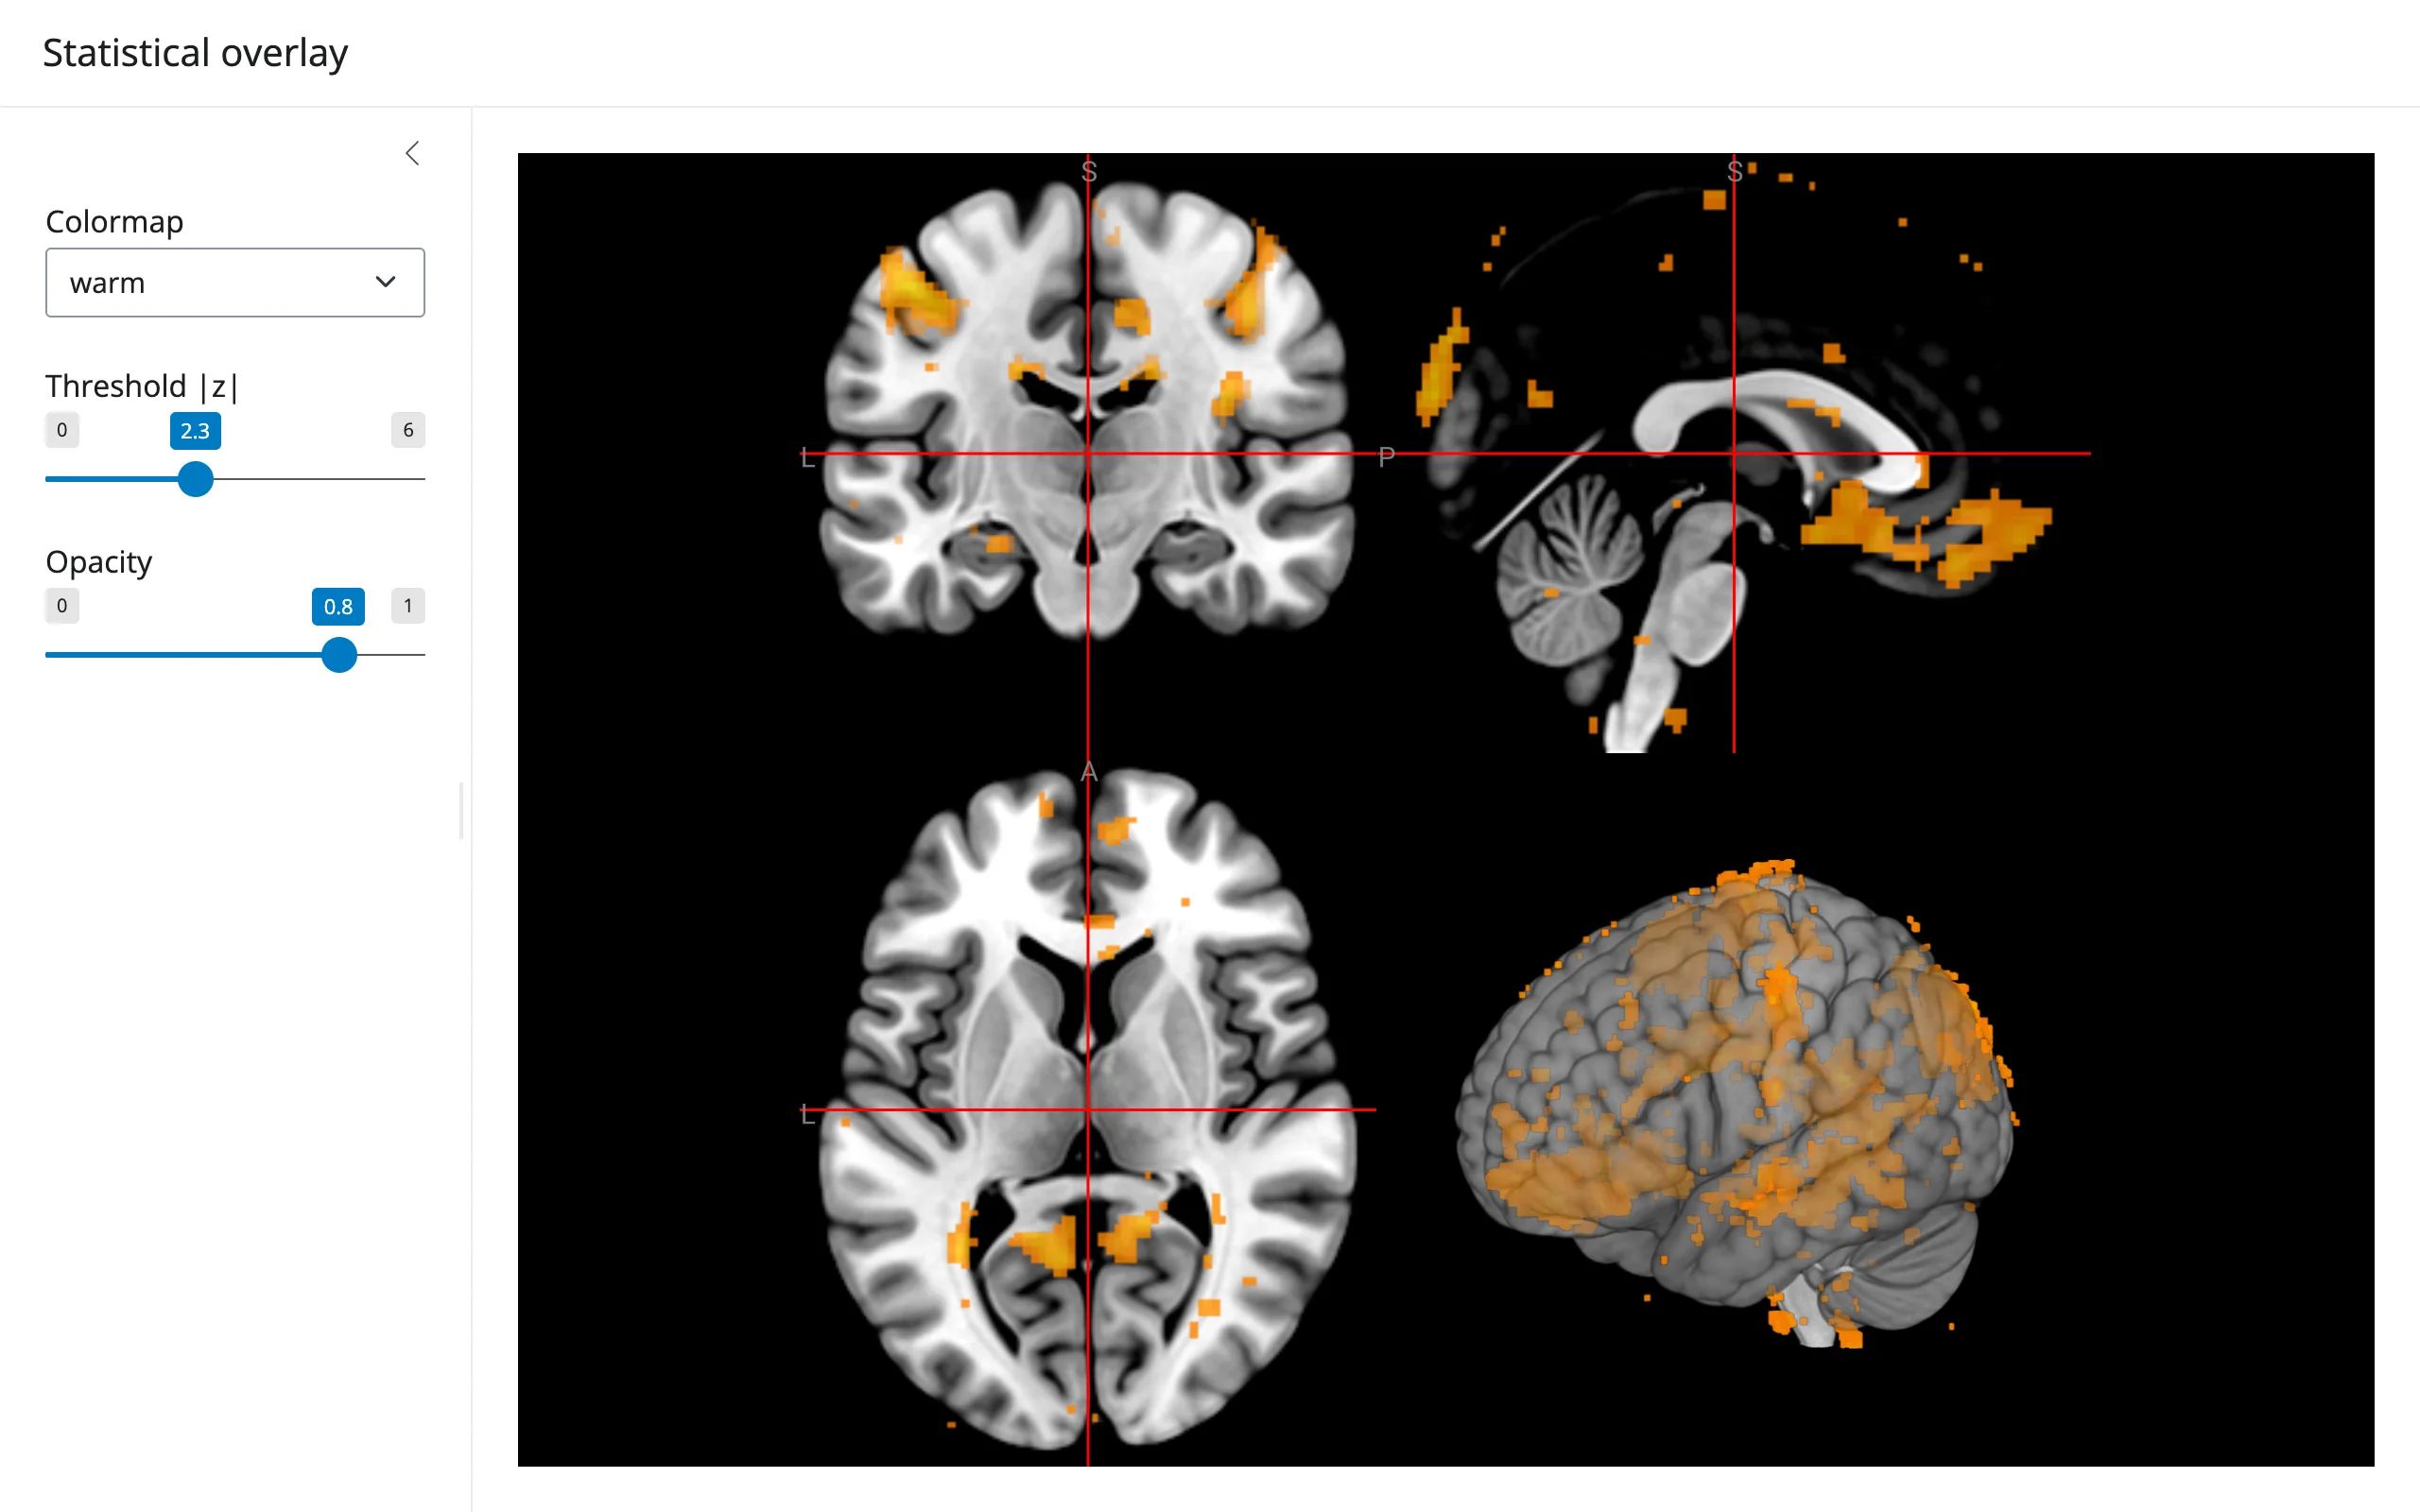
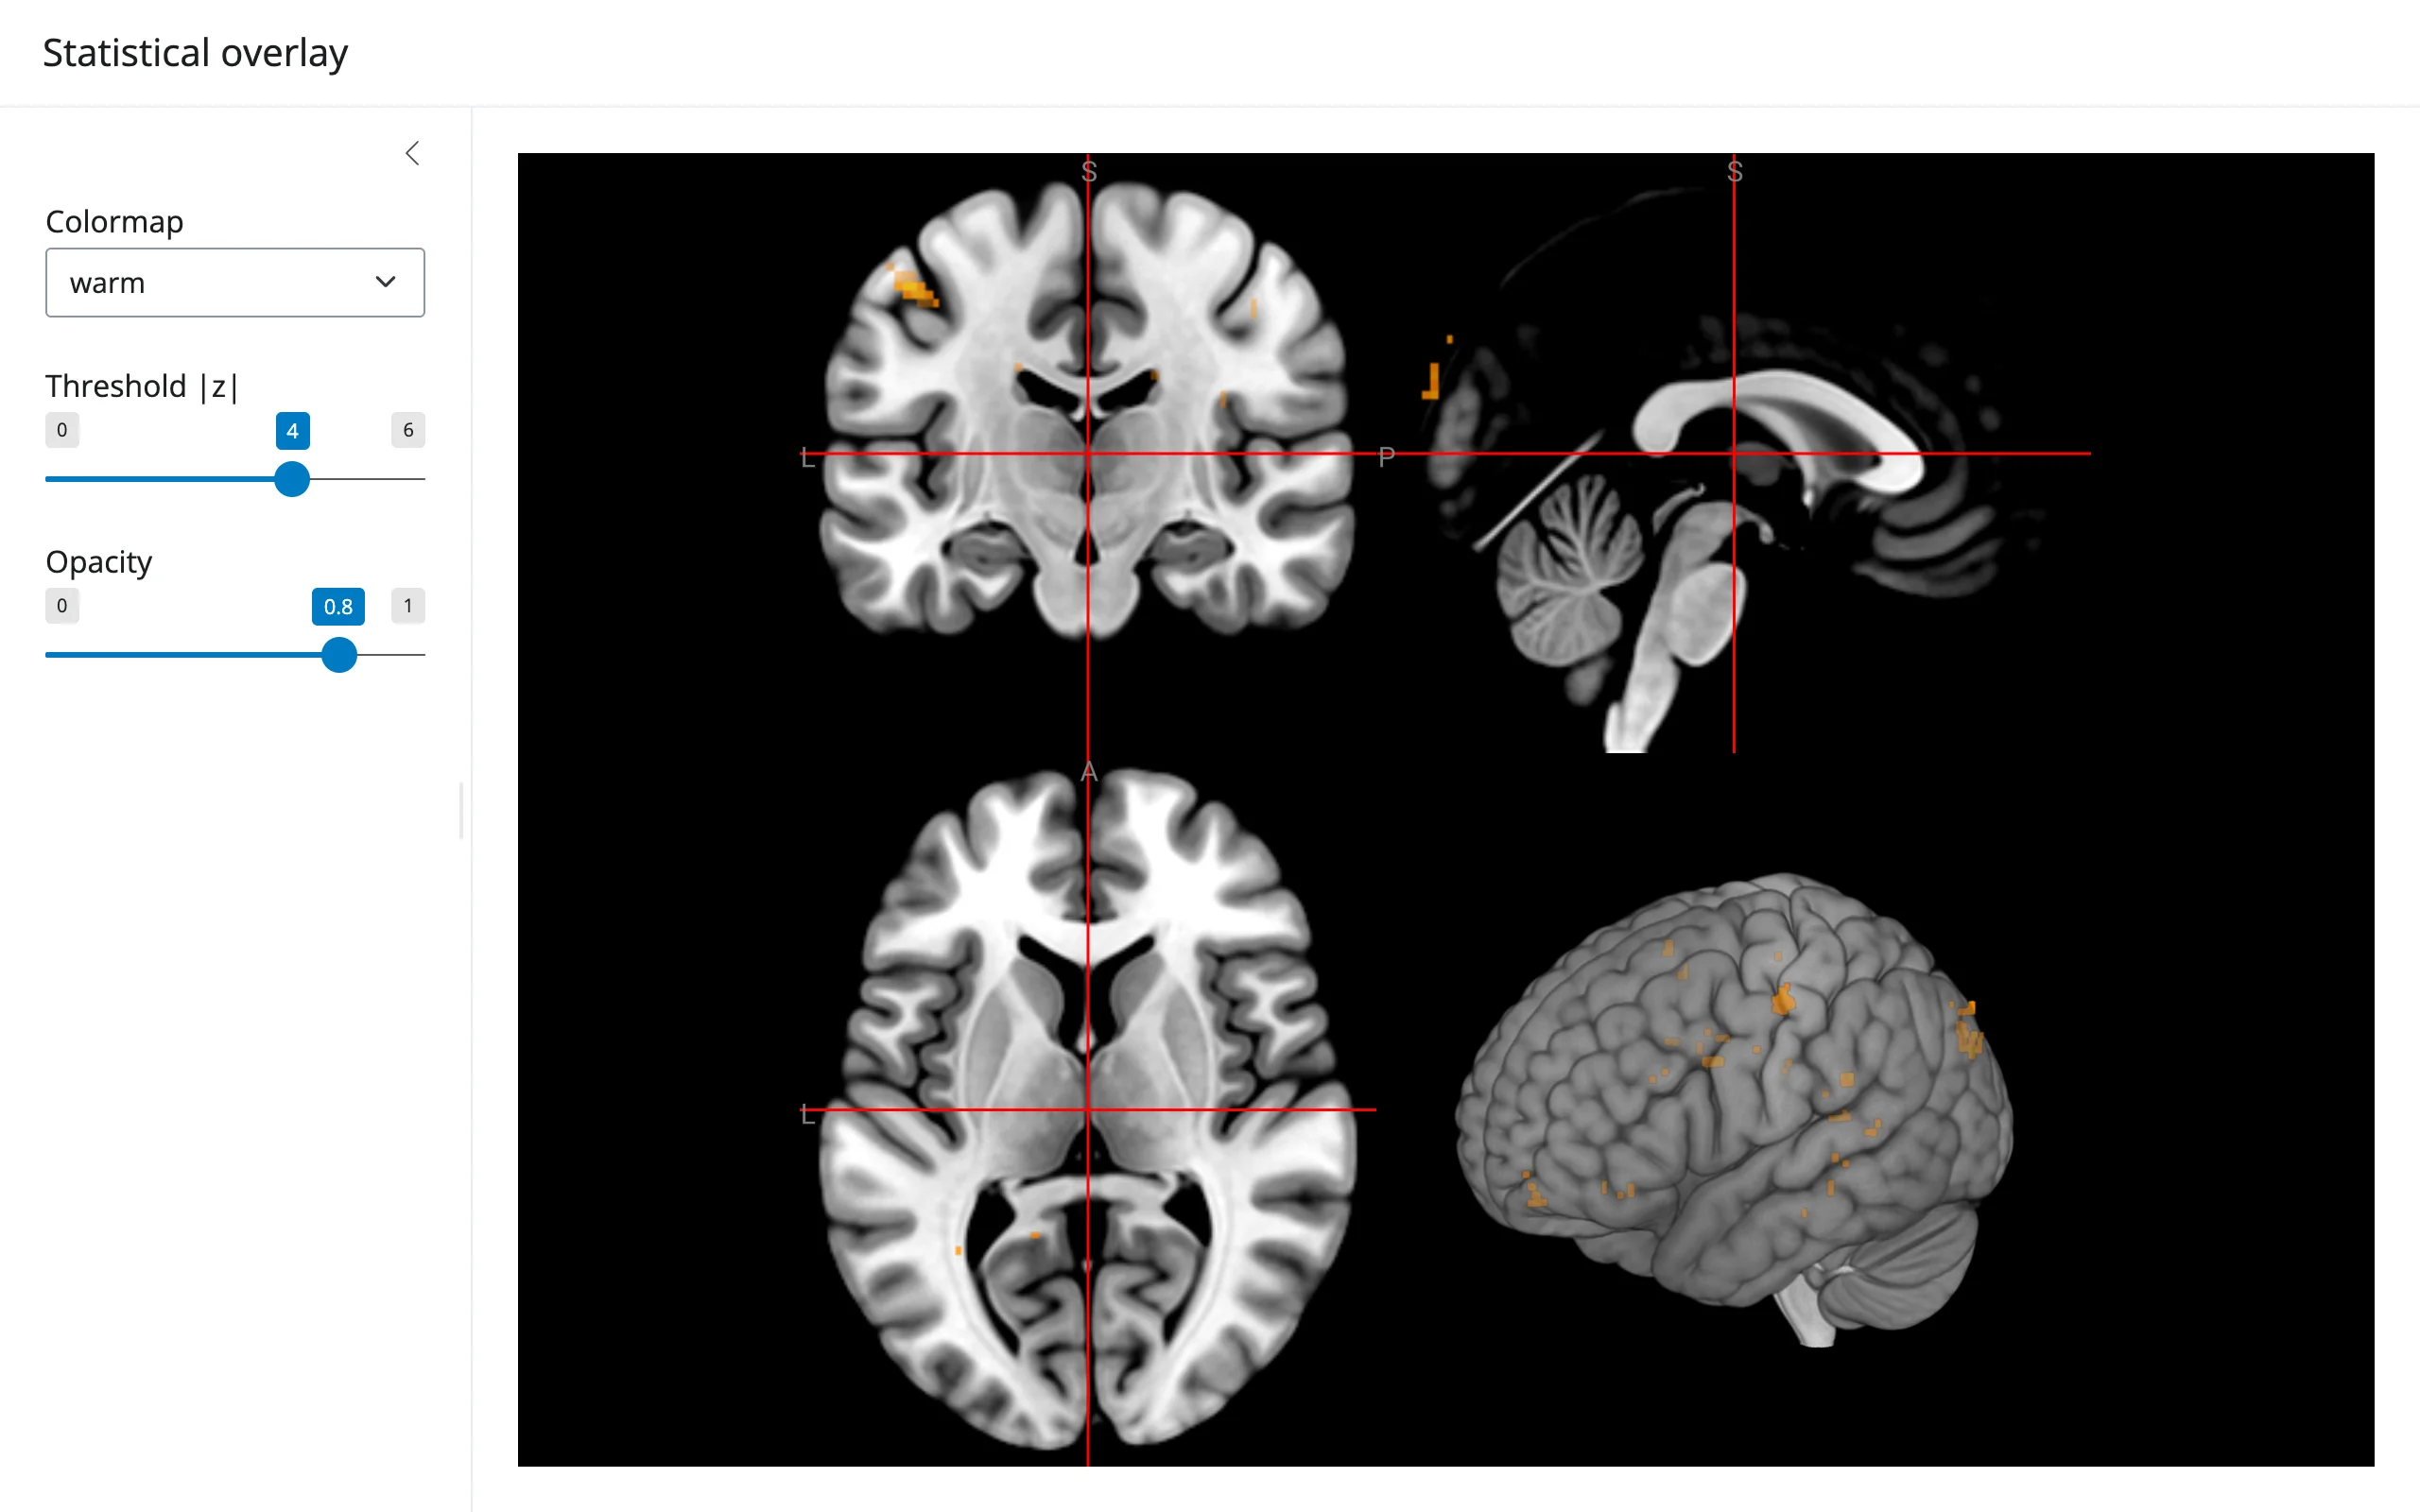
A second Volume layered on top of the structural scan becomes a statistical overlay. cal_min/cal_max are the display thresholds (the classic “only show |z| > 2.3” slider); setting them on the Volume object re-maps the color scale instantly, with no re-render. The data here is an unthresholded group-level z-map from the NARPS reproducibility study.
from ipyniivue import NiiVue, Volume
from shiny import reactive
from shiny.express import input, ui
from shinywidgets import render_niivue

ui.page_opts(title="Statistical overlay", fillable=True)
with ui.sidebar():
    ui.input_select("cmap", "Colormap", ["warm", "redyell", "winter", "actc"])
    ui.input_slider("thresh", "Threshold |z|", 0.0, 6.0, value=2.3, step=0.1)
    ui.input_slider("opacity", "Opacity", 0.0, 1.0, value=0.8, step=0.05)


@render_niivue
def brain():
    nv = NiiVue()
    nv.load_volumes(
        [
            Volume(url="https://niivue.com/demos/images/mni152.nii.gz"),
            Volume(
                url="https://niivue.com/demos/images/narps-4735_50GV-hypo1_unthresh.nii.gz",
                colormap="warm",
                cal_min=2.3,
                cal_max=6.0,
                opacity=0.8,
            ),
        ]
    )
    return nv


@reactive.effect
def _():
    overlay = brain.widget.volumes[1]
    brain.widget.set_colormap(overlay.id, input.cmap())
    overlay.cal_min = input.thresh()
brain.widget.set_opacity(1, input.opacity())| Threshold |z| = 2.3 | Threshold |z| = 4.0 |
|---|---|
 |
 |
Cortical surface meshes with a functional overlay
Meshes (.mz3, .gii, .obj, and more) render alongside or instead of volumes. A MeshLayer drapes a scalar map (here, a motor-task activation map) on top of the surface.
from ipyniivue import Mesh, MeshLayer, NiiVue
from shiny.express import ui
from shinywidgets import render_niivue

ui.page_opts(title="Cortical surface mesh", fillable=True)


@render_niivue
def brain():
    nv = NiiVue()
    nv.load_meshes(
        [
            Mesh(
                url="https://niivue.com/demos/images/BrainMesh_ICBM152.lh.mz3",
                rgba255=[200, 200, 200, 255],
                layers=[
                    MeshLayer(
                        url="https://niivue.com/demos/images/BrainMesh_ICBM152.lh.motor.mz3",
                        colormap="warm",
                        opacity=0.7,
                    )
                ],
            )
        ]
    )
    return nv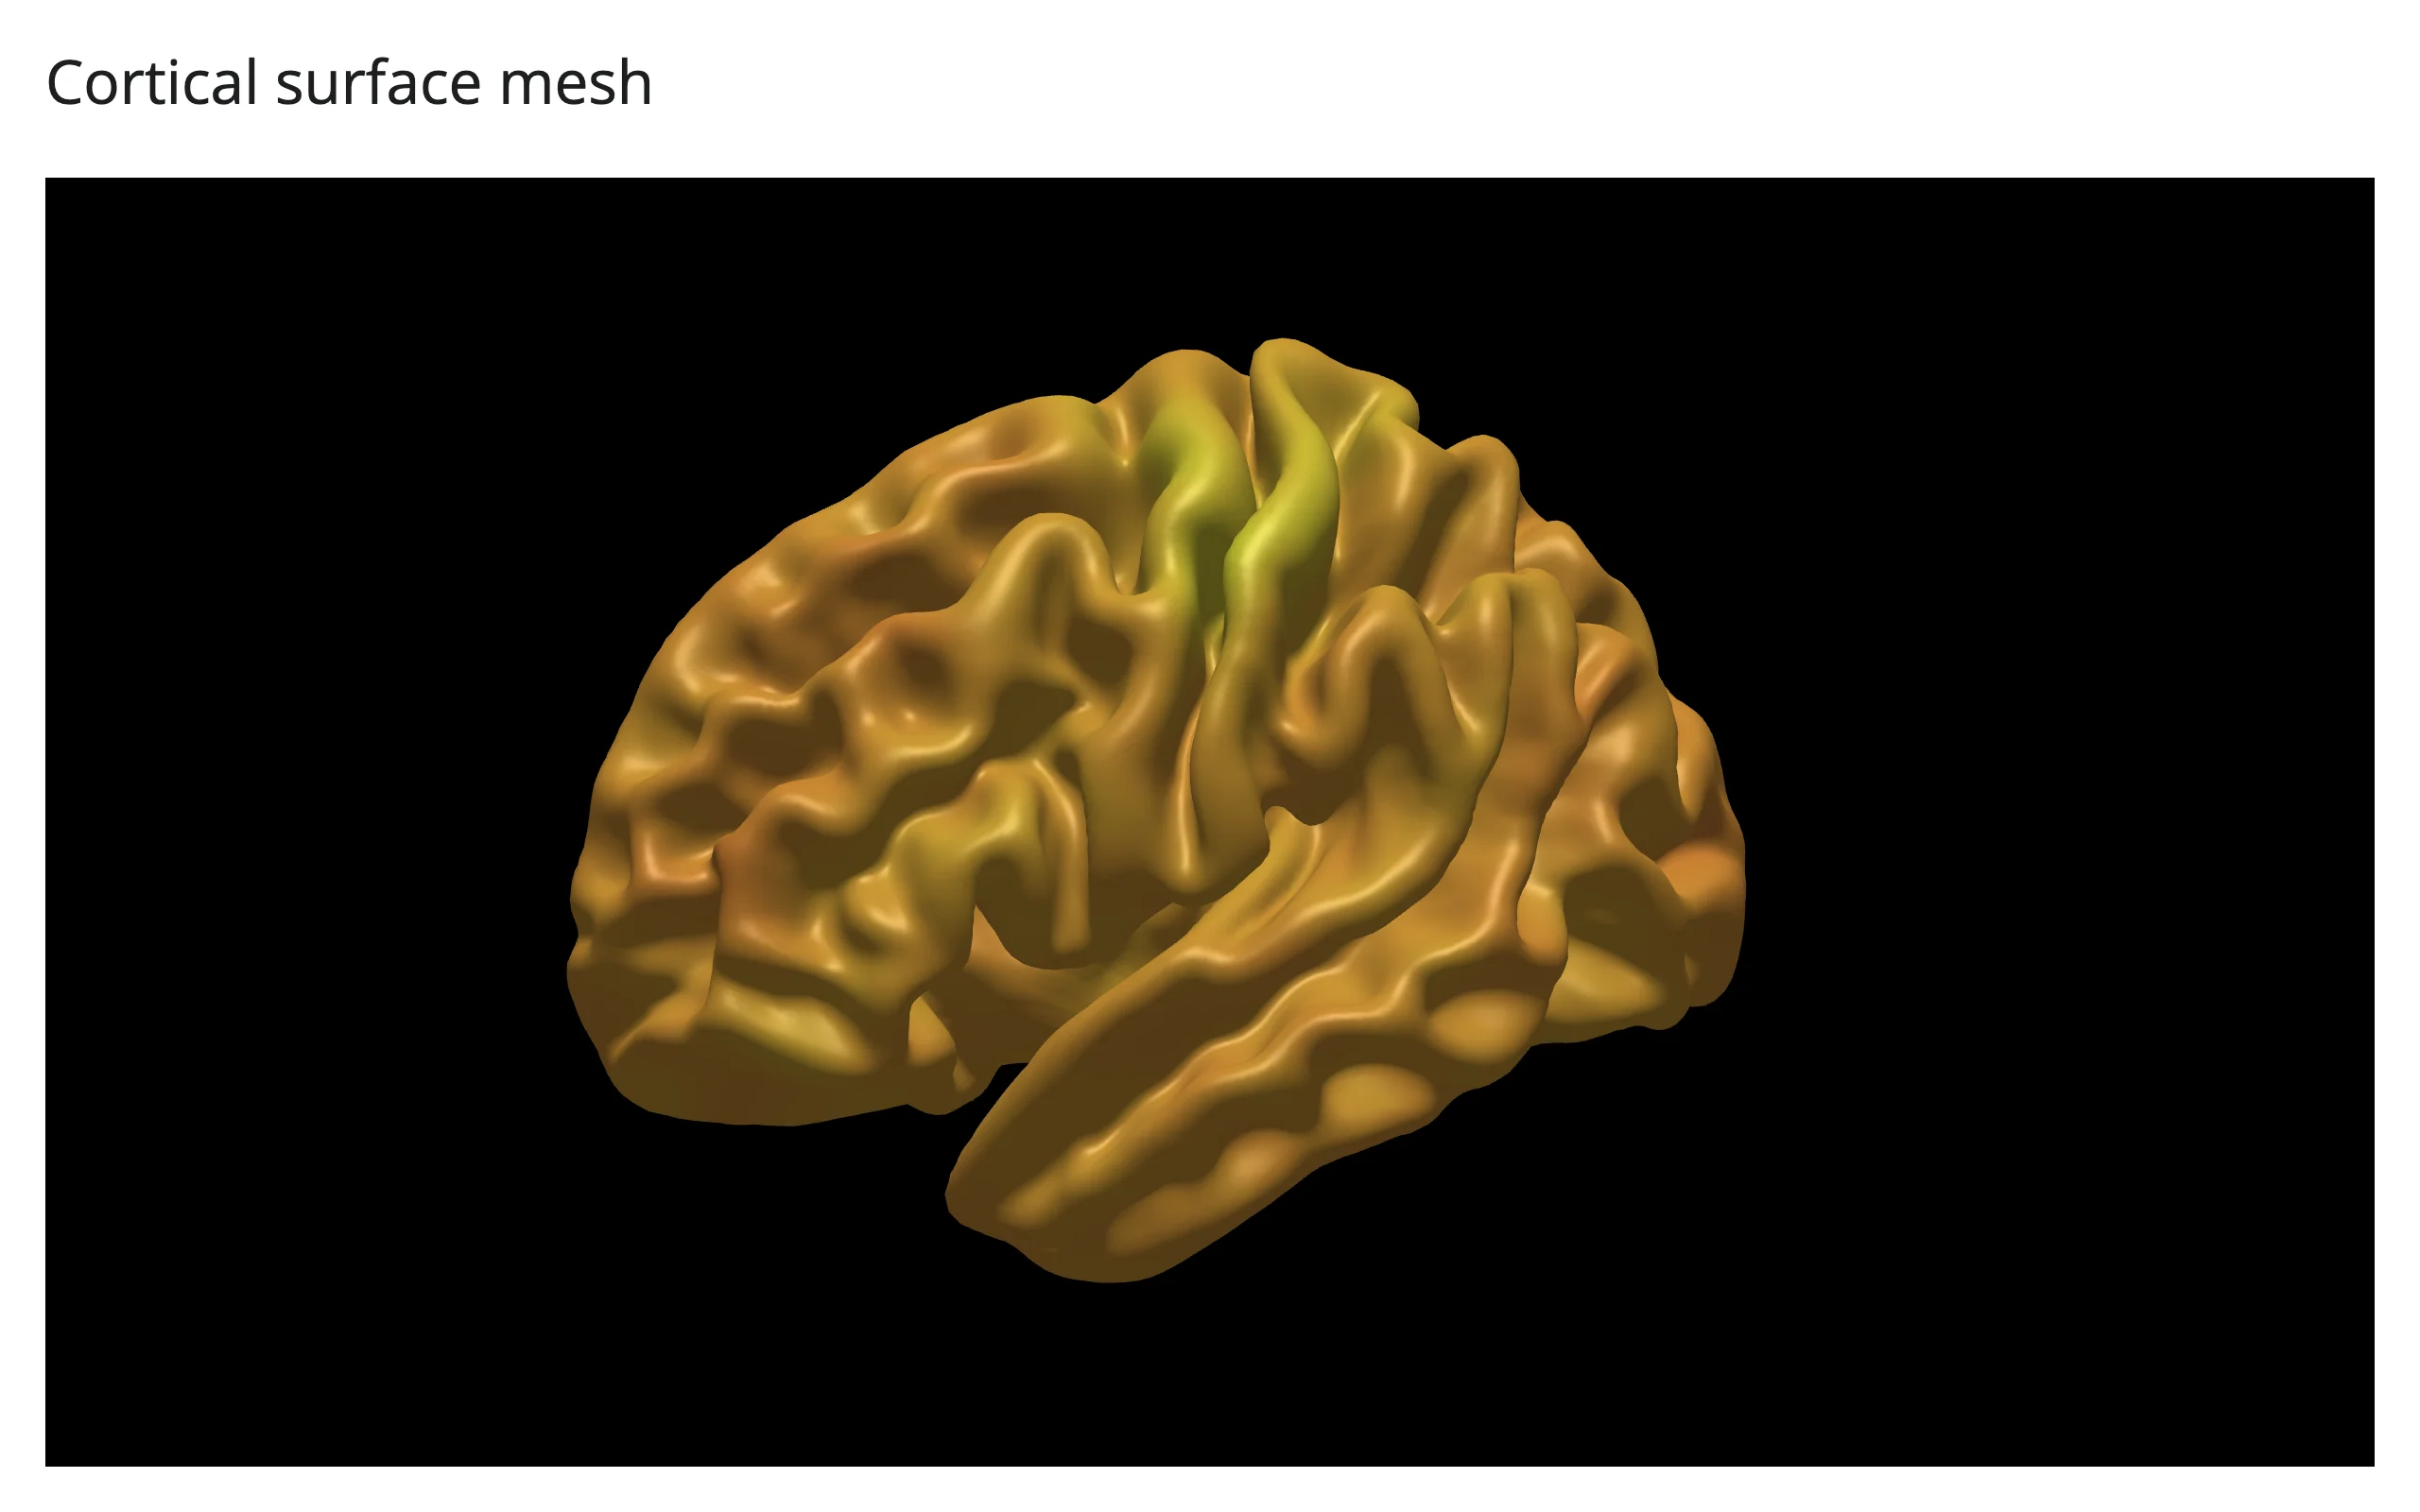
Your own numpy array, three lines
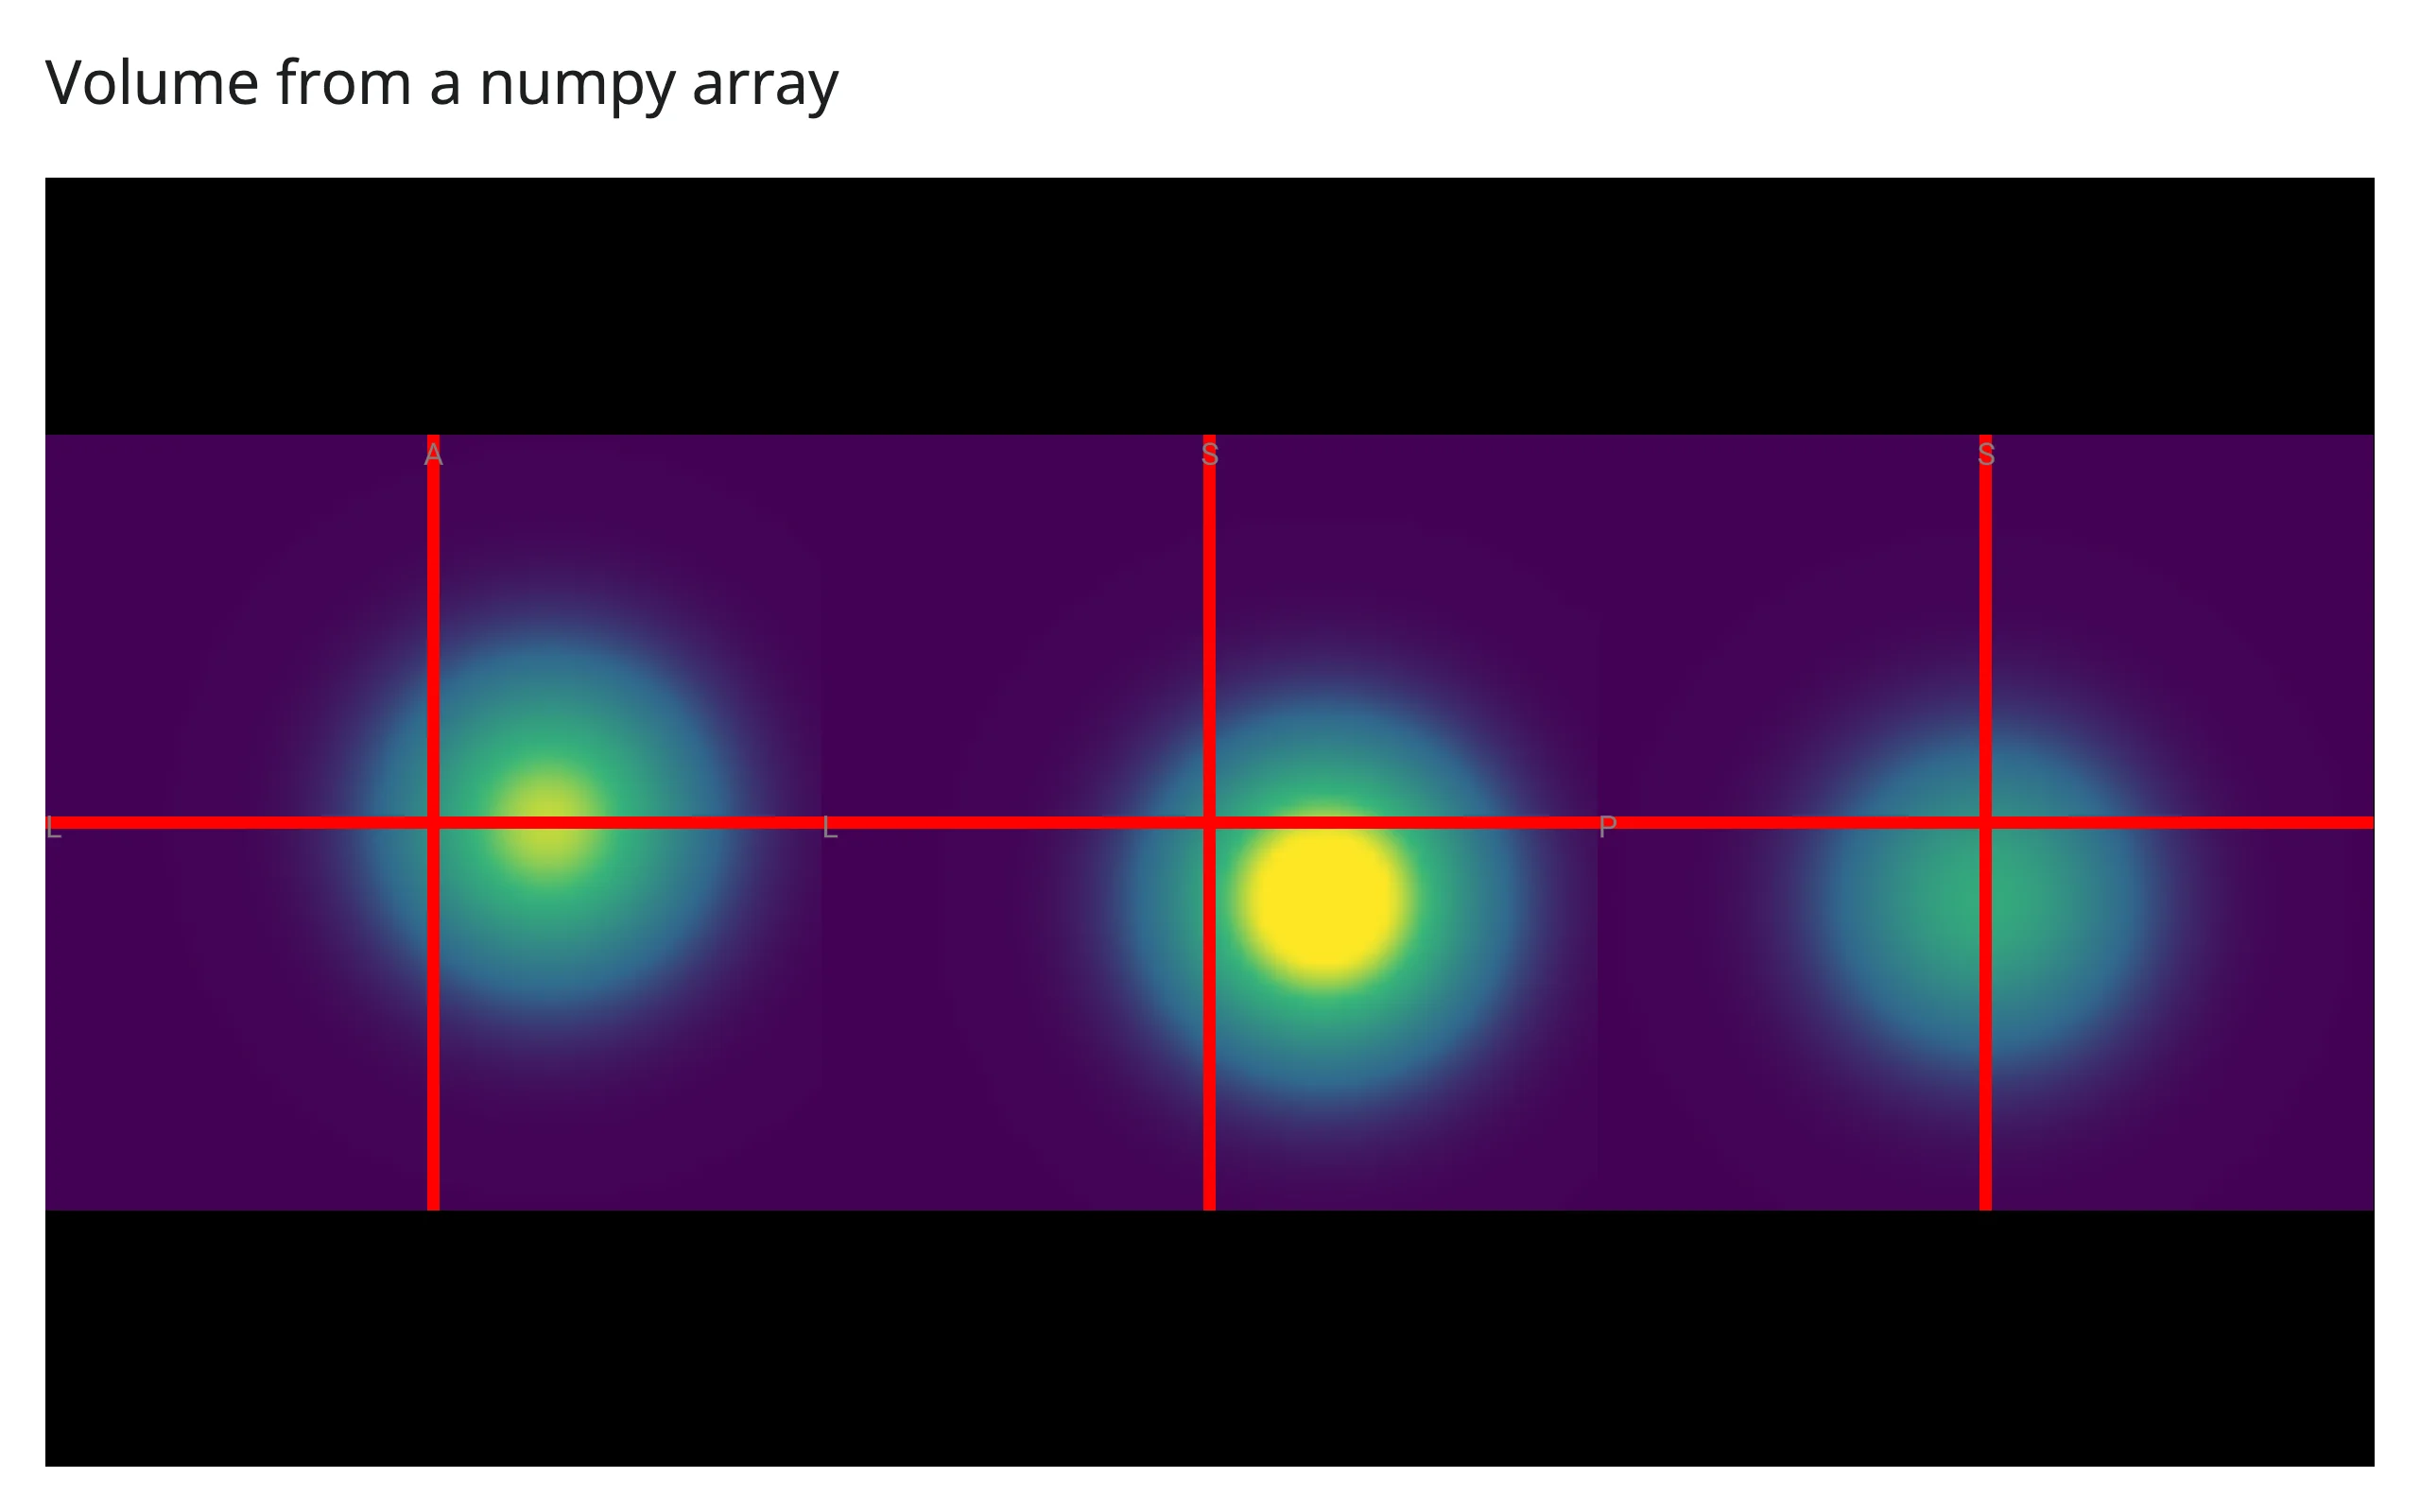
Any 3D numpy array can become a volume: wrap it with nibabel, write it to an in-memory buffer, and hand the bytes to Volume(data=...). No file on disk, no server round trip beyond the initial render. name= is required when using data= (NiiVue uses it to label the volume; there’s no file path to infer one from).
from io import BytesIO

import nibabel as nib
import numpy as np
from ipyniivue import NiiVue, Volume
from shiny.express import ui
from shinywidgets import render_niivue

ui.page_opts(title="Volume from a numpy array", fillable=True)

# A smooth synthetic blob: a Gaussian bump off-center in a 64^3 volume.
grid = np.linspace(-1, 1, 64)
x, y, z = np.meshgrid(grid, grid, grid, indexing="ij")
data = np.exp(-(((x - 0.3) ** 2 + y**2 + (z + 0.2) ** 2) / 0.15)).astype(np.float32)

img = nib.Nifti1Image(data, affine=np.eye(4))
buffer = BytesIO()
img.to_file_map({"image": nib.FileHolder(fileobj=buffer)})


@render_niivue
def brain():
    nv = NiiVue()
    nv.load_volumes(
        [Volume(data=buffer.getvalue(), name="blob.nii", colormap="viridis")]
    )
    return nv
examples/05_numpy_volume.py (needs nibabel)
4D volumes
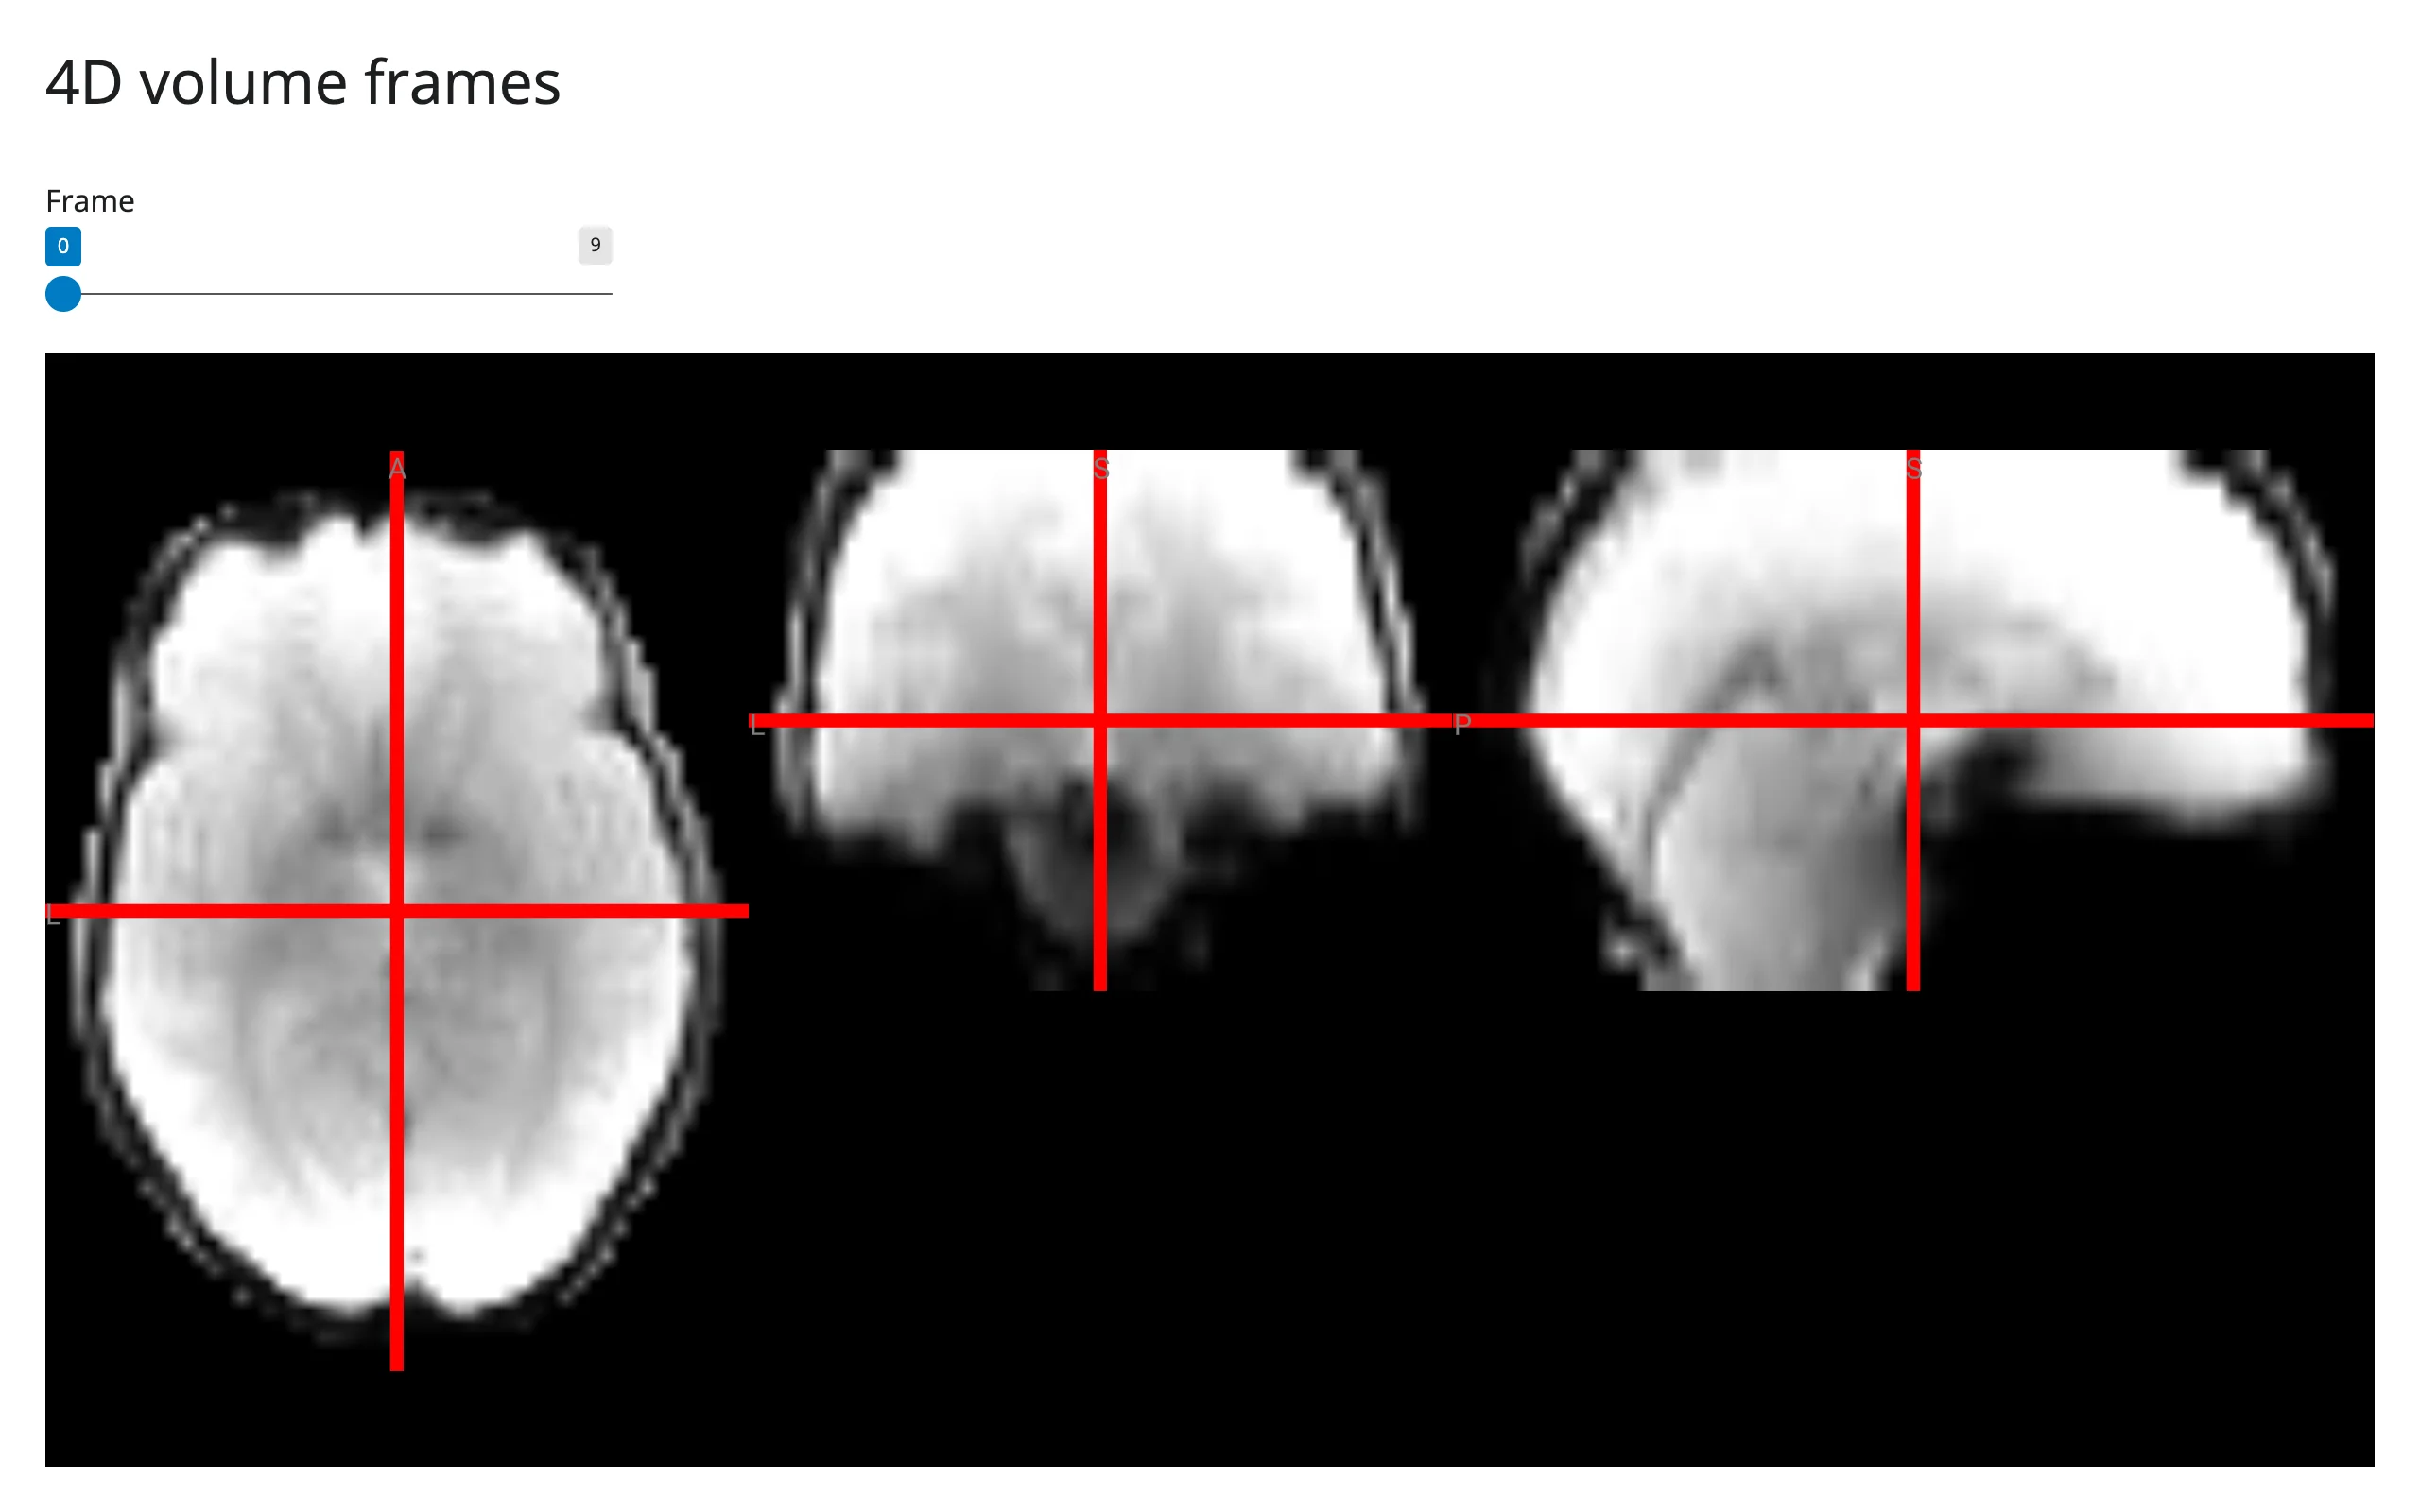
A 4D NIfTI (here, a perfusion MRI time series) carries a frame_4d trait on its Volume: set it to scrub through frames in place.
from ipyniivue import NiiVue, Volume
from shiny import reactive
from shiny.express import input, ui
from shinywidgets import render_niivue

ui.page_opts(title="4D volume frames", fillable=True)
ui.input_slider("frame", "Frame", 0, 9, value=0)


@render_niivue
def brain():
    nv = NiiVue()
    nv.load_volumes([Volume(url="https://niivue.com/demos/images/pcasl.nii.gz")])
    return nv


@reactive.effect
def _():
brain.widget.volumes[0].frame_4d = input.frame()| Frame 0 | Frame 8 |
|---|---|
 |
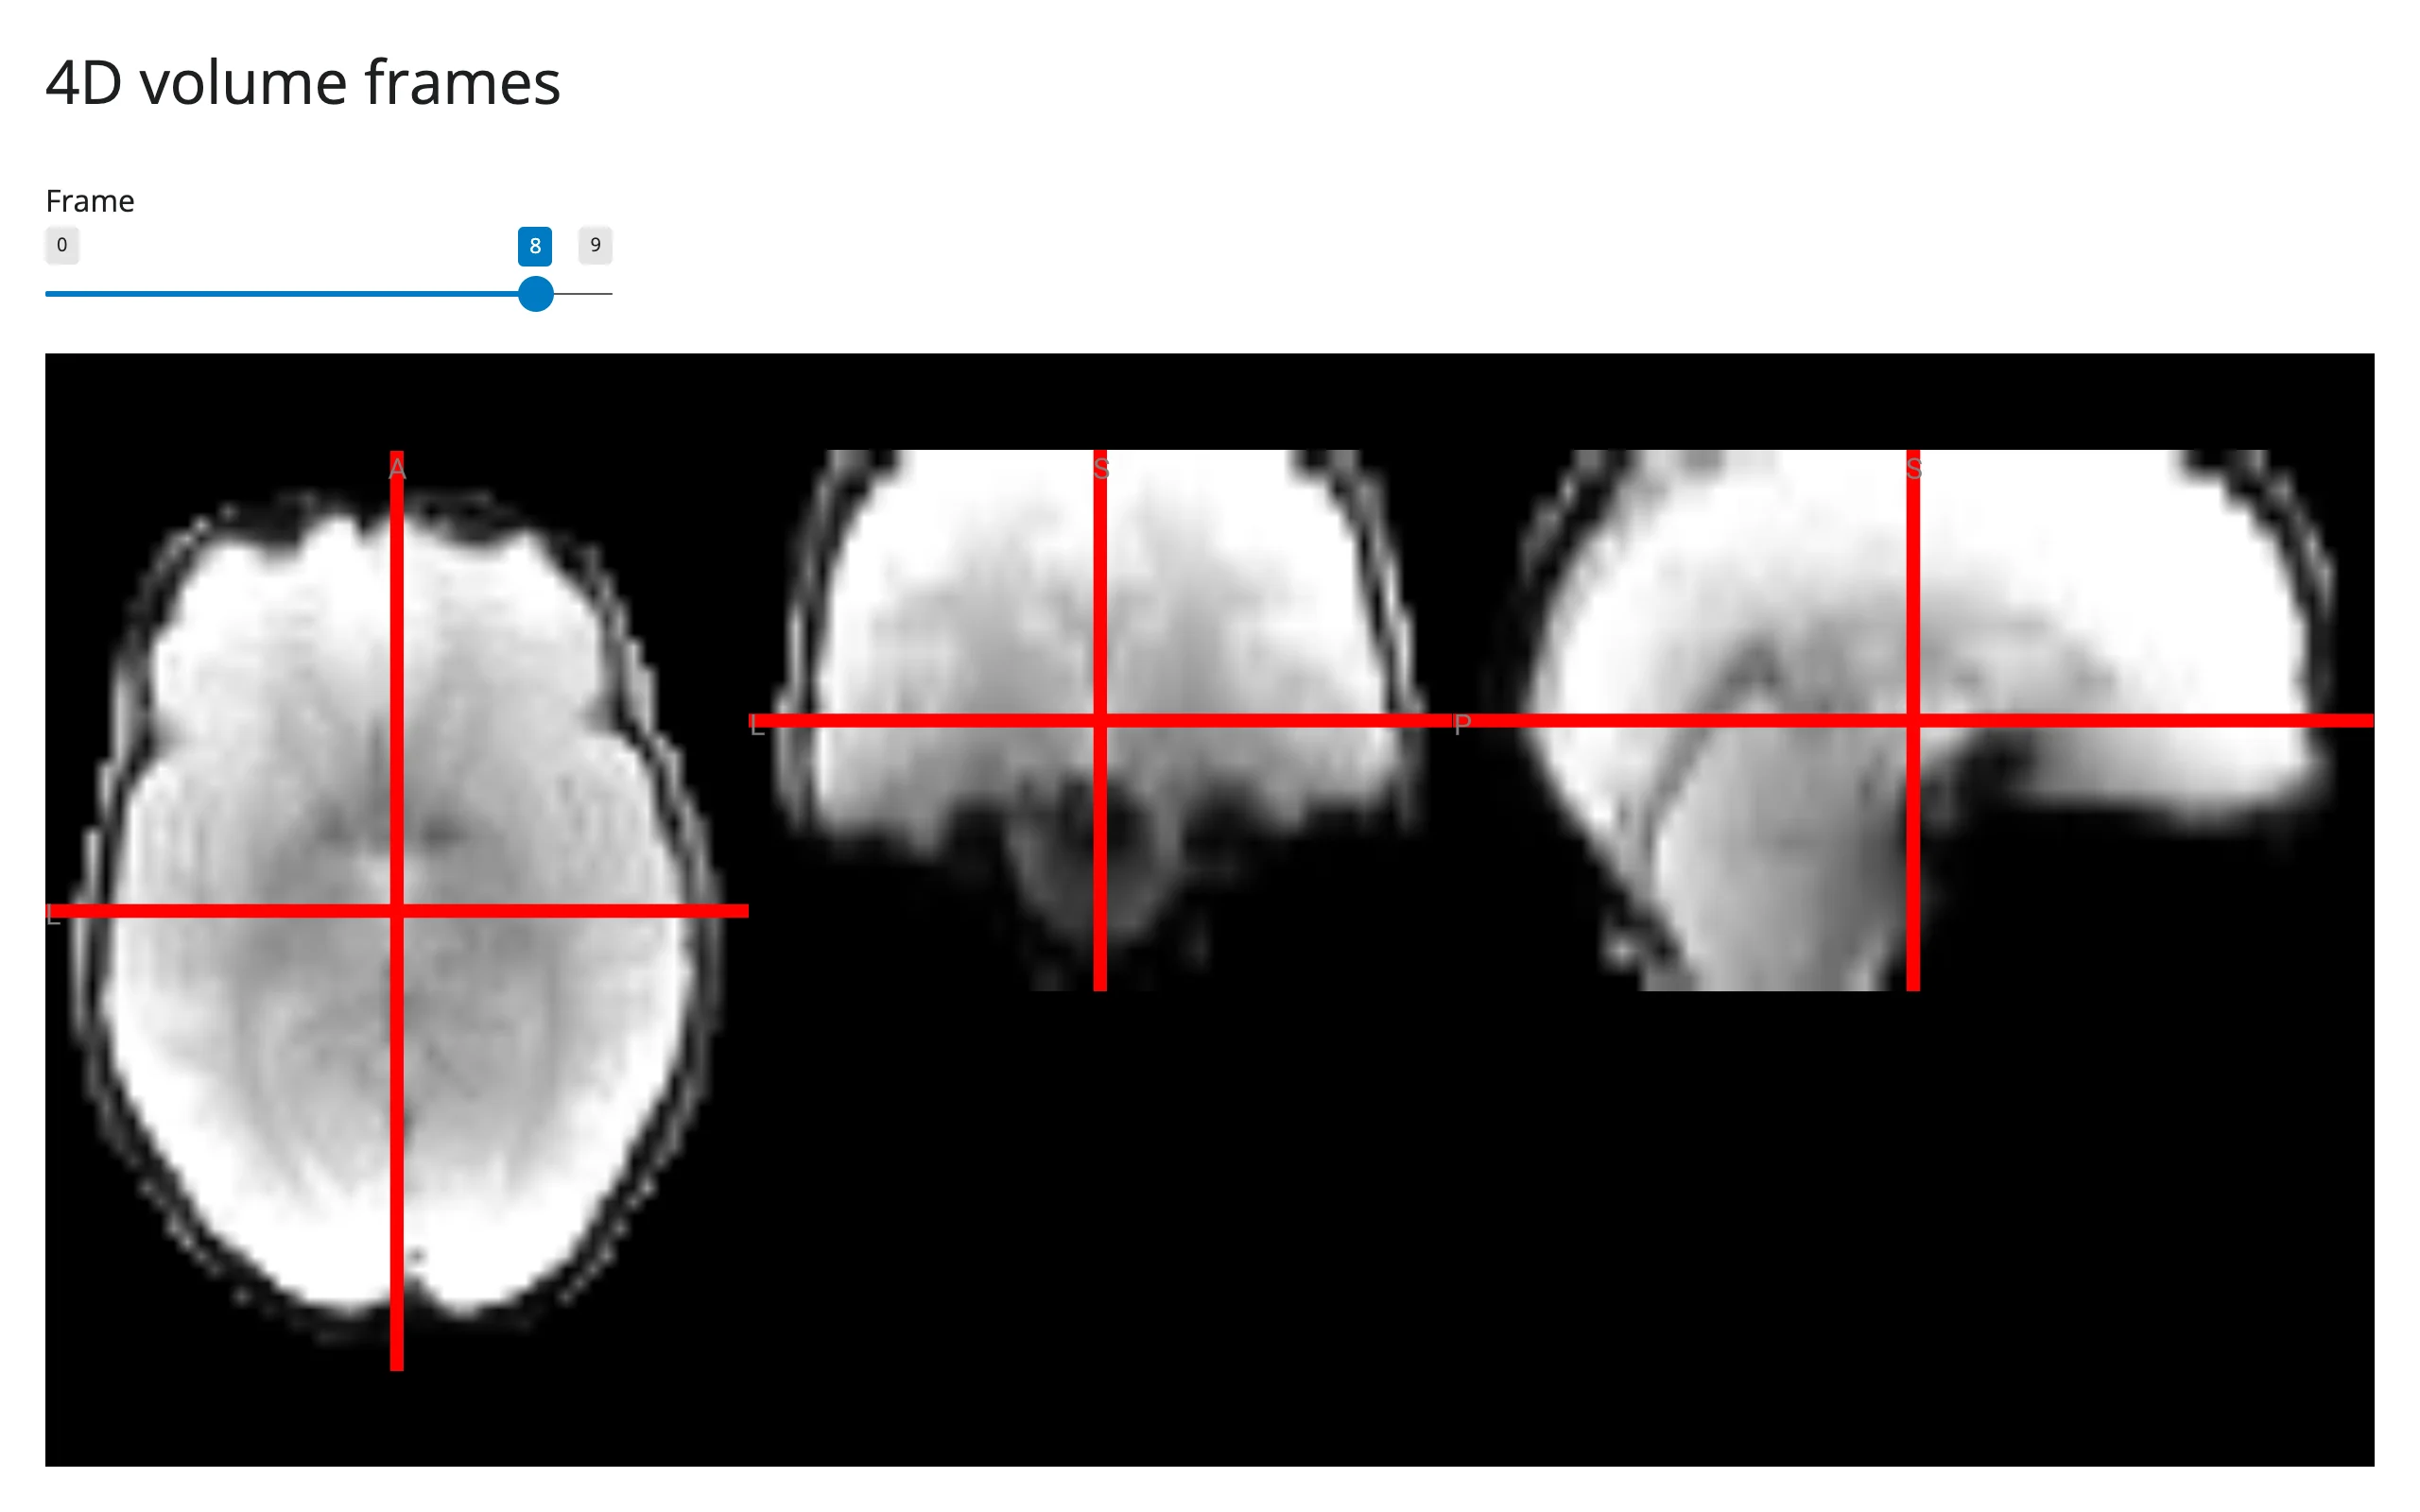 |
This particular scan (arterial spin labeling perfusion) has subtle frame-to-frame differences by design; the pattern is the point, not the drama of this dataset.
Reacting to user interaction
Accessor reference
| accessor | returns | before any interaction | across re-render | default rate policy |
|---|---|---|---|---|
location() |
dict (ax_cor_sag, frac, mm, vox, values, string, xy) |
seeded value: {"frac": [0.5, 0.5, 0.5], "seeded": True} (the volume center) |
re-seeded from the new viewer | debounce, 250 ms |
location(): the crosshair as an input
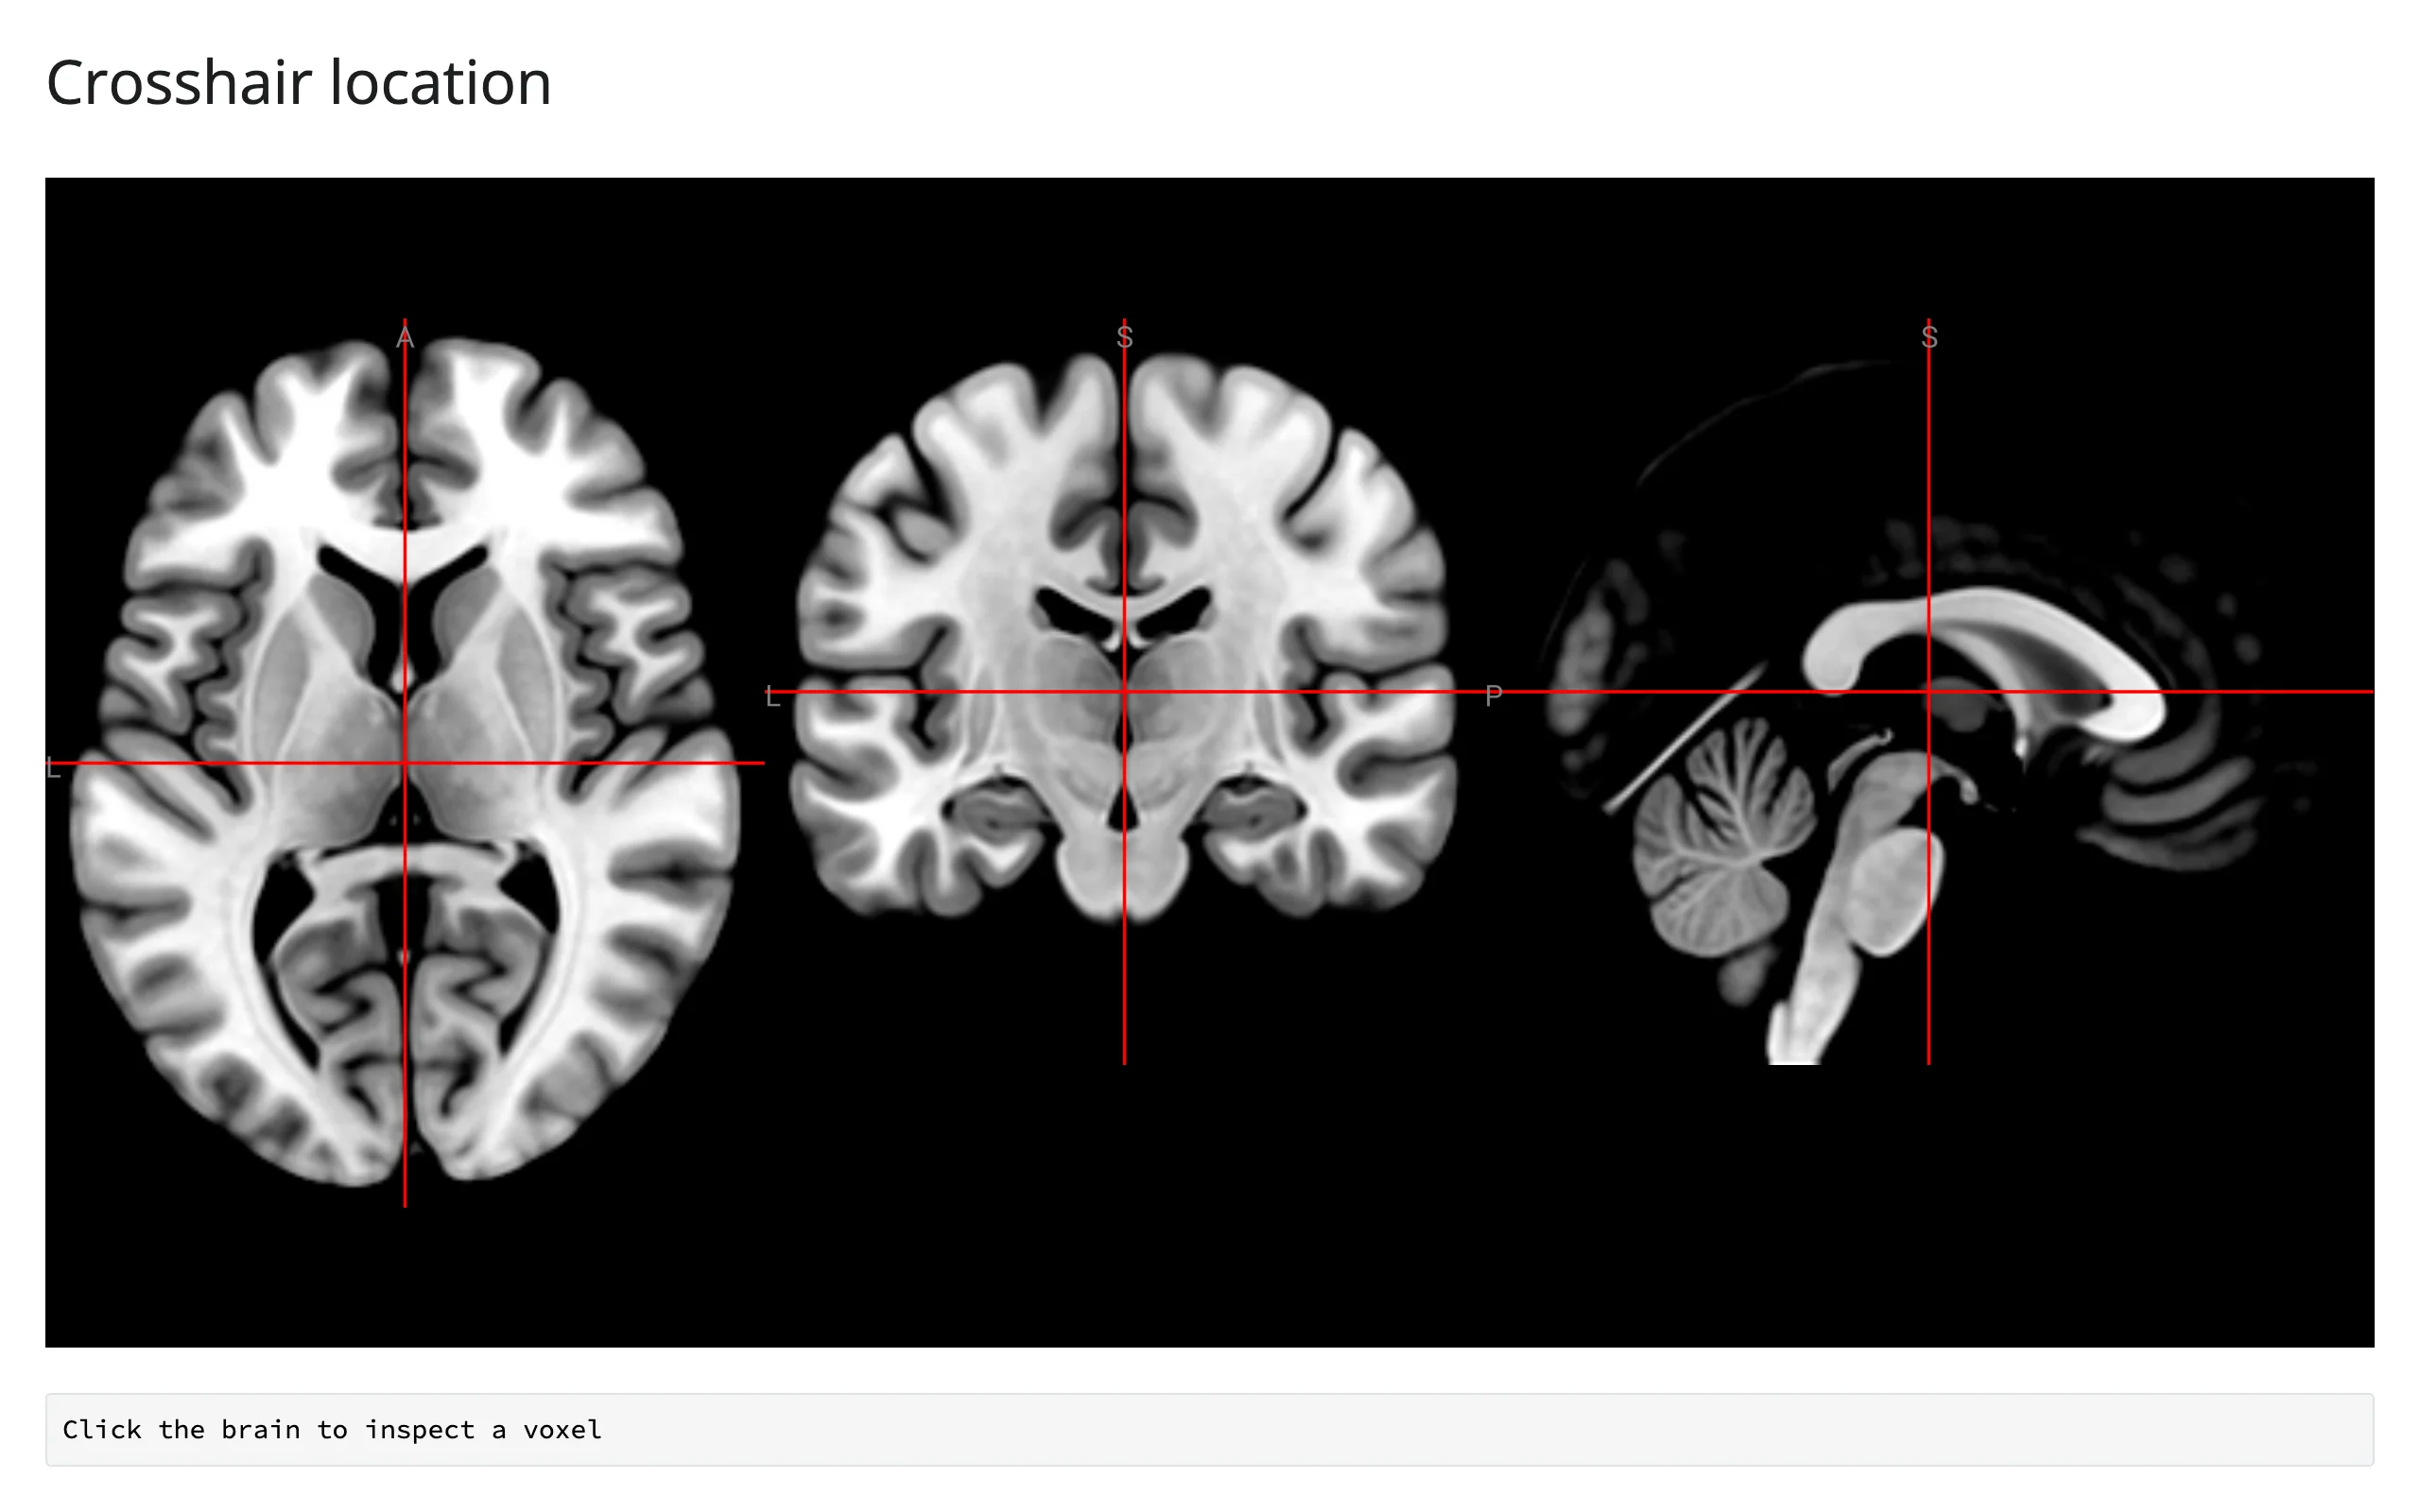
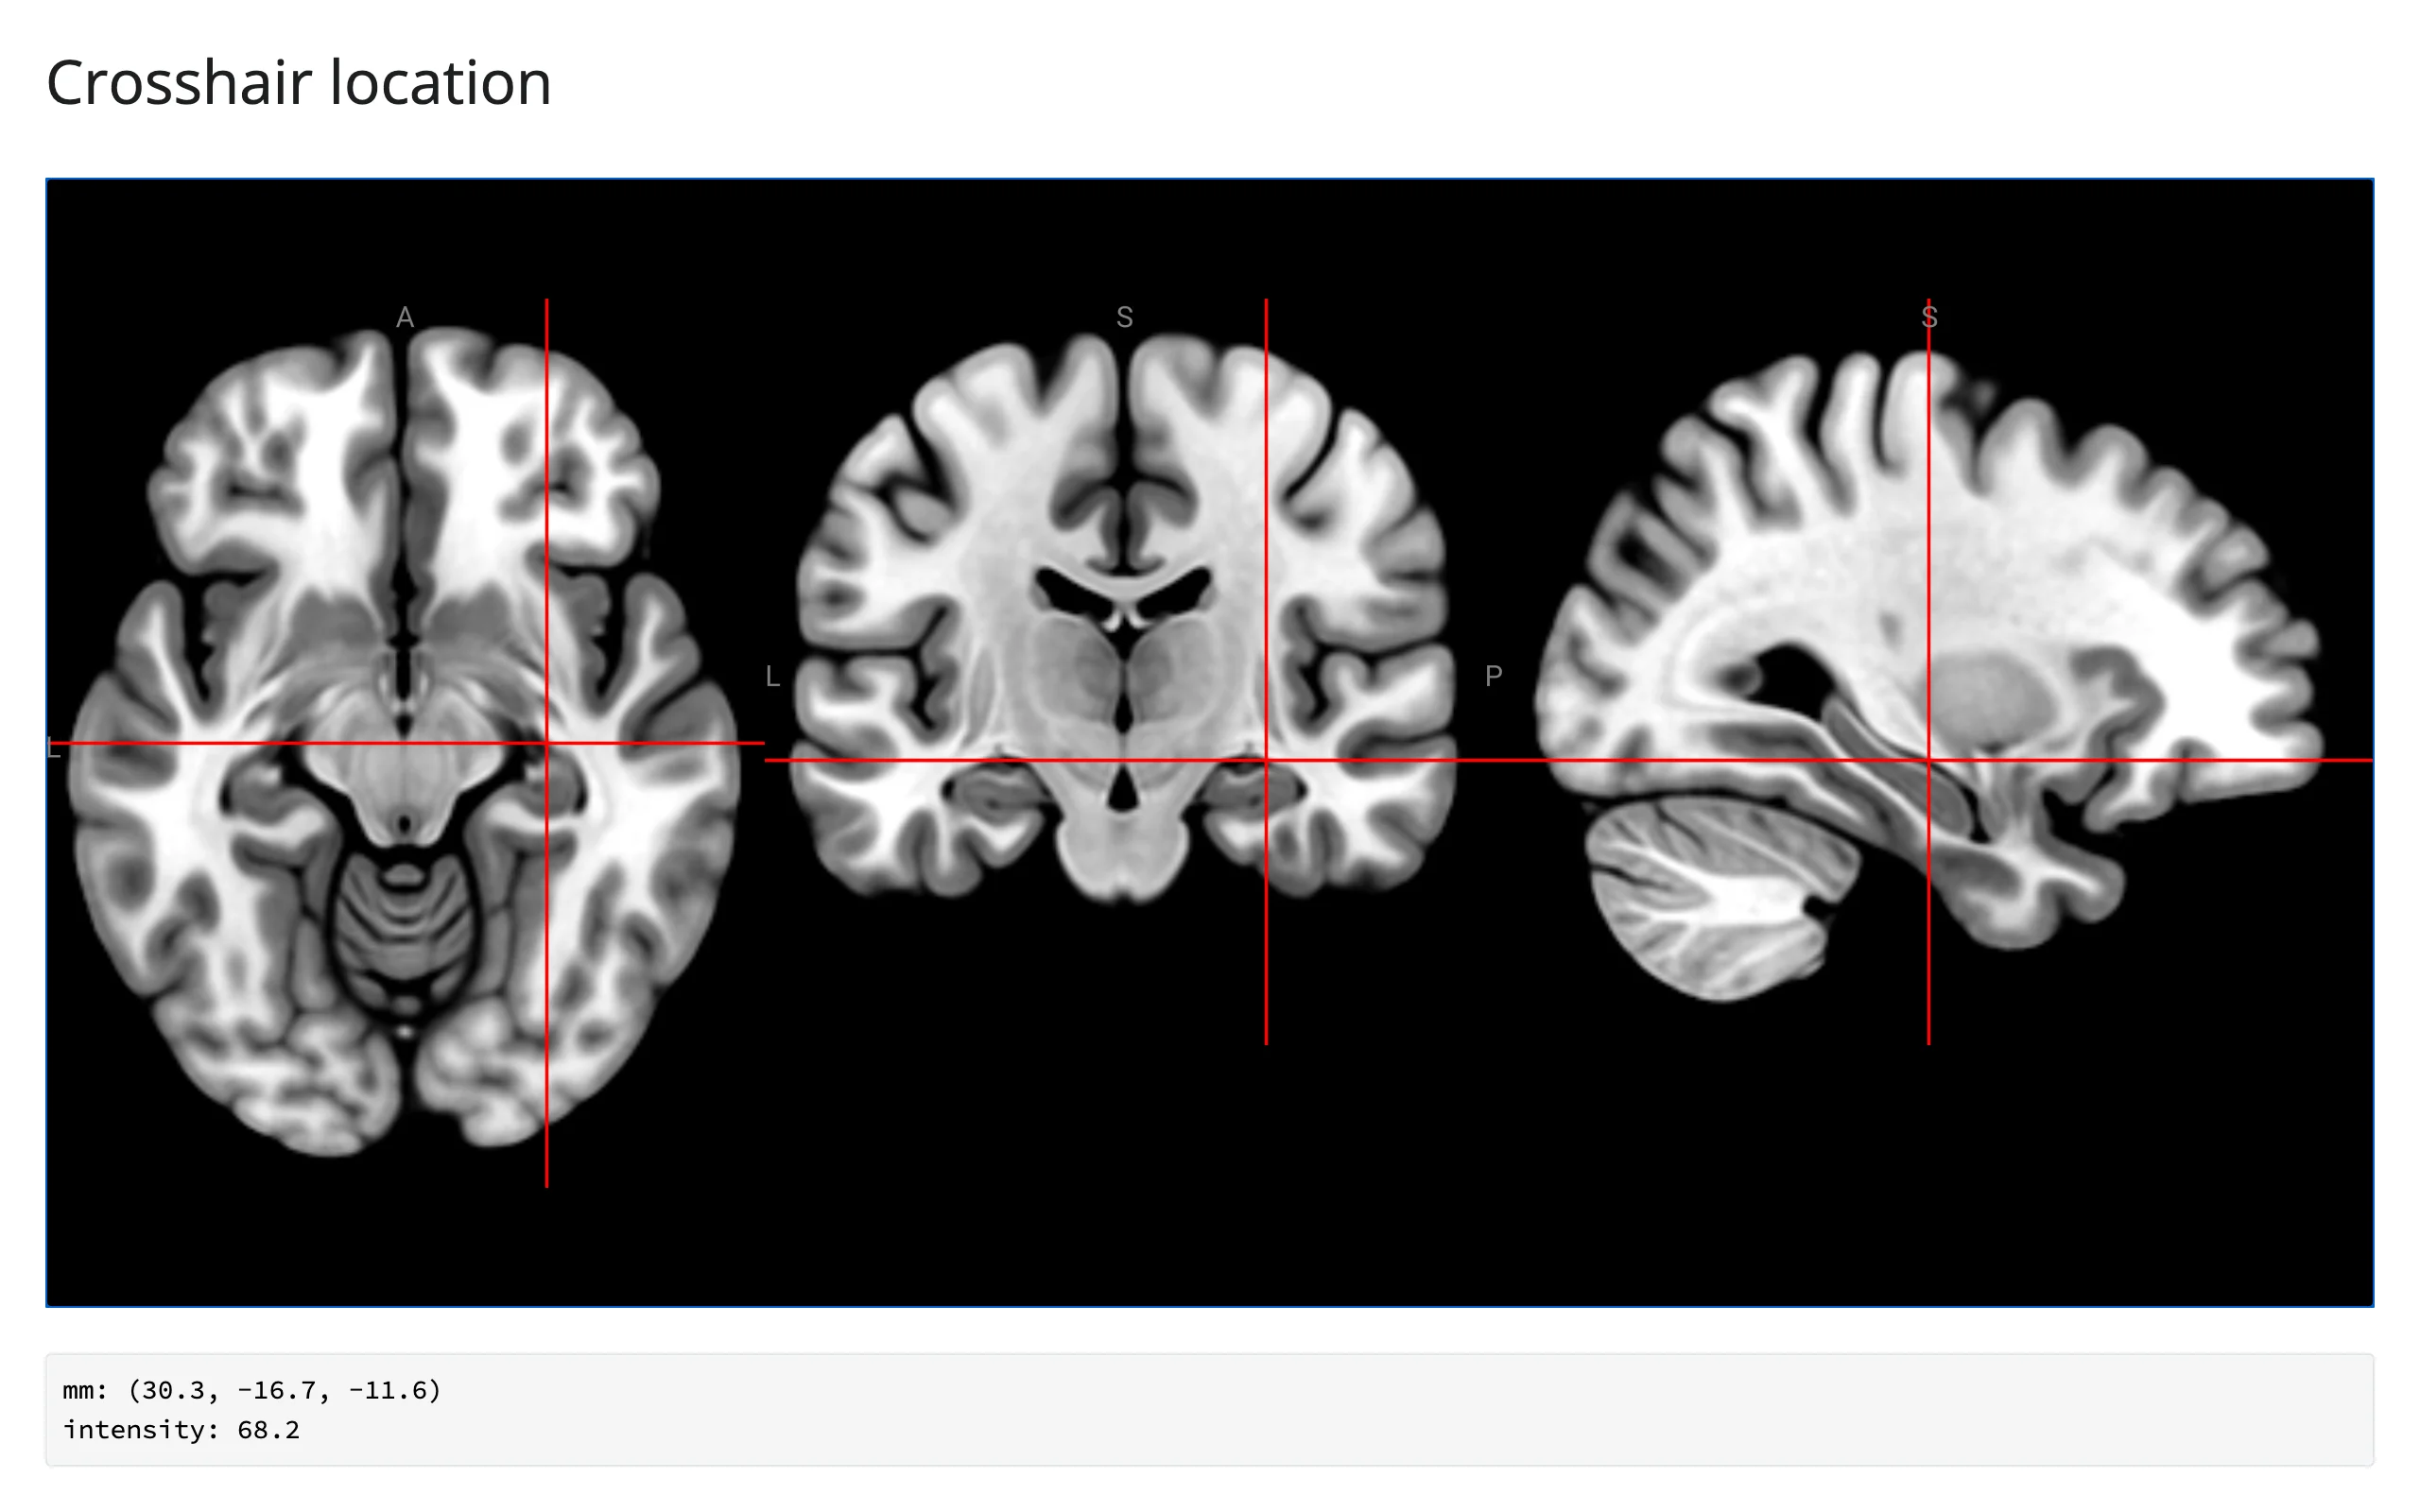
location() reads like a Shiny input: call it inside a reactive function and that function re-runs on every crosshair move. It never returns None – it’s seeded at render with the volume center ({"frac": [0.5, 0.5, 0.5], "seeded": True}), before the user has clicked anything, and a click or drag replaces it with the full payload. Check loc.get("seeded") to tell “showing the center, nothing clicked yet” from a real crosshair report; a re-render builds a new viewer and re-seeds back to the center, so a dashboard reset or a tab switch that re-renders the output clears any prior click the same way.
from ipyniivue import NiiVue, Volume
from shiny.express import render, ui
from shinywidgets import render_niivue

ui.page_opts(title="Crosshair location", fillable=True)


@render_niivue
def brain():
    nv = NiiVue()
    nv.load_volumes([Volume(url="https://niivue.com/demos/images/mni152.nii.gz")])
    return nv


@render.code
def readout():
    loc = brain.location()
    if loc.get("seeded"):
        return "Click the brain to inspect a voxel"
    mm = loc["mm"][:3]
    value = loc["values"][0]["value"]
return f"mm: ({mm[0]:.1f}, {mm[1]:.1f}, {mm[2]:.1f})\nintensity: {value:.1f}"| Before | After clicking |
|---|---|
 |
 |
The payload, verified live:
mm: a 4-vector[x, y, z, 1](the trailing1is a homogeneous-coordinate artifact; slice to[:3]).vox: integer voxel indices[i, j, k]into the first loaded volume’s array.frac: the first volume’s voxel position as a fraction of its dimensions (0.0-1.0per axis) – this is the coordinate spacescene.crosshair_posuses (see “Jumping the crosshair” below).values: a list with one entry per loaded volume, in load order –{"name", "value", "id", "mm", "vox"}– each with its ownvox/mm, since different volumes can have different voxel grids.values[i]does not round or formatvalue; it’s a raw float.string: NiiVue’s own formatted summary ("-46×-17×11×0 = 34.844 "), handy for a quick label.ax_cor_sag: which of the three 2D views the event came from (0axial,1coronal,2sagittal).
Reading on demand: bookmark the crosshair
Because location() is live from the moment the viewer renders and keeps reporting whether or not anything has read it yet, it’s safe to read from a button handler that doesn’t run until well after the user clicked – no warm-up read needed first. This button appends the crosshair’s current position to a running list of bookmarks each time it’s pressed.
from ipyniivue import NiiVue, Volume
from shiny import reactive
from shiny.express import input, render, ui
from shinywidgets import render_niivue

ui.page_opts(title="Bookmark the crosshair", fillable=True)
ui.input_action_button("bookmark", "Bookmark this spot")

bookmarks = reactive.Value([])


@render_niivue
def brain():
    nv = NiiVue()
    nv.load_volumes([Volume(url="https://niivue.com/demos/images/mni152.nii.gz")])
    return nv


@reactive.effect
@reactive.event(input.bookmark)
def _():
    loc = brain.location()
    if loc.get("seeded"):
        return  # nothing clicked yet -- don't bookmark the volume center
    mm = loc["mm"][:3]
    bookmarks.set([*bookmarks(), f"({mm[0]:.0f}, {mm[1]:.0f}, {mm[2]:.0f}) mm"])


@render.ui
def saved():
    if not bookmarks():
        return ui.p("No bookmarks yet.")
    return ui.tags.ul(*[ui.tags.li(b) for b in bookmarks()])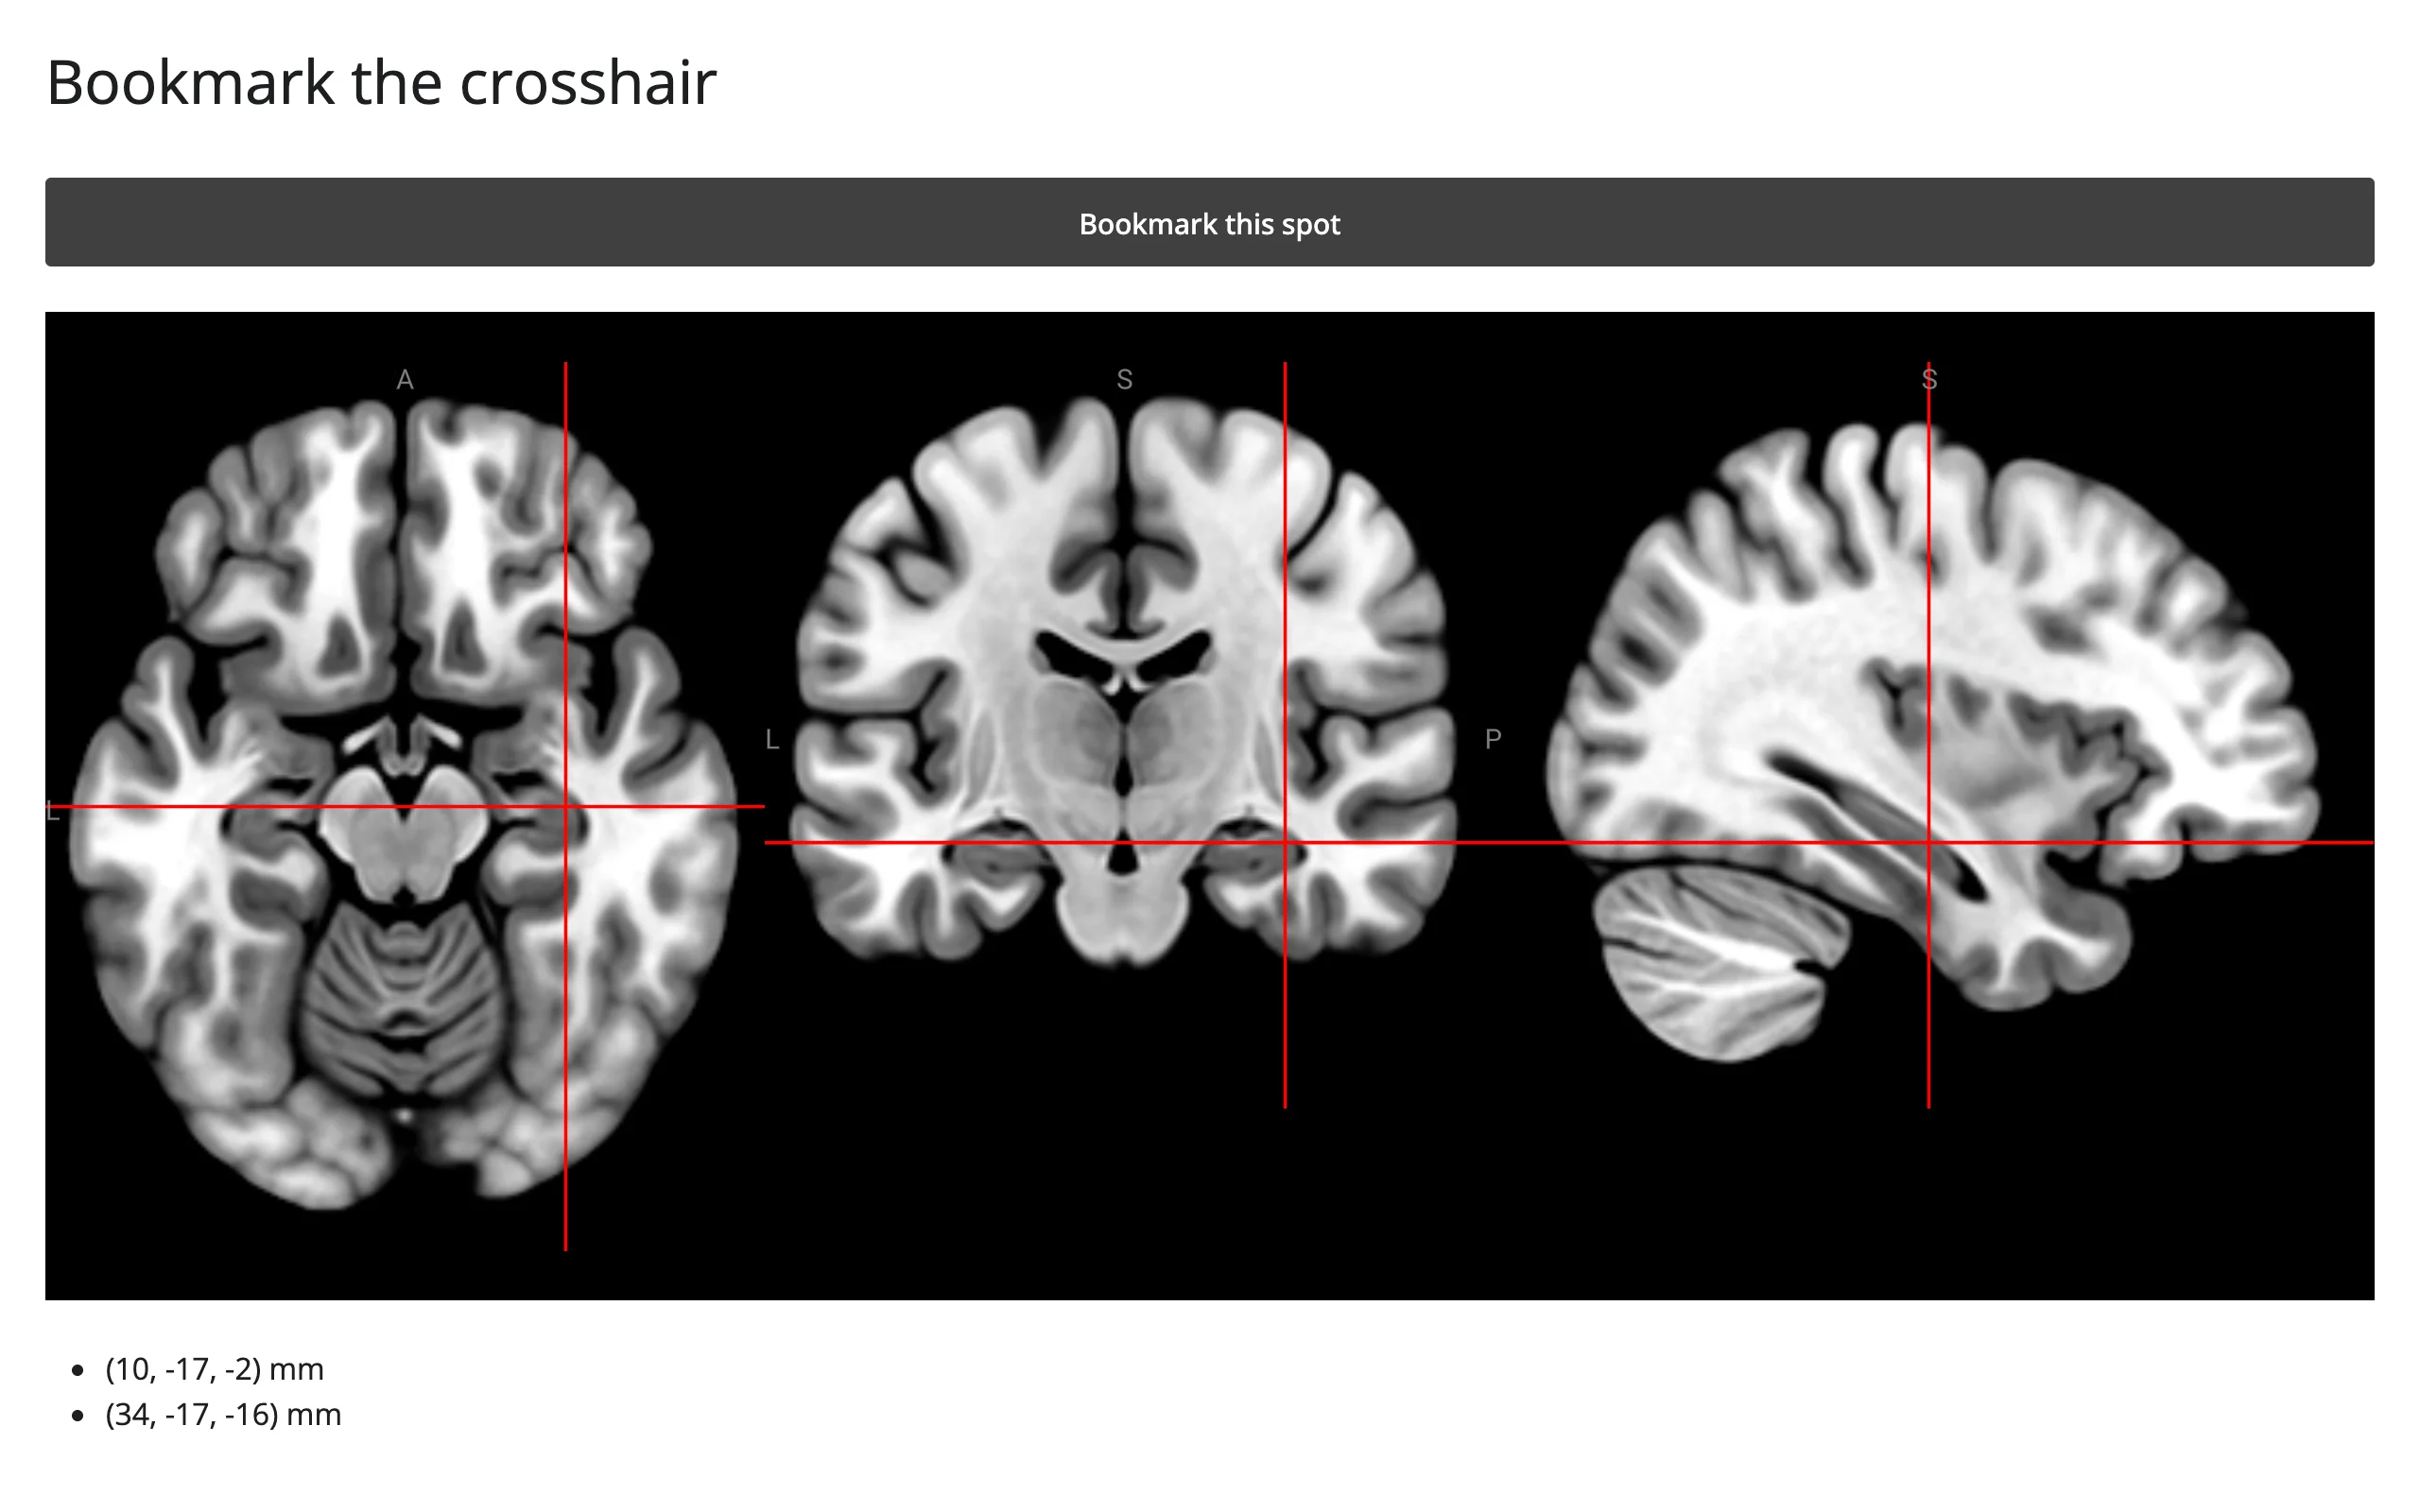
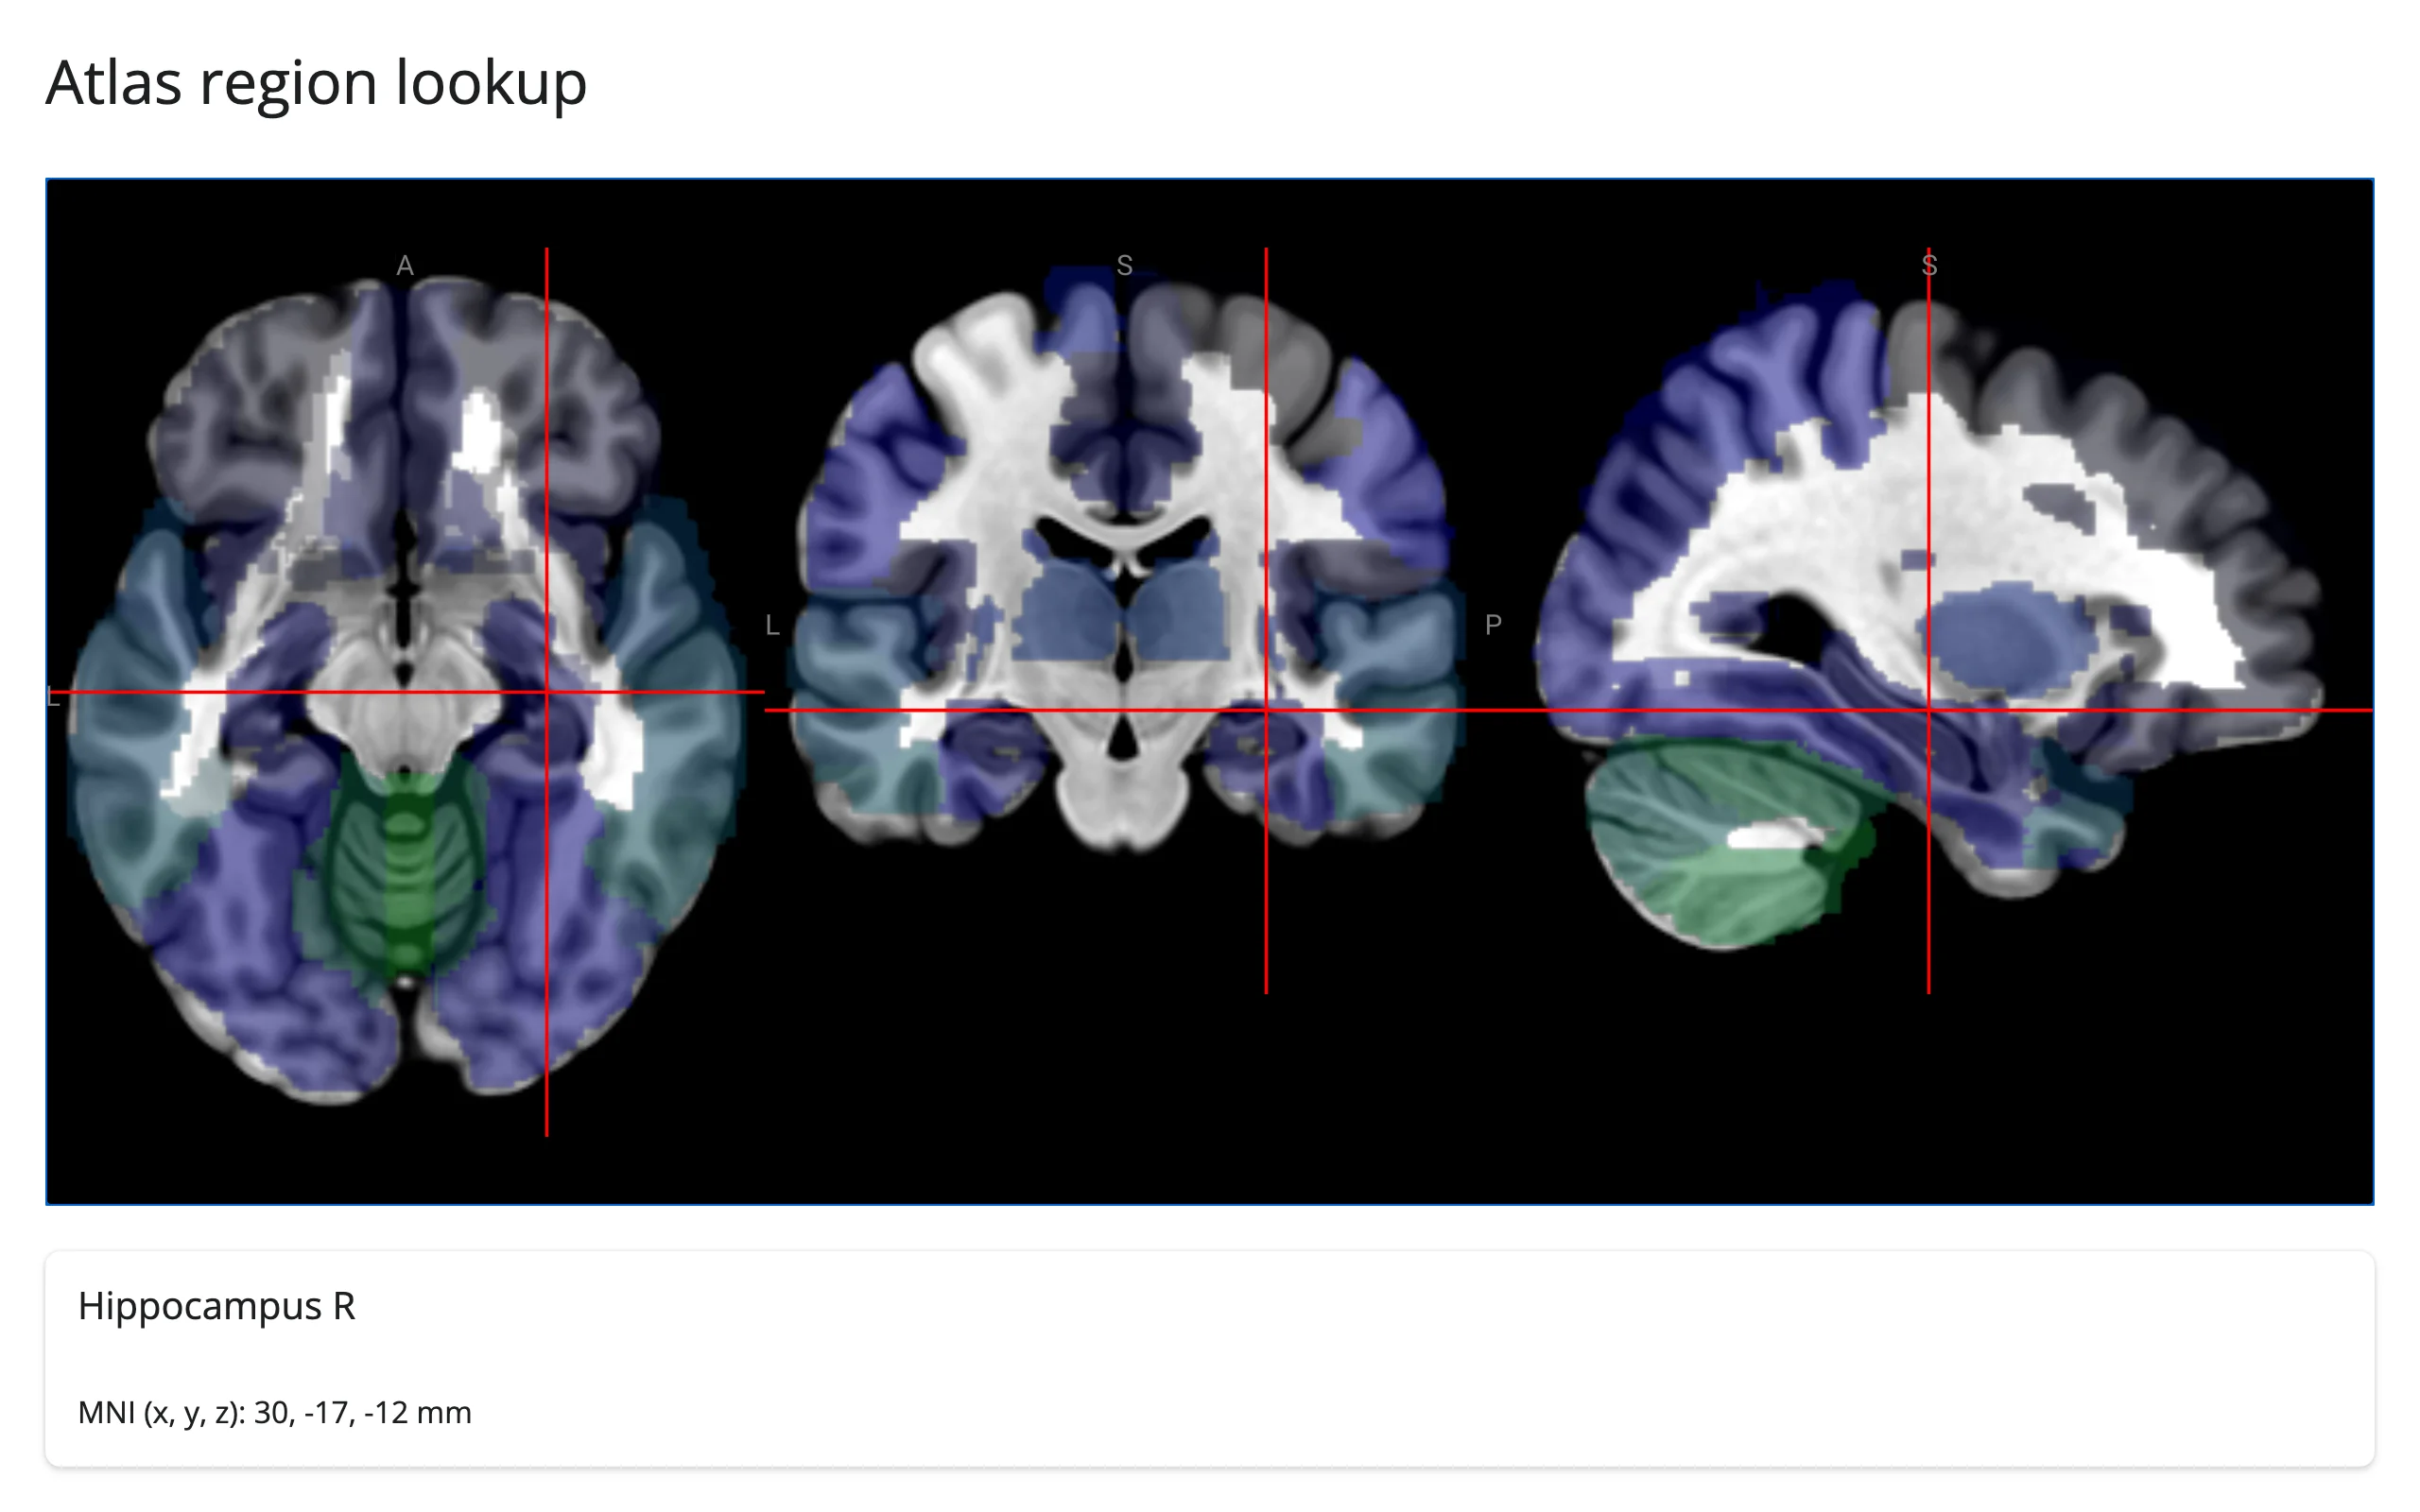
Voxel value to atlas label (click -> detail card)
Loading a label atlas (here, AAL) as a second volume turns location()["values"][1]["value"] into a region index – no coordinate math needed, since NiiVue already looked up the intensity at the crosshair for that volume’s own voxel grid. Match it against the atlas’s label list (fetched once from the same JSON NiiVue itself uses) for a human-readable name. This indexes the same way ipyniivue.LUT.labels does – both treat the label array as directly indexed by the intensity/palette value, with index 0 reserved for background ("Air" in this LUT) – so reading the plain JSON here gives the same mapping you’d get by constructing a LUT from it and reading .labels[region_index].
import json
import urllib.request

from ipyniivue import NiiVue, Volume
from shiny import ui as core_ui
from shiny.express import render, ui
from shinywidgets import render_niivue

ui.page_opts(title="Atlas region lookup", fillable=True)

with urllib.request.urlopen("https://niivue.com/demos/images/aal.json") as resp:
    AAL_LABELS = json.load(resp)["labels"]


@render_niivue
def brain():
    nv = NiiVue()
    nv.load_volumes(
        [
            Volume(url="https://niivue.com/demos/images/mni152.nii.gz"),
            Volume(
                url="https://niivue.com/demos/images/aal.nii.gz",
                colormap="actc",
                opacity=0.5,
            ),
        ]
    )
    return nv


@render.ui
def region_card():
    loc = brain.location()
    if loc.get("seeded"):
        return ui.p("Click a region to identify it.")
    region_index = round(loc["values"][1]["value"])
    region = AAL_LABELS[region_index] if region_index else "none (background)"
    mm = loc["mm"][:3]
    return core_ui.card(
        ui.h5(region.replace("_", " ")),
        f"MNI (x, y, z): {mm[0]:.0f}, {mm[1]:.0f}, {mm[2]:.0f} mm",
    )
Note the shiny.ui.card/shiny.express.ui split: inside a @render.ui function you build and return a value, so you need the core shiny.ui constructors (which take children as positional arguments); shiny.express.ui’s layout components like card are context managers for the page body, not value-returning functions.
Crosshair to a 4D time series (click -> plot)
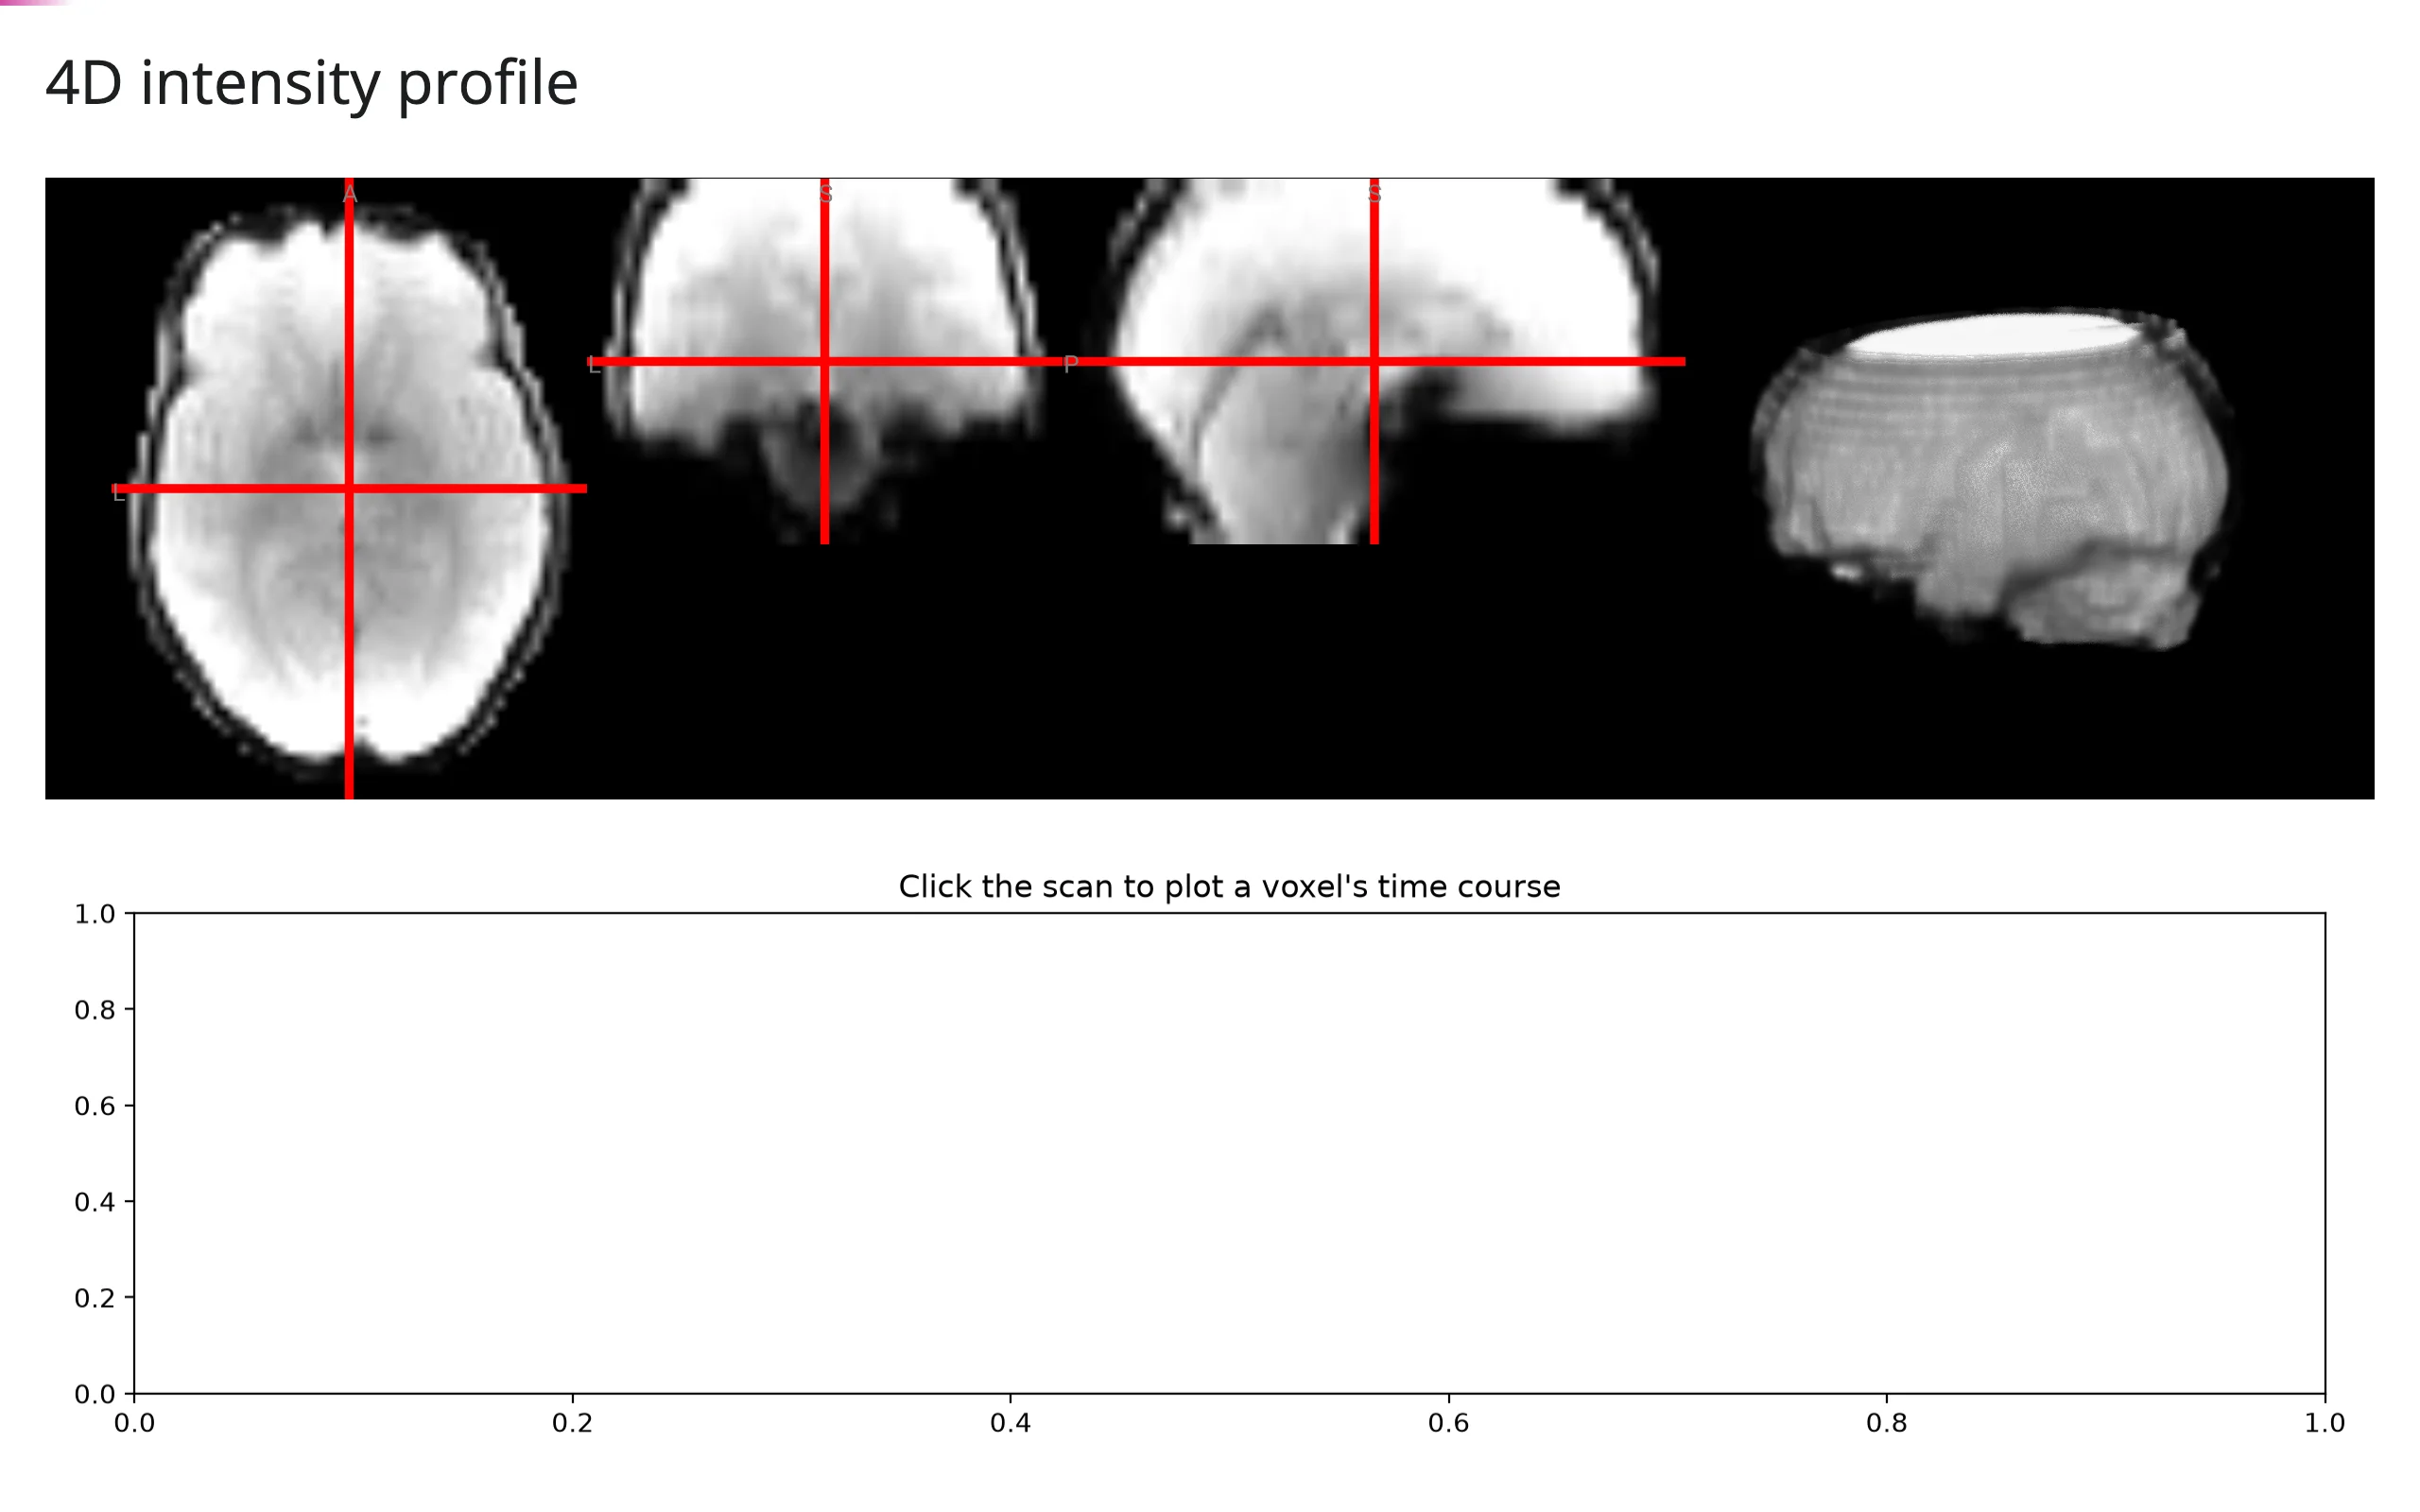
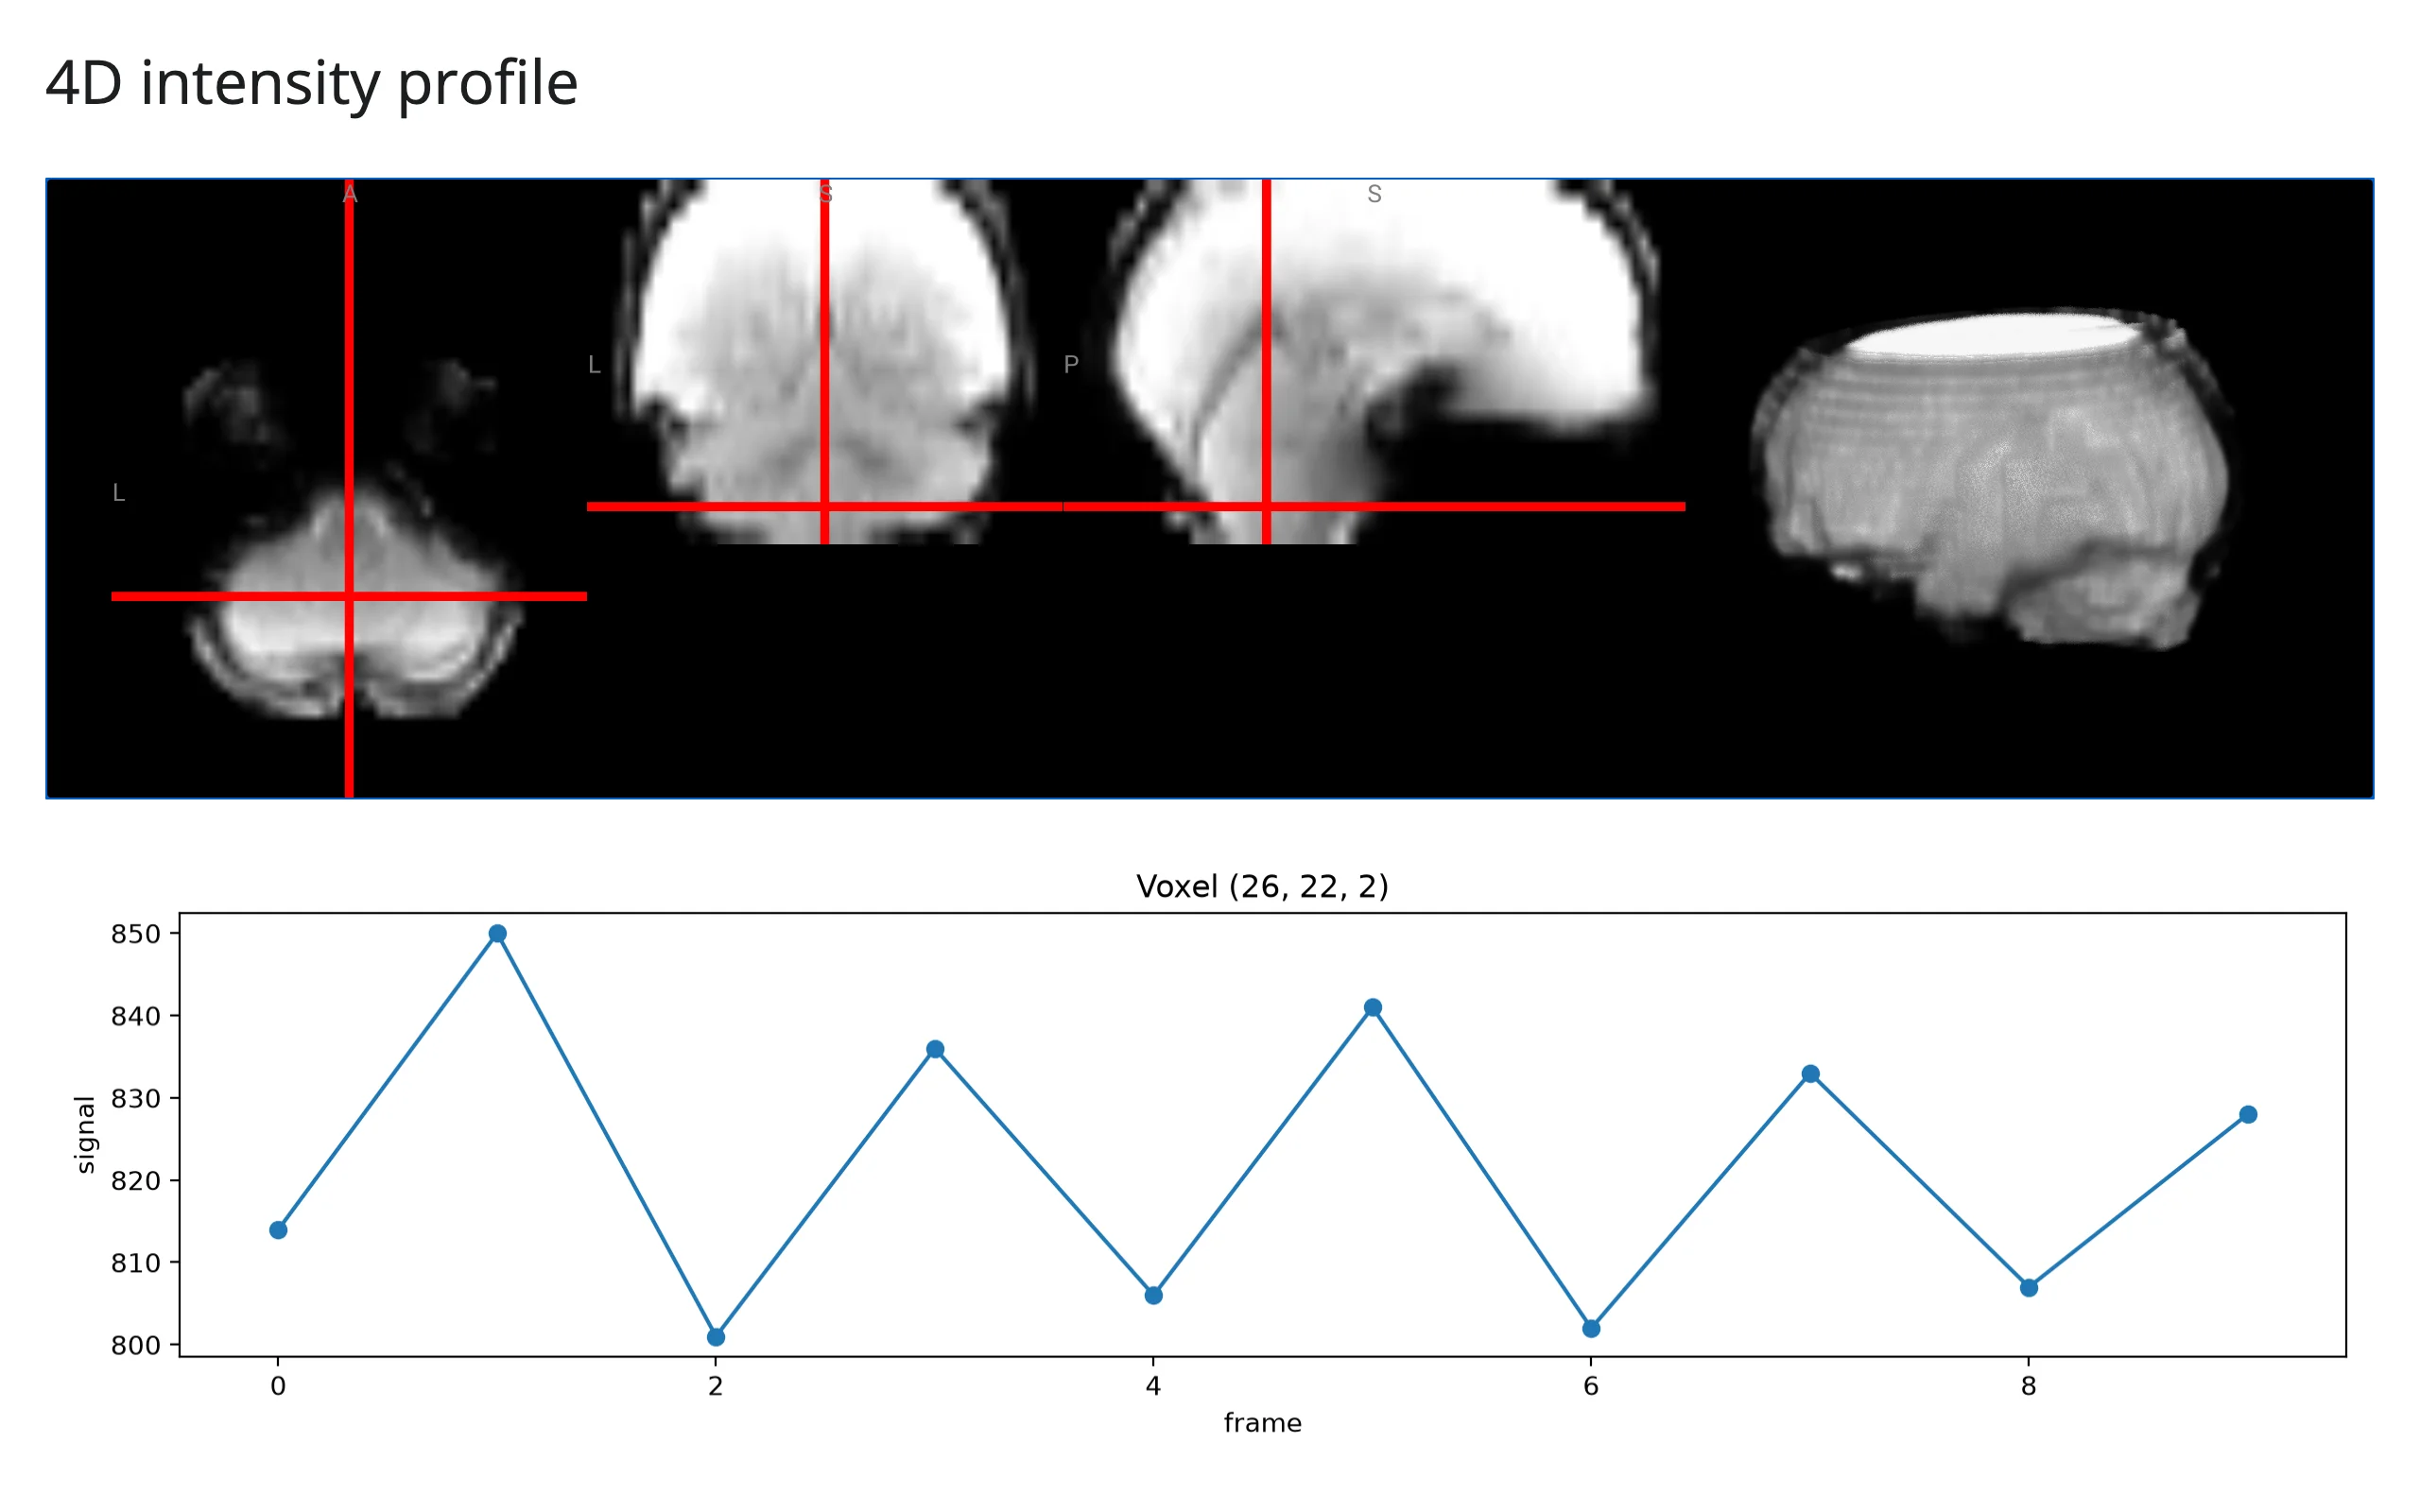
location() reports the voxel under the crosshair, but only its intensity in whatever frame is currently displayed. For the full time course, index into the same 4D array locally with nibabel, using location()["vox"] to pick the voxel – both the viewer and the local array come from the same file, so the indices line up.
from pathlib import Path

import matplotlib.pyplot as plt
import nibabel as nib
from ipyniivue import NiiVue, Volume, download_dataset
from shiny.express import render, ui
from shinywidgets import render_niivue

ui.page_opts(title="4D intensity profile", fillable=True)

CACHE = Path.home() / ".cache" / "niivue-guide"
if not (CACHE / "pcasl.nii.gz").exists():
    download_dataset(dest_folder=CACHE, files=["pcasl.nii.gz"])
TIMESERIES = nib.load(CACHE / "pcasl.nii.gz").get_fdata()  # shape: (x, y, z, time)


@render_niivue
def brain():
    nv = NiiVue()
    nv.load_volumes([Volume(path=CACHE / "pcasl.nii.gz")])
    return nv


@render.plot
def profile():
    loc = brain.location()
    fig, ax = plt.subplots()
    if loc.get("seeded"):
        ax.set_title("Click the scan to plot a voxel's time course")
        return fig
    i, j, k = loc["vox"]
    ax.plot(TIMESERIES[i, j, k, :], marker="o")
    ax.set(xlabel="frame", ylabel="signal", title=f"Voxel {(i, j, k)}")
    return fig
examples/10_timeseries_4d.py (needs nibabel; downloads the ~0.6 MB demo scan on first run)
| Before | After clicking |
|---|---|
 |
 |
Beyond the accessor: reactive_read
There’s nothing to reach for here. The crosshair position lives on nv.widget.scene.crosshair_pos, and it looks like an ordinary synced trait – but it’s write-only from Python. Verified directly: clicking and dragging the crosshair in the browser never changes it server-side (reactive_read(nv.widget.scene, "crosshair_pos") reads [0.5, 0.5, 0.5] before, during, and after a real drag). location()/on_location_change are the only paths from browser interaction to Python for this widget.
Rate limiting
location() debounces at 250 ms by default, because a crosshair drag fires roughly 20-25 events per second – without debouncing, every pixel of mouse movement would trigger a re-render of anything downstream. Pass rate_delay=0 to the decorator to see every event immediately (reasonable if your app only cares about discrete clicks, not continuous dragging), or rate_policy="throttle" for a steady trickle of updates during a drag instead of one value at the end.
from ipyniivue import NiiVue, Volume
from shiny.express import render, ui
from shinywidgets import render_niivue

ui.page_opts(title="No debounce", fillable=True)


@render_niivue(rate_delay=0)
def brain():
    nv = NiiVue()
    nv.load_volumes([Volume(url="https://niivue.com/demos/images/mni152.nii.gz")])
    return nv


@render.code
def readout():
    loc = brain.location()
    return "Click the brain to inspect a voxel" if loc.get("seeded") else loc["string"]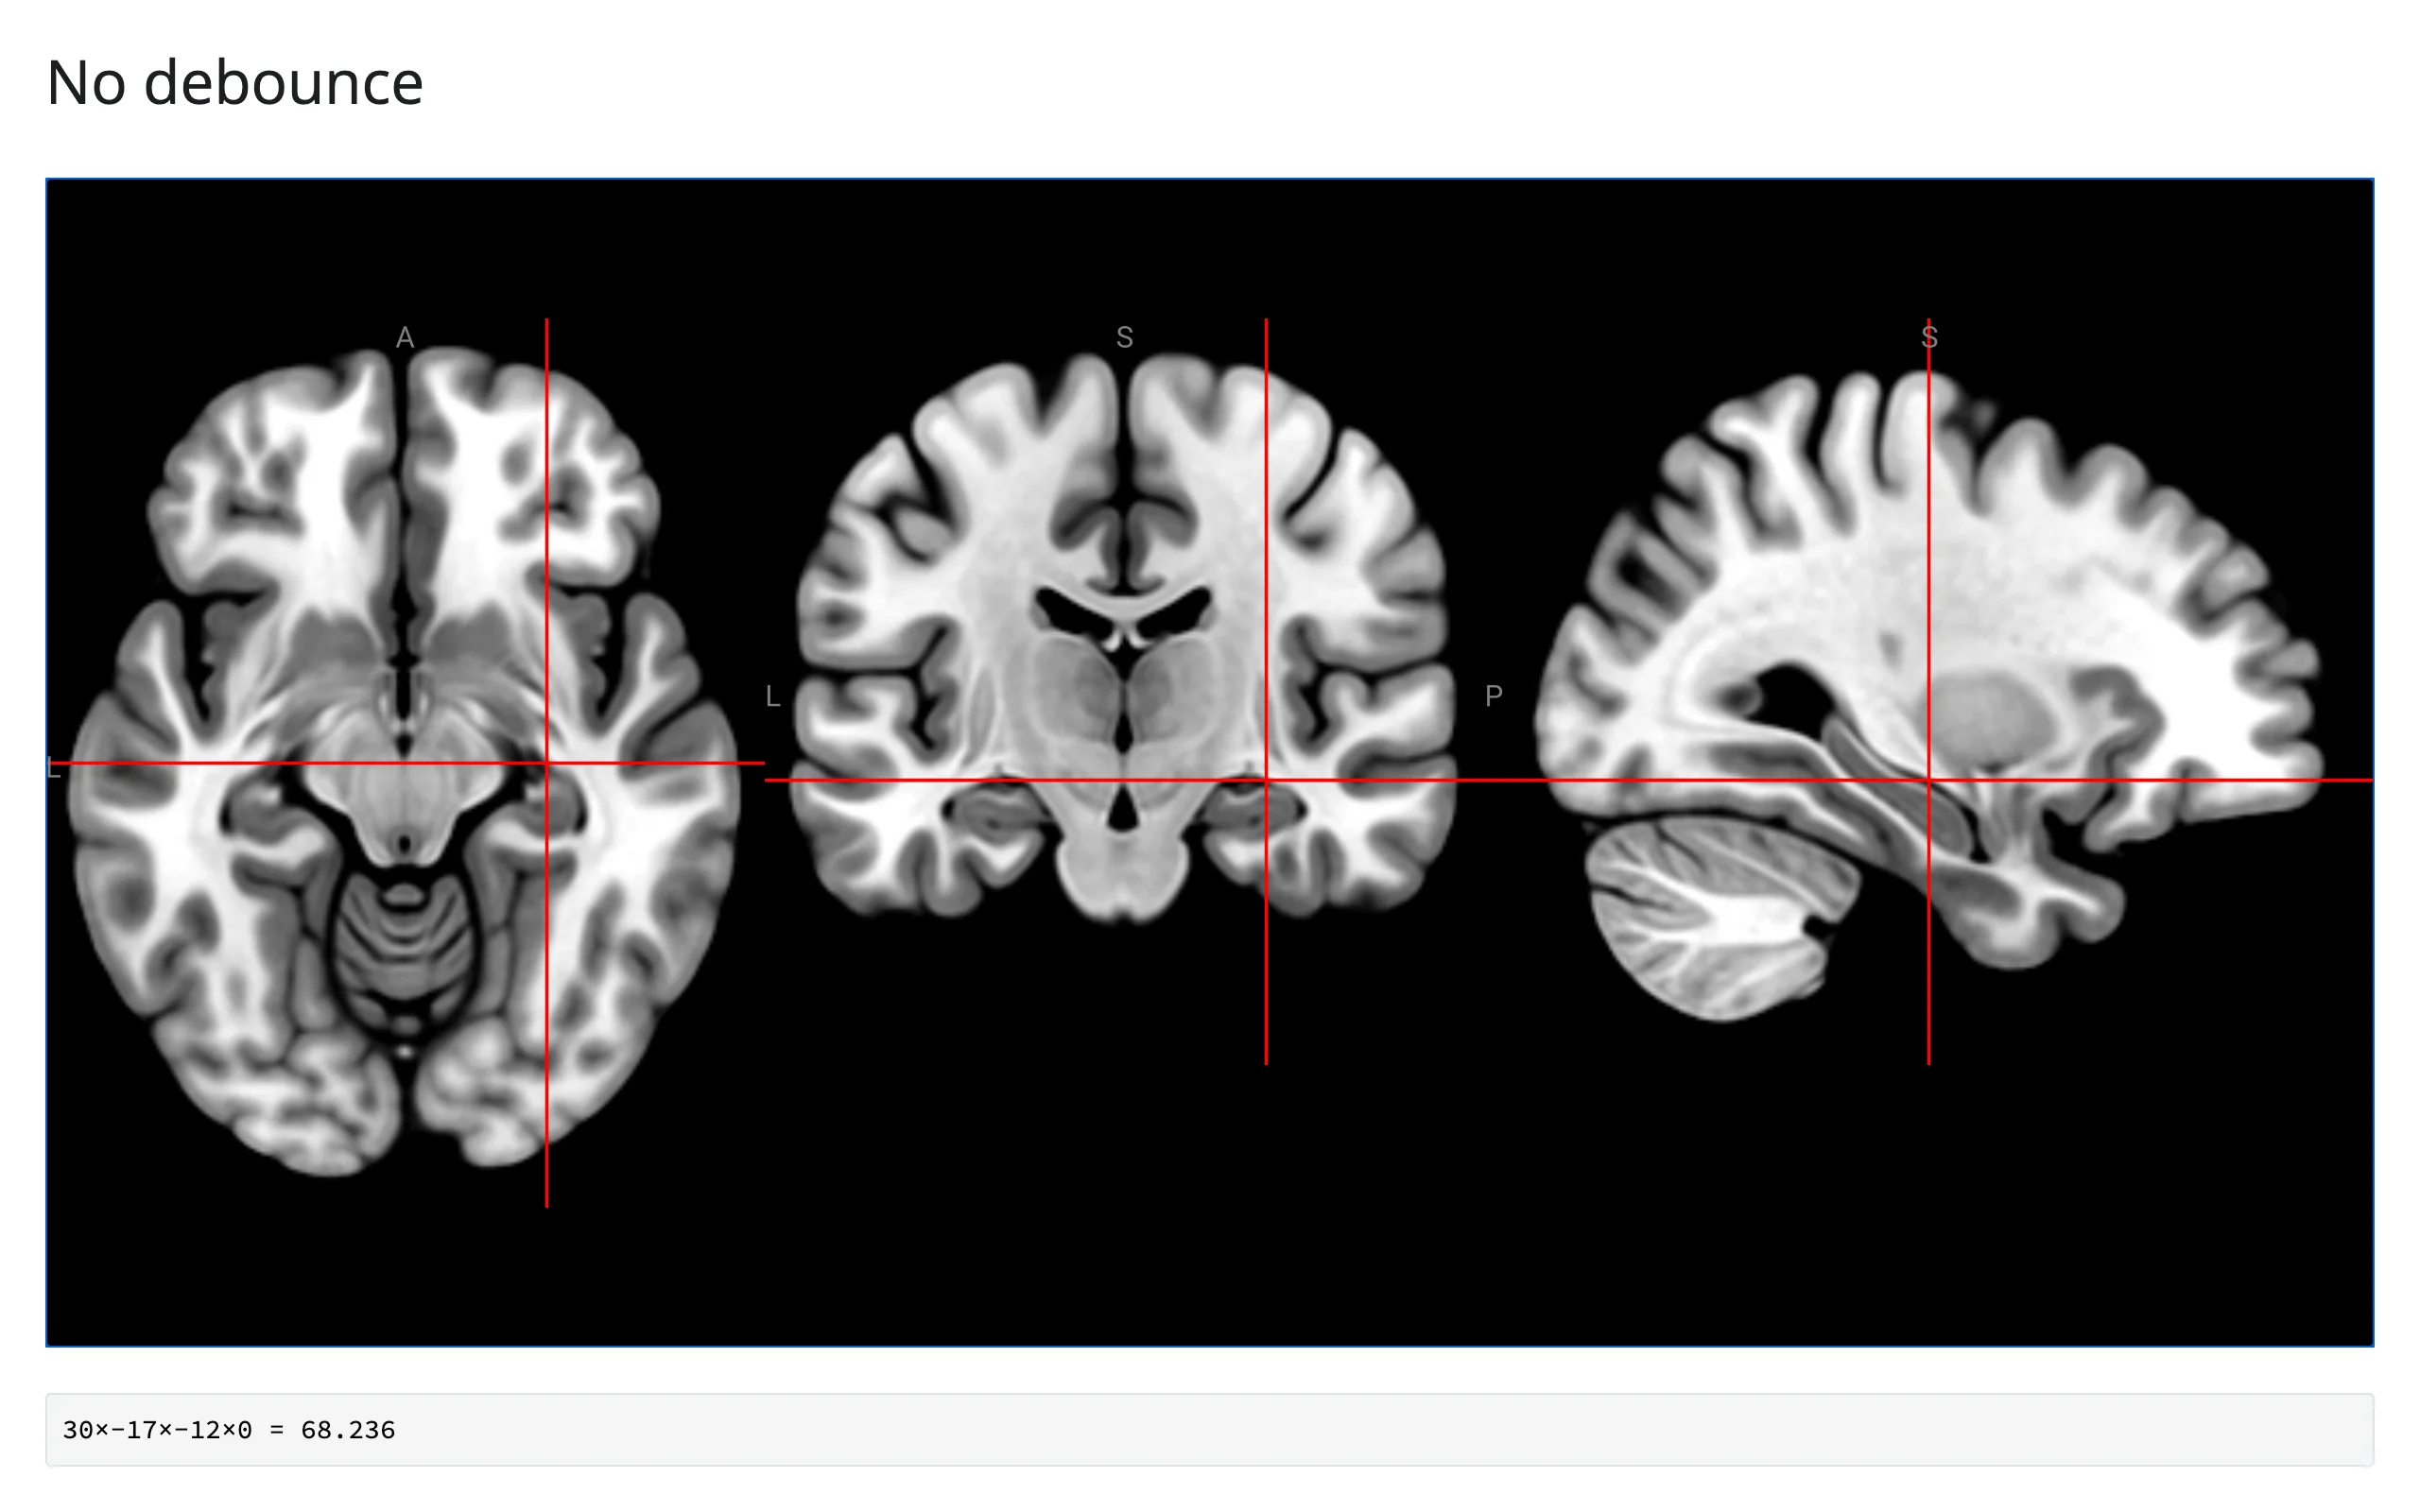
Updating the widget from Python
Every set_* method on .widget (set_colormap, set_opacity, set_gamma, set_slice_type, and so on) and every writable trait (volumes[i].cal_min, volumes[i].frame_4d, scene.crosshair_pos) applies live, in the browser, without re-rendering the output. This matters more for NiiVue than most widgets: a re-render resends the viewer’s ~5 MB JavaScript bundle plus every volume (base64-encoded) over the websocket, and the browser re-uploads the decoded voxels back to Python afterward – expensive on every re-render, free for an in-place update. The “Statistical overlay” and “Every slice type” examples above are both this pattern: a @reactive.effect reading an input and calling a set_* method or assigning a trait on brain.widget.
One wrinkle this widget doesn’t have: most in-place-update patterns need reactive.isolate() to avoid a loop when the effect also depends on the widget’s own reported state. NiiVue never needs it, because programmatic writes (like setting scene.crosshair_pos) don’t echo back through location() – only genuine browser clicks and drags do (verified above). An effect that sets the crosshair from an input can’t re-trigger itself.
Jumping the crosshair from Python
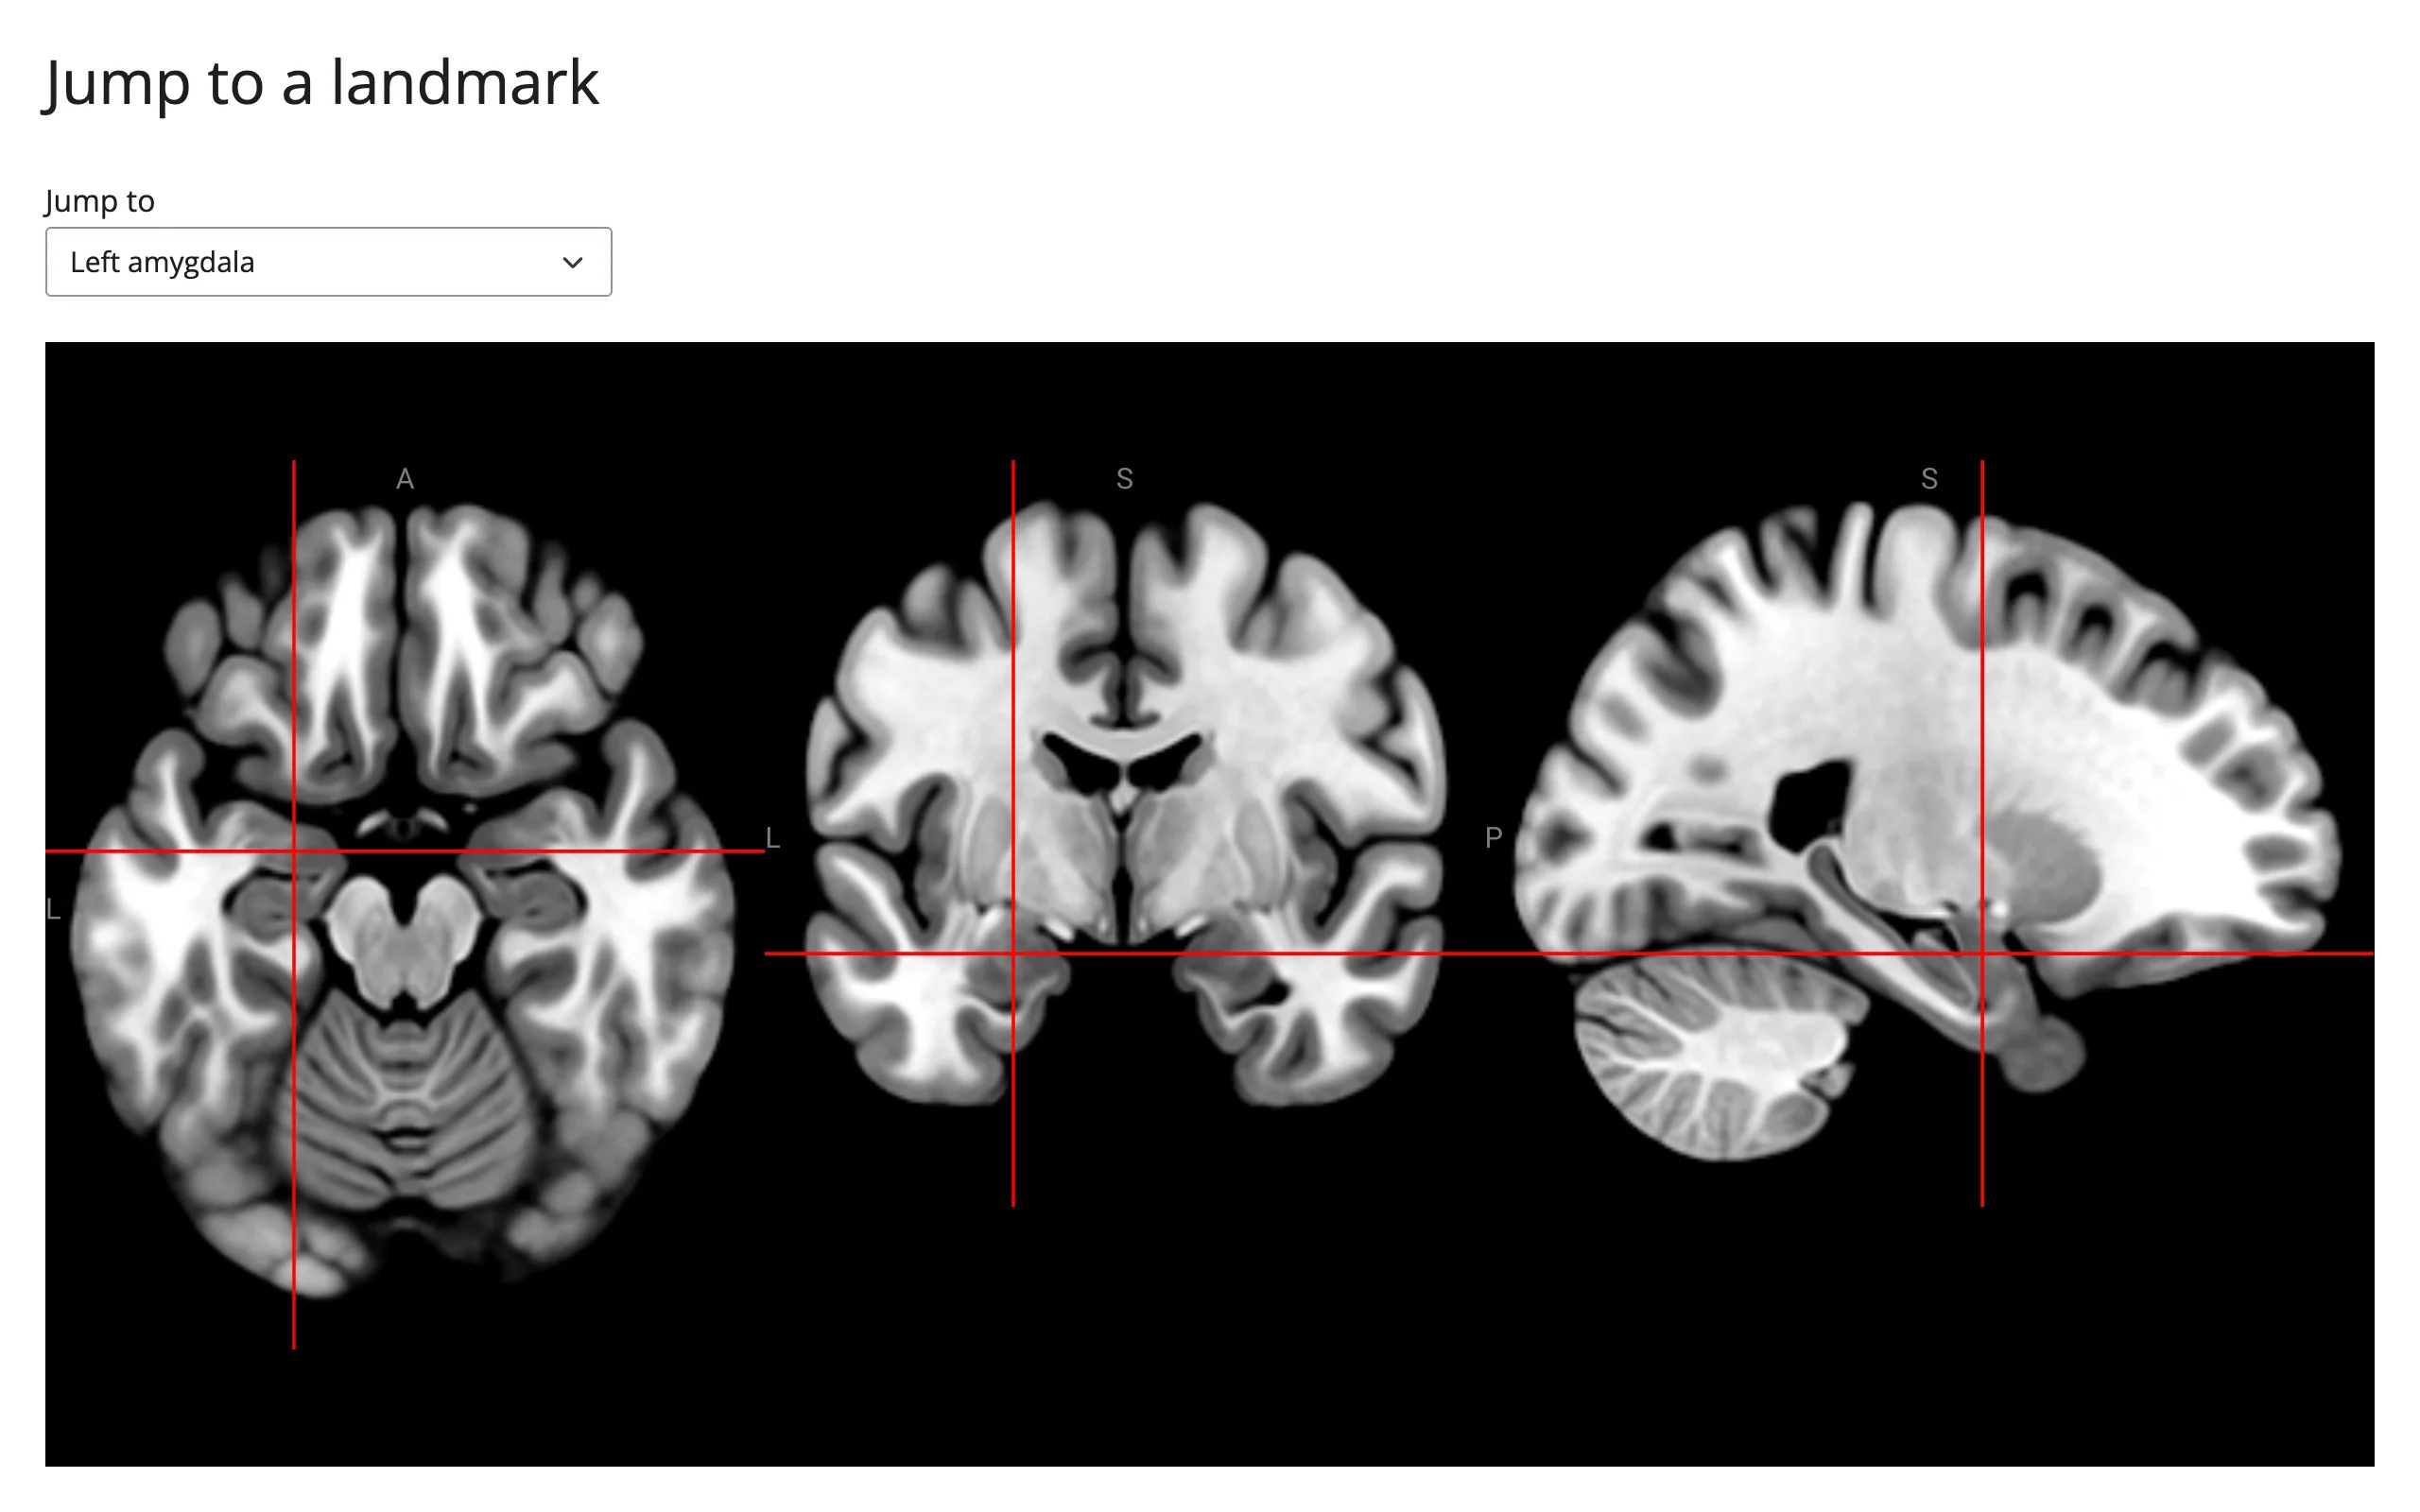
nv.frac2mm()/nv.mm2frac() don’t work server-side (verified: calling frac2mm after loading a volume raises RuntimeError: Volume coordinate transformation matrices are not available – those matrices exist only in the browser). To jump to a known millimeter coordinate, load the same file with nibabel locally and use its affine to compute a voxel index, then divide by the volume’s shape to get the [0, 1] fraction scene.crosshair_pos expects.
from pathlib import Path

import nibabel as nib
import numpy as np
from ipyniivue import NiiVue, Volume, download_dataset
from shiny import reactive
from shiny.express import input, ui
from shinywidgets import render_niivue

ui.page_opts(title="Jump to a landmark", fillable=True)

LANDMARKS_MM = {
    "Left amygdala": (-23, -5, -18),
    "Right amygdala": (23, -5, -18),
    "Anterior cingulate": (0, 30, 20),
    "Left motor cortex (hand knob)": (-38, -22, 52),
}
ui.input_select("landmark", "Jump to", list(LANDMARKS_MM))

CACHE = Path.home() / ".cache" / "niivue-guide"
if not (CACHE / "mni152.nii.gz").exists():
    download_dataset(dest_folder=CACHE, files=["mni152.nii.gz"])
MNI = nib.load(CACHE / "mni152.nii.gz")
TO_VOX = np.linalg.inv(MNI.affine)


@render_niivue
def brain():
    nv = NiiVue()
    nv.load_volumes([Volume(path=CACHE / "mni152.nii.gz")])
    return nv


@reactive.effect
def _():
    mm = LANDMARKS_MM[input.landmark()]
    vox = (TO_VOX @ np.array([*mm, 1.0]))[:3]
    brain.widget.scene.crosshair_pos = list(vox / np.array(MNI.shape))
examples/11_jump_crosshair.py (needs nibabel)
| Left amygdala | Left motor cortex (hand knob) |
|---|---|
 |
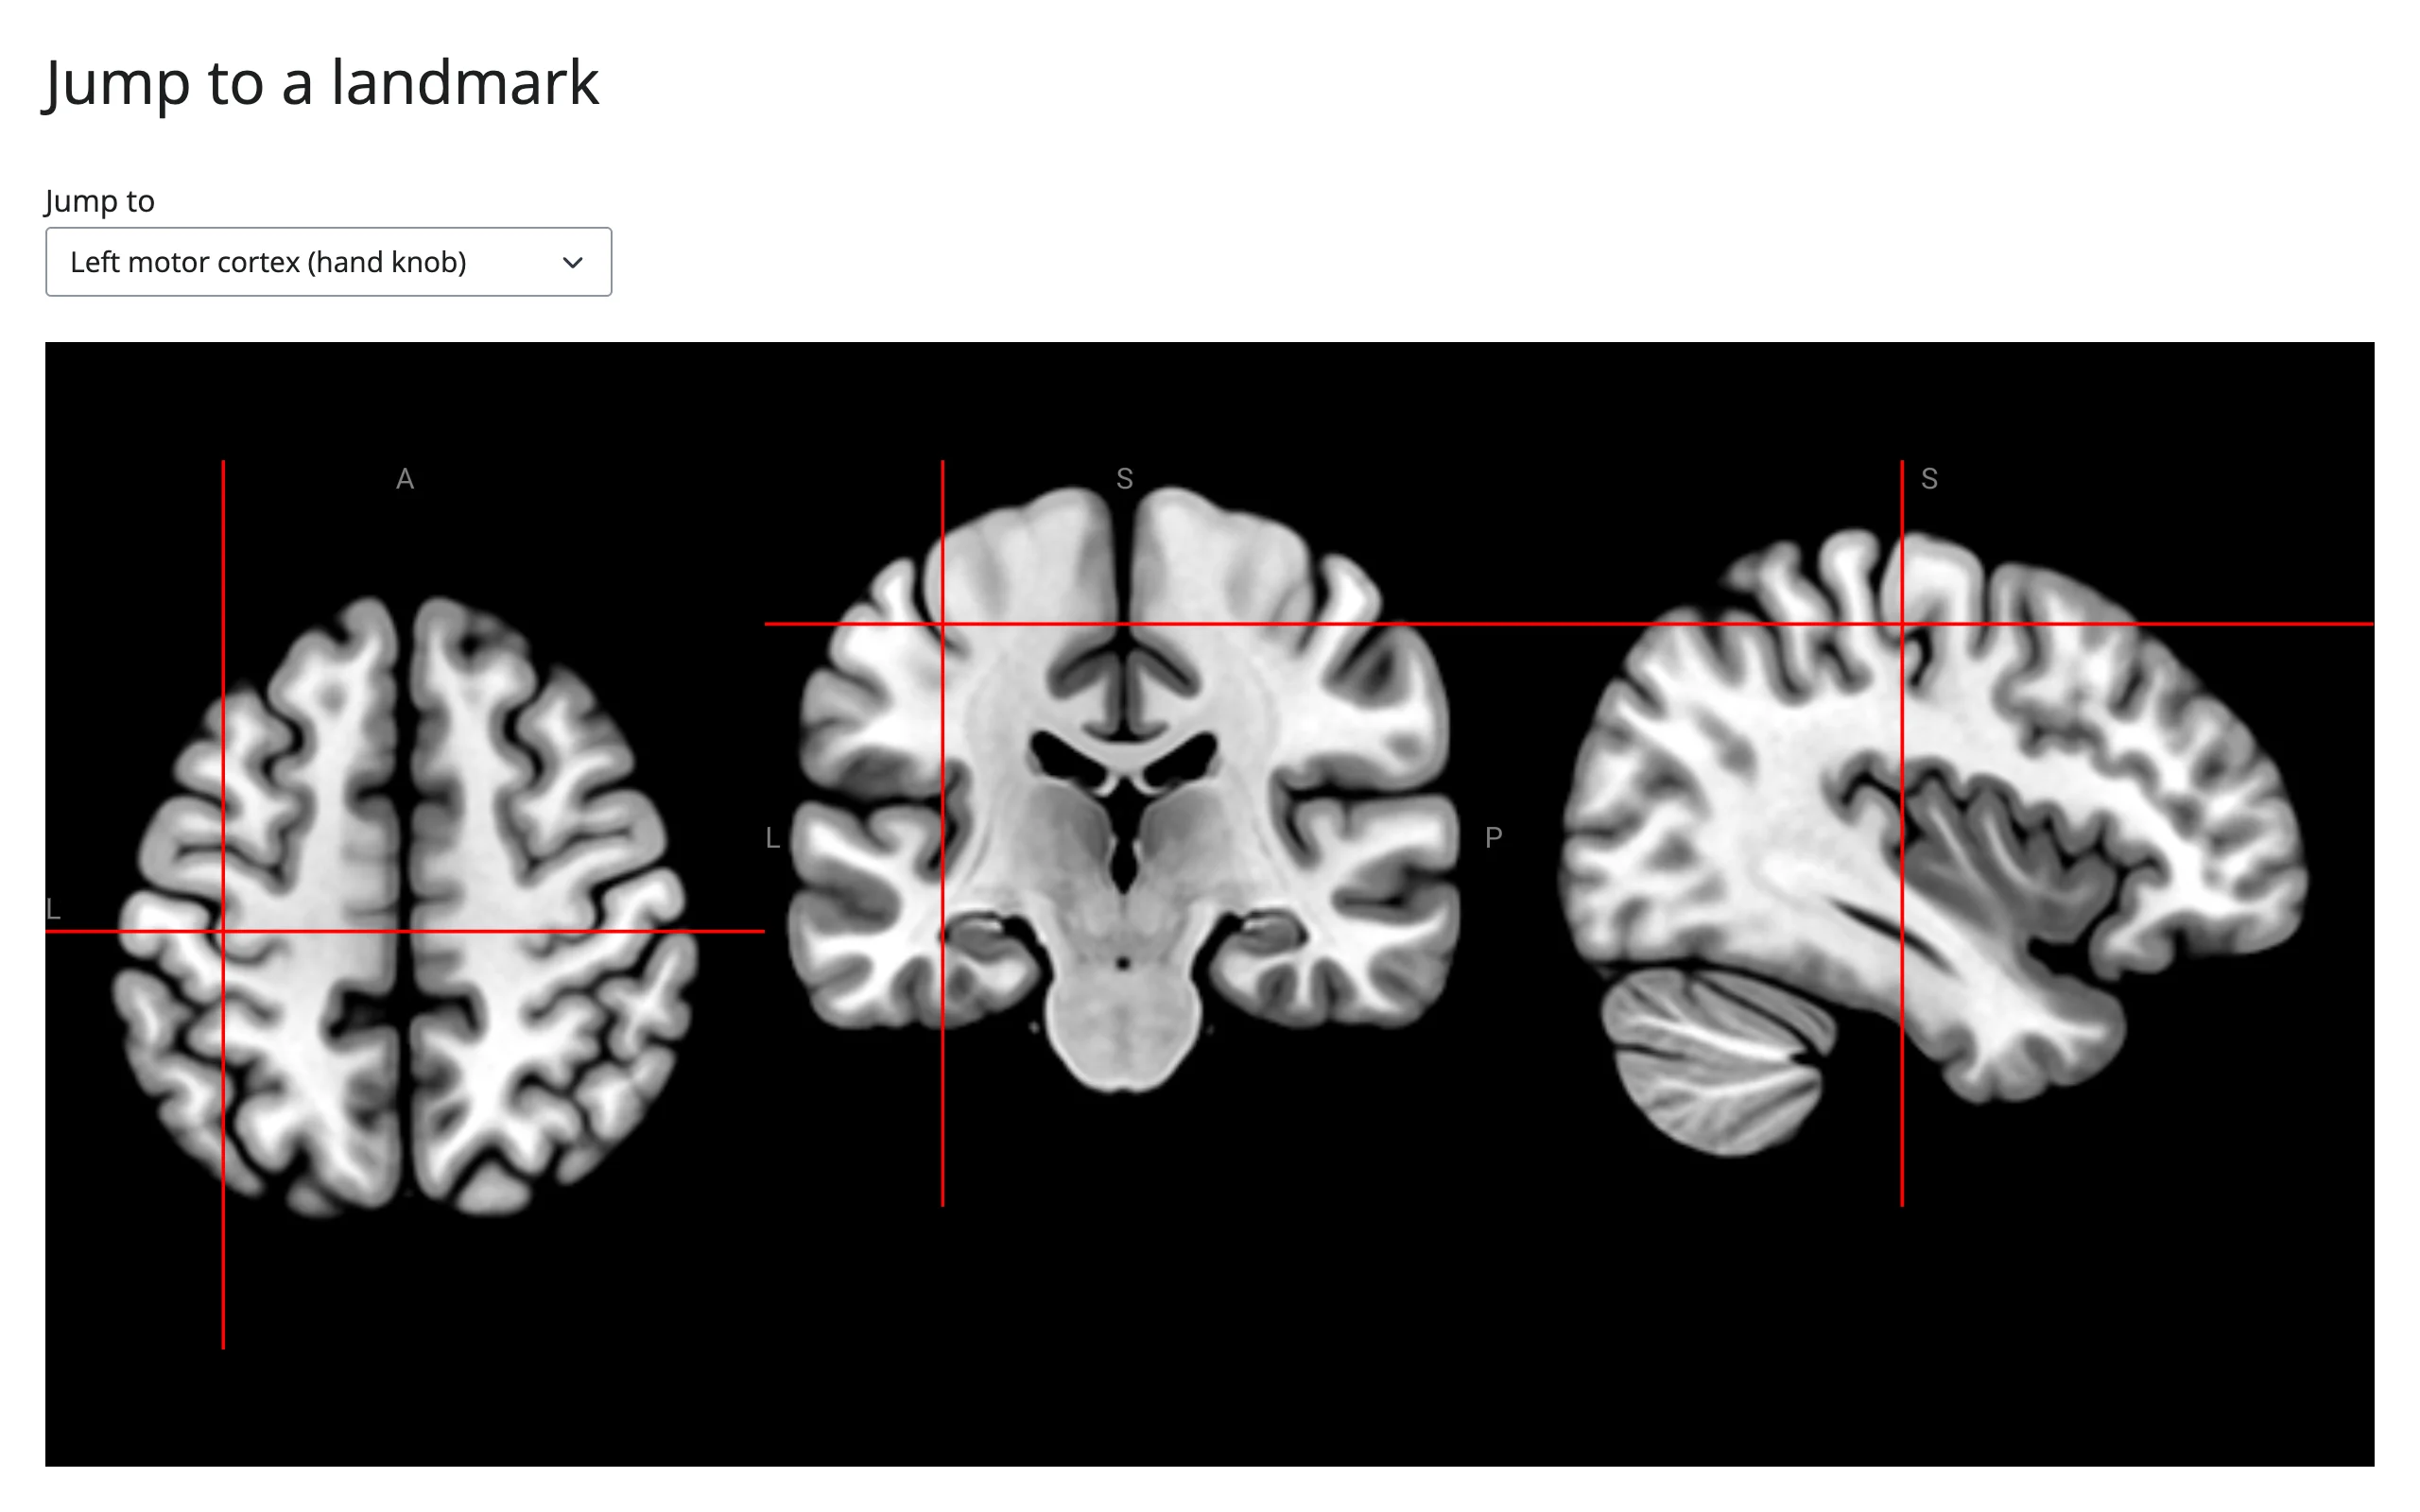 |
Setting scene.crosshair_pos moves the crosshair in the browser immediately; it does not trigger location() or on_location_change (those only fire for events the browser itself originates), so a jump like this won’t show up in a location()-driven readout until the user clicks again.
Coordinating multiple views
Three complete, verified patterns – combine them as needed.
1. Click -> atlas label + MNI coordinate card. Load a label atlas as a second volume; read its intensity directly out of location()["values"][1], no coordinate math required. See “Voxel value to atlas label” above.
2. Click -> linked time-series plot. For data richer than a single intensity (a 4D scan, or any per-voxel array you have in Python), use location()["vox"] to index into your own copy of the data and plot it with matplotlib, plotly, or any other renderer. See “Crosshair to a 4D time series” above.
3. Dropdown -> jump the crosshair (Python drives the widget). A @reactive.effect reading a ui.input_select and writing scene.crosshair_pos turns any list of named coordinates – anatomical landmarks, a table of previous findings, output from an analysis pipeline – into a one-click navigation aid. See “Jumping the crosshair from Python” above.
All three compose: the showcase gallery app below combines the atlas-label card with the landmark dropdown in one page.
Pairs with: a table of coordinates (render.data_frame) could drive pattern 3 directly from row selection instead of a dropdown – see the itables or reactable guides for the selected_rows()-style accessor on the table side.
Large data
NiiVue draws volumes with WebGL2 (the “draw it with the GPU in the browser” approach – see Large data & performance’s three approaches), but every re-render sends the ~5 MB JavaScript bundle plus every loaded volume base64-encoded, and the browser uploads the decoded voxels back to Python afterward – see “Re-renders are expensive for large volumes” in Gotchas, where this is measured. Two things keep that cheap: Volume(url=...) for remote data skips the base64 down-leg entirely (the closest thing here to “only send what’s visible”), and in-place .widget updates – like the 4D volumes and crosshair examples above – send only the changed trait instead of re-exporting the whole scene.
Layout and sizing
- Leave
height=off ofNiiVue()itself. It sets the canvas’s pixel height, which then disagrees with the output’s height (set via fill layout oroutput_widget(height=...)), causing clipping or dead space. Don’t pass it in Shiny. - With no explicit height, the canvas fills its container exactly, including through
full_screentoggles and hidden-tab-then-shown sequences. - An explicit
output_widget(height="400px")is respected normally; just don’t also setNiiVue(height=...). - NiiVue’s
MultiplanarType.AUTO(the default) picks the pane arrangement based on the container’s aspect ratio – a wide, short container gets three panes side by side; a more square one can fit a fourth (3D render) pane too. This is automatic and not something you need to configure for ordinary layouts.
Gotchas and limitations
Verified against current main:
- The crosshair position is not a two-way trait.
scene.crosshair_possyncs Python-to-browser only;reactive_read()on it never reflects a browser-originated click or drag. Uselocation()(or@nv.on_location_changeplus a session-scopedreactive.Value, if you need every event un-debounced and don’t want to use therate_delay=0kwarg). frac2mm()/mm2frac()don’t work in Shiny. The coordinate transformation matrices are built in the browser and never sync back; calling them from Python raisesRuntimeErroronce a volume is loaded (and silently returns a meaningless identity-based answer before any volume loads – don’t rely on either). Load the same file withnibabeland use its affine instead.- Exceptions inside
@nv.on_location_changecallbacks are swallowed silently by ipywidgets’ callback dispatcher – a bug in your callback just looks like “nothing updates.” This only matters if you bypasslocation()and register your own callback directly. - Re-renders are expensive for large volumes. Every render sends the ~5 MB JavaScript bundle plus every volume (base64-encoded); the browser also uploads the decoded voxels back to Python afterward. Prefer
Volume(url=...)for remote data (skips the base64 down-leg) and prefer in-place.widgetupdates over re-rendering whenever the data itself hasn’t changed. Volume(data=...)requiresname=. There’s no file path to infer a name from; omitting it raisesValueError: Must provide 'name' when 'data' is provided.- Headless browser testing needs software WebGL. Plain headless Chromium renders a blank canvas for this widget; launch with
--use-angle=swiftshader --enable-unsafe-swiftshader --ignore-gpu-blocklistif you’re writing your own Playwright tests against a NiiVue-based app.
Gallery candidates
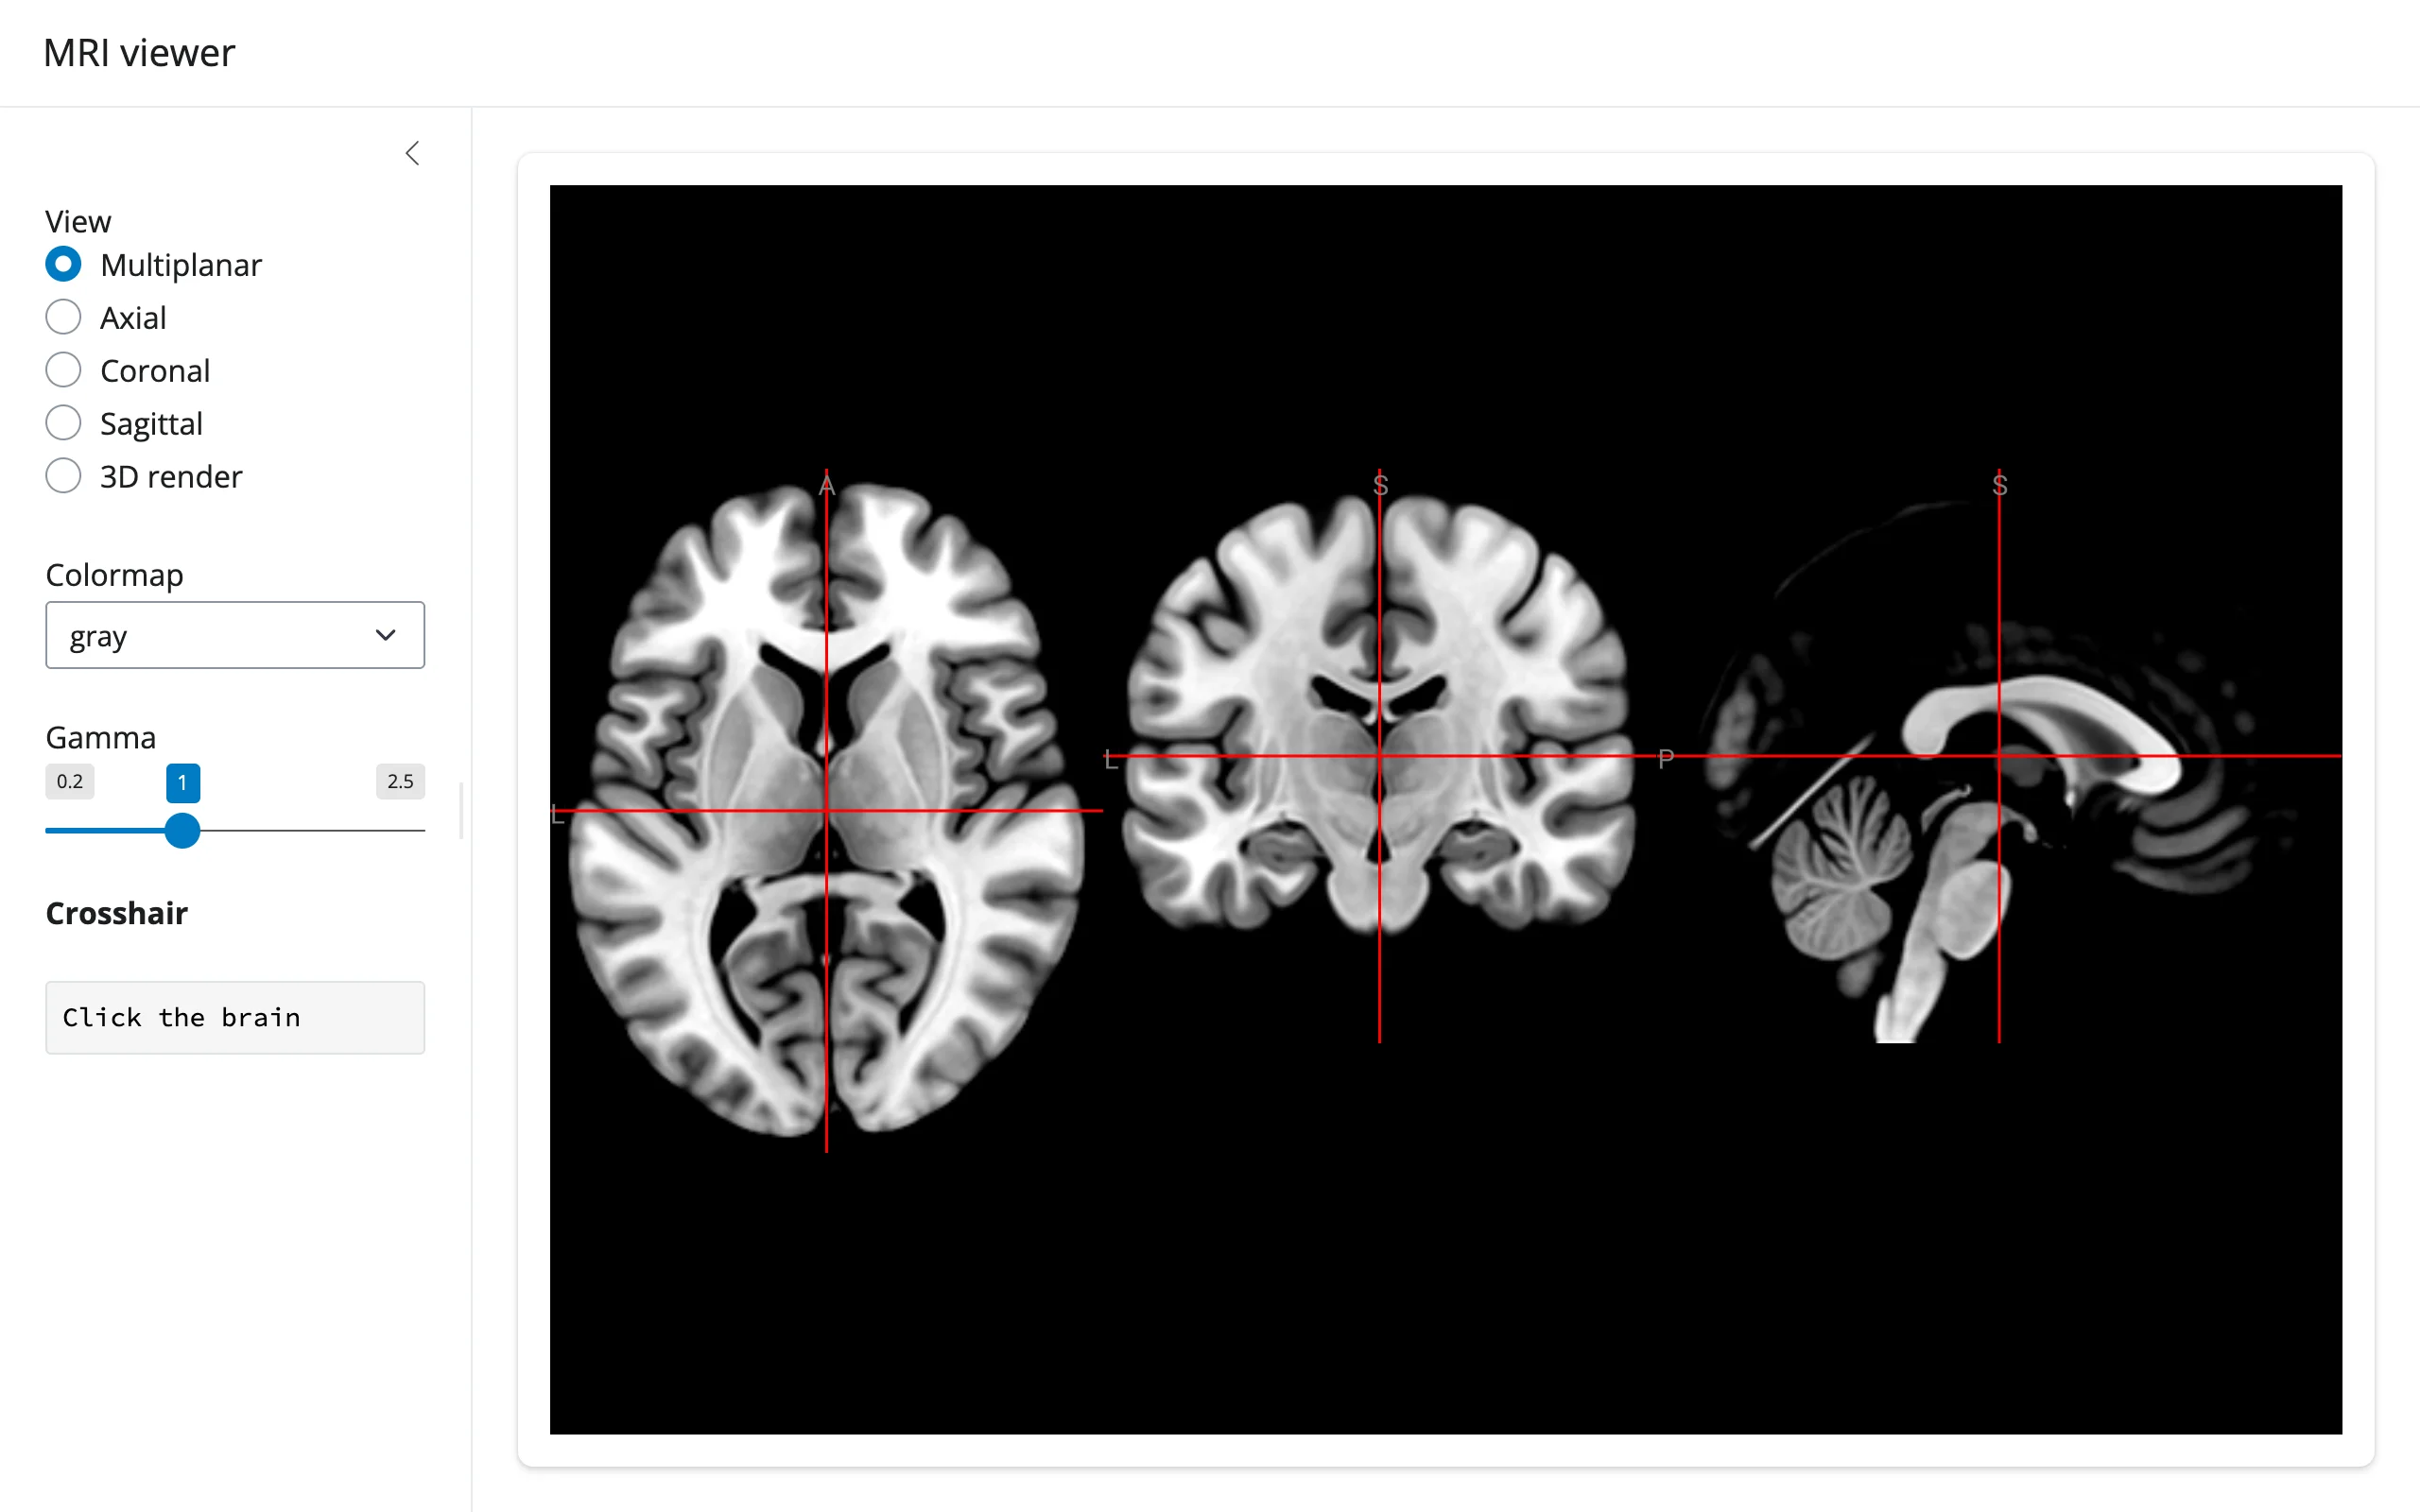
gallery/template_mri_viewer.py (template) – a clean ~55-line starting point: slice-type, colormap, and gamma controls plus a location()-driven crosshair readout.
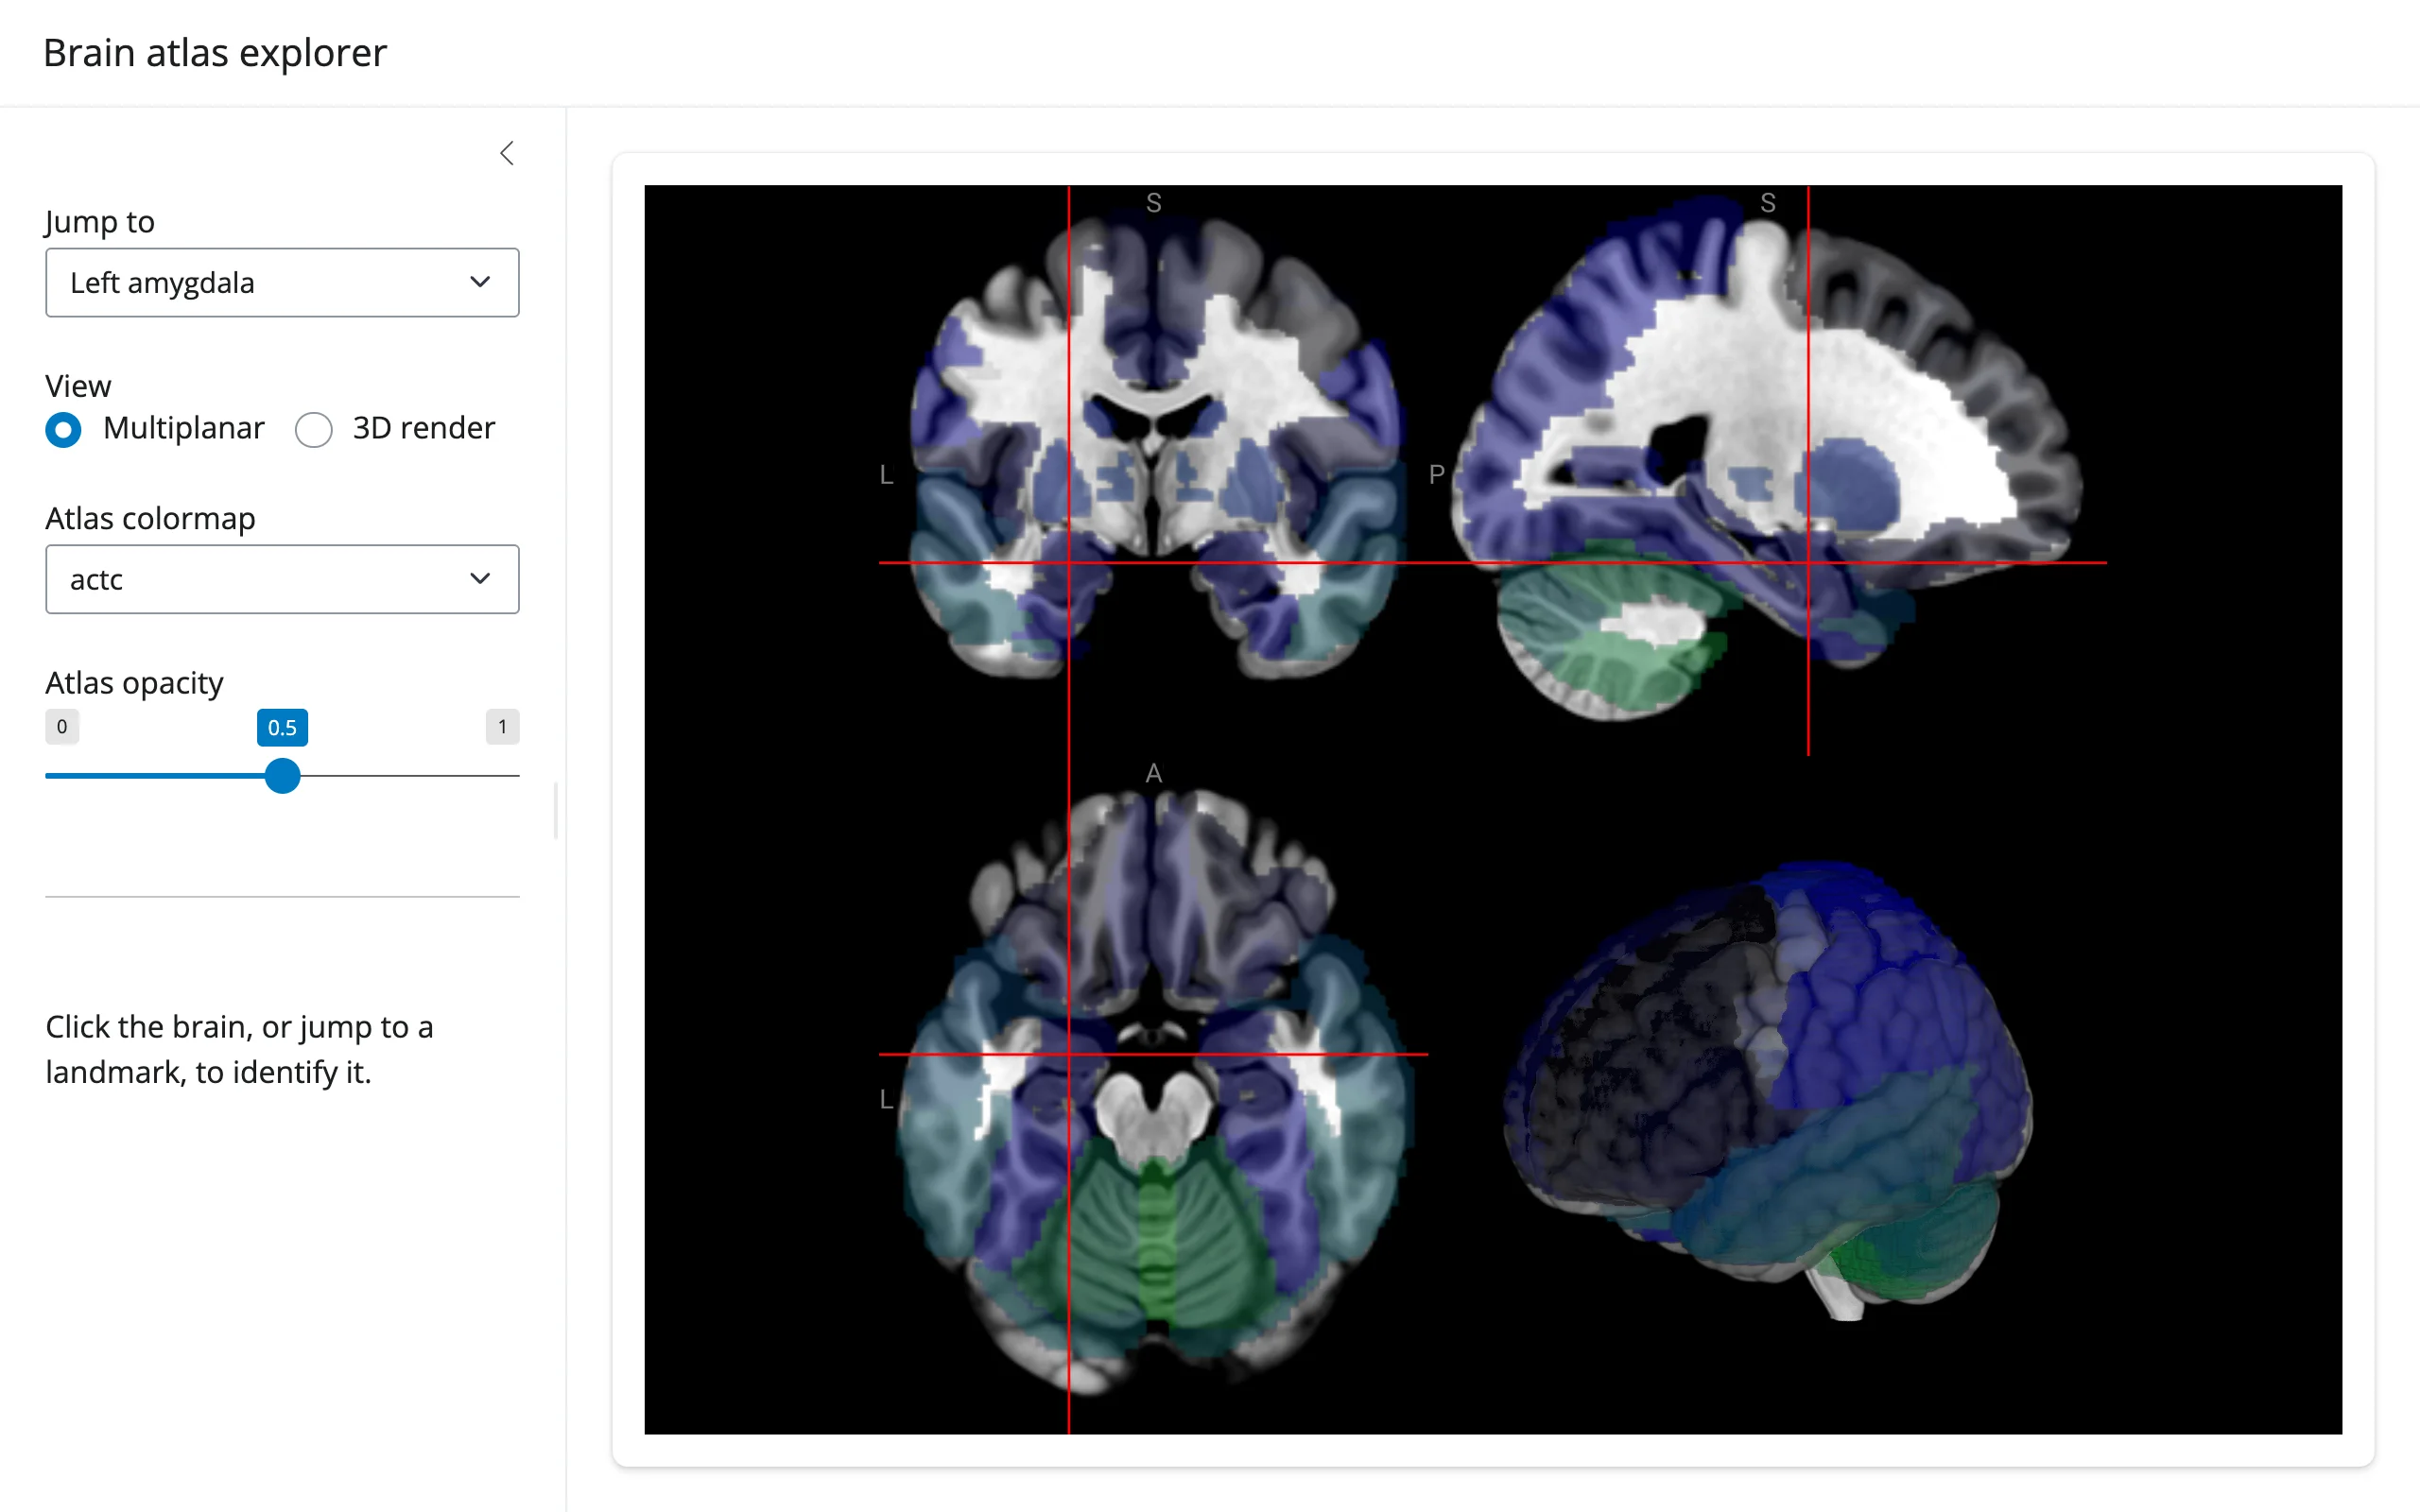
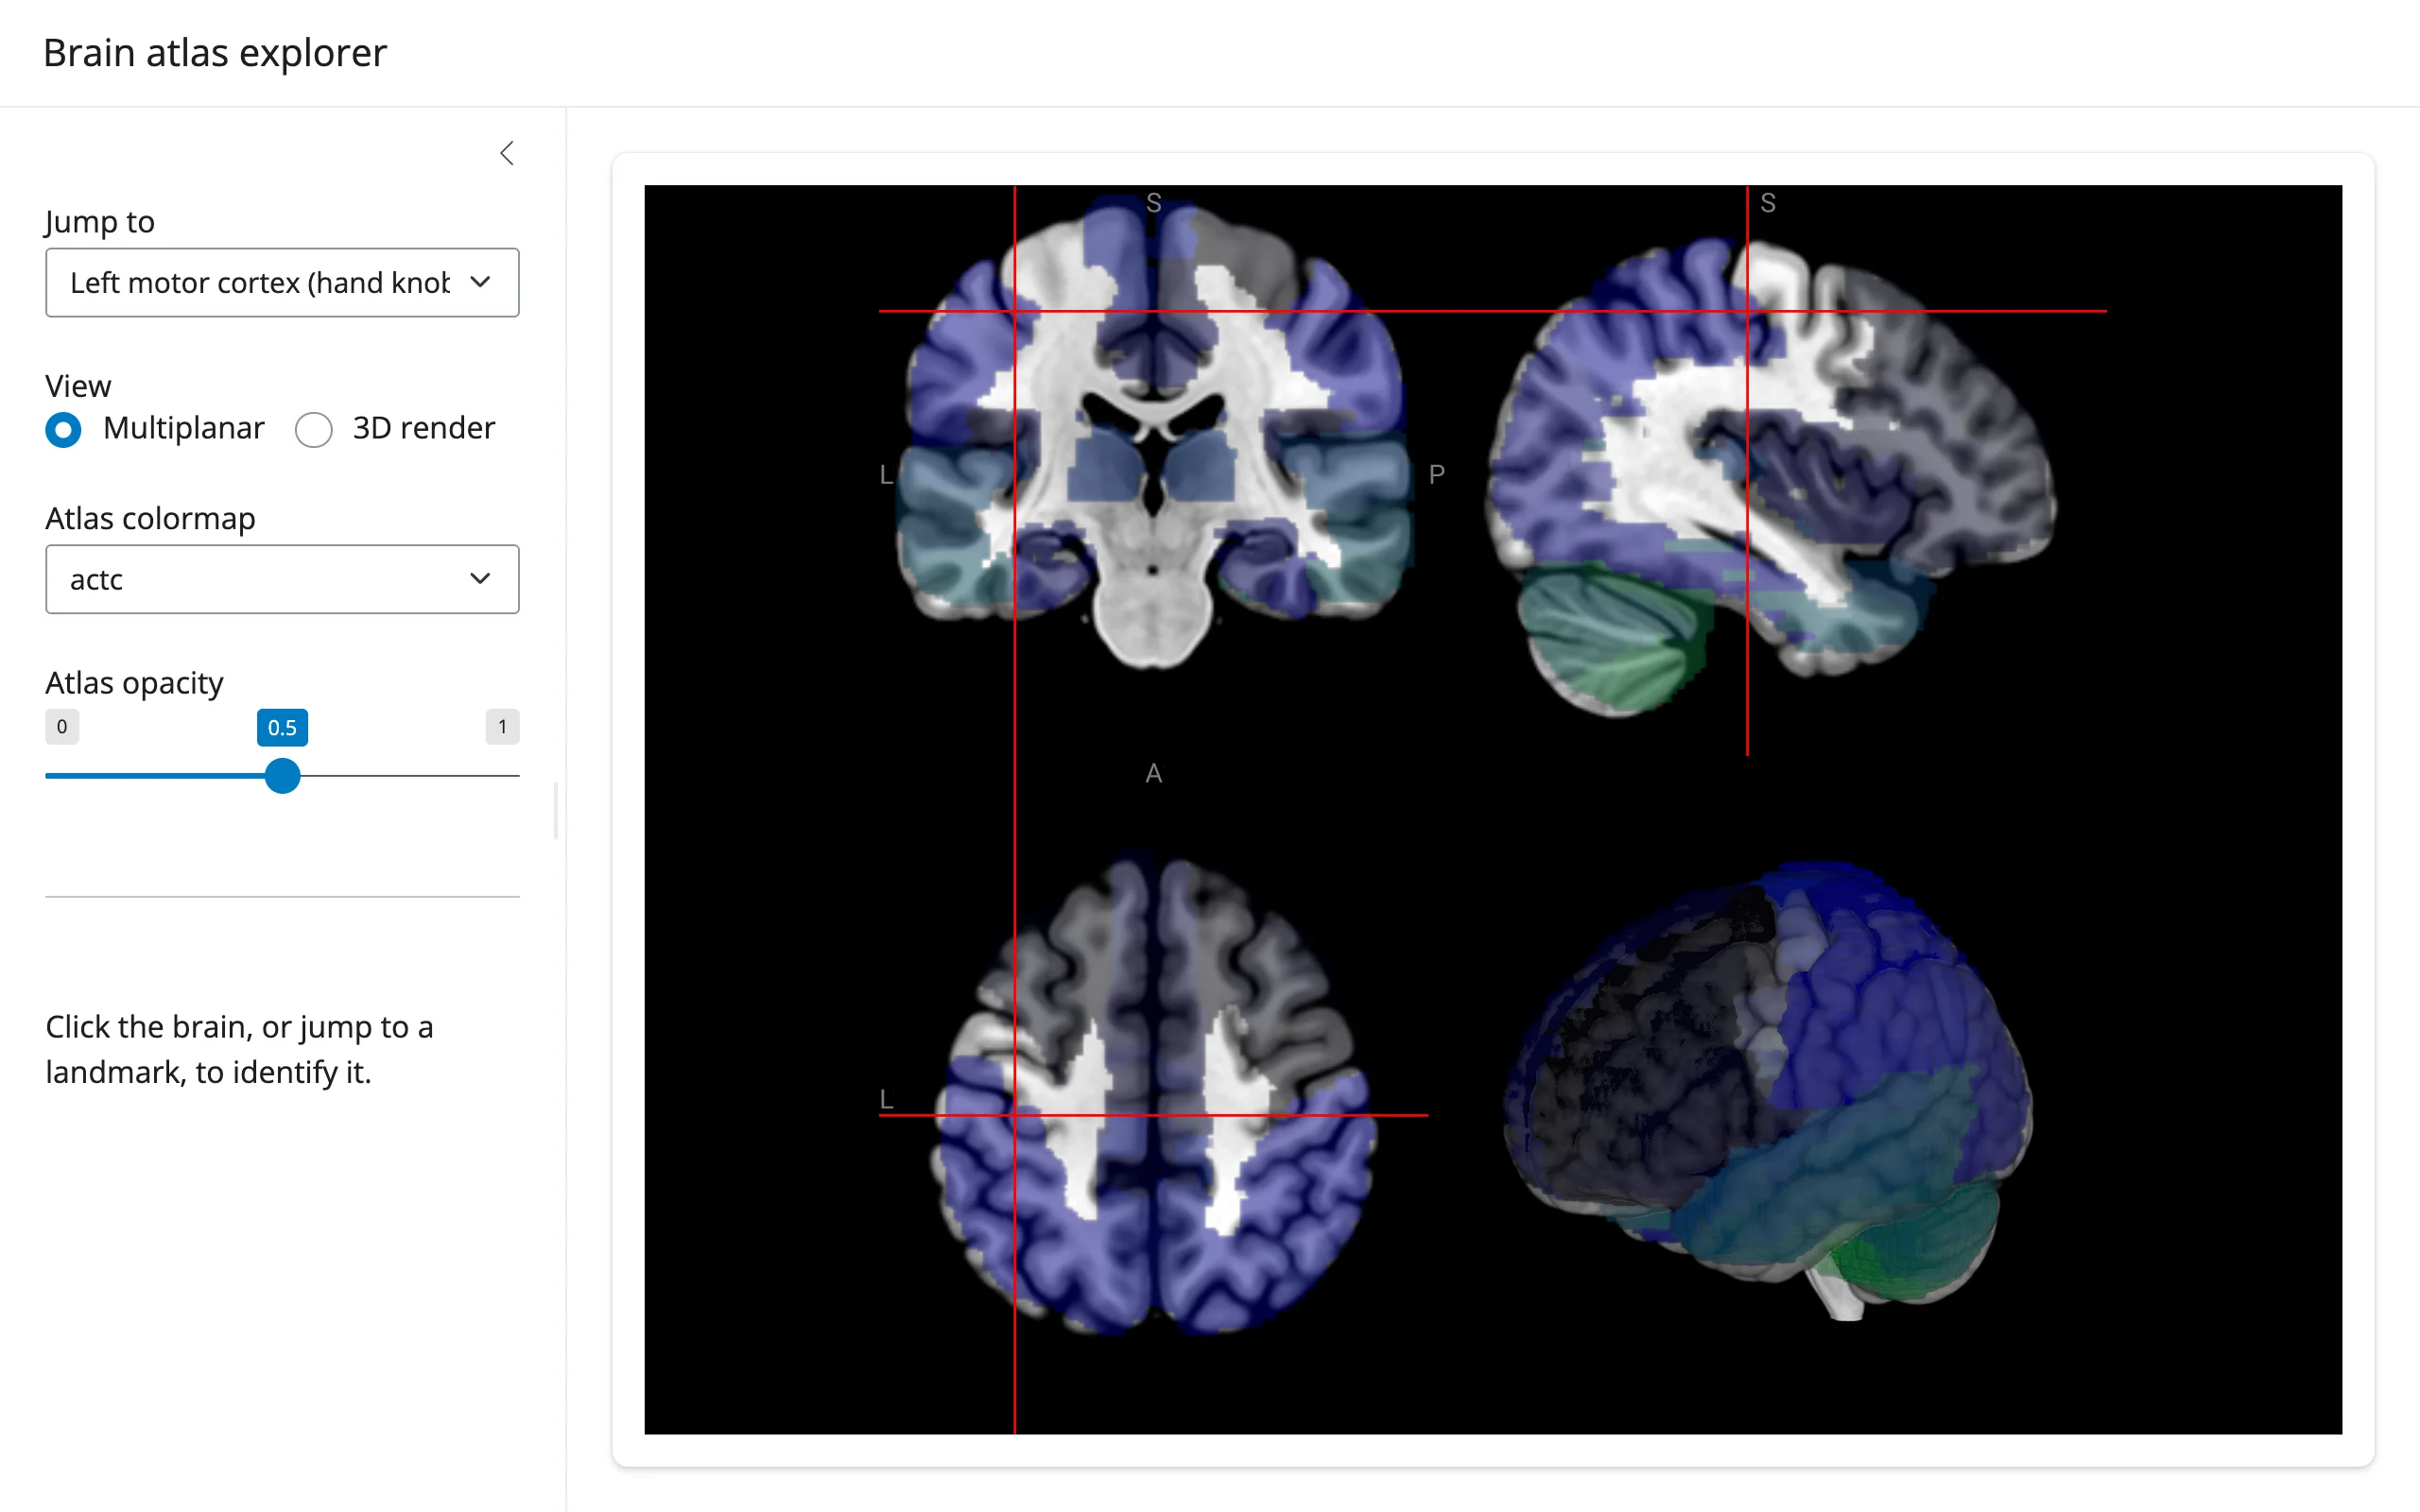
gallery/showcase_atlas_explorer.py (showcase) – combines all three linked-view patterns above: an AAL atlas overlay with adjustable colormap/opacity, a crosshair-driven region-ID card, and a landmark dropdown that jumps the crosshair via scene.crosshair_pos.
| Left amygdala | Left motor cortex (hand knob) |
|---|---|
 |
 |
Learn more
- NiiVue documentation and live demos (the source of every URL used in this guide)
- ipyniivue on GitHub
- AAL atlas and the NARPS reproducibility dataset, used in the examples above
- Related guides in this roster: k3d, ipyvolume, pythreejs for non-medical 3D scenes; itables and reactable for table-driven linked views