kepler.gl
kepler.gl is the open-source geospatial analysis tool originally built at Uber and now maintained by the Urban Computing Foundation (with Foursquare as the lead maintainer). It is not a charting library you configure in code – it’s a complete map-authoring application: drop in data and it auto-creates layers, then a side panel lets anyone add more layers, switch a layer to 3D hexbins or arcs, build filters, scrub a time window and play it back, and restyle the basemap, all without writing a line of code. It’s the same tool behind Uber’s public movement and safety data visualizations.
@render_keplergl accepts a pandas.DataFrame, a geopandas.GeoDataFrame, or a keplergl.KeplerGl widget (for multiple datasets or a starting config). A plain DataFrame becomes a single dataset named "data" and is sent as compact, NaN-safe Arrow rather than kepler’s default JSON. In a filling layout the map resizes to its container the same way every other shinywidgets output does; see Layout and sizing for the one kepler-specific wrinkle (the browser, not Python, owns the widget’s height trait once the output is sizing the map). kepler.gl has no per-gesture accessors in this release – its one synced-back trait is the whole map config, so the way to react to it is .read("config"), with the rate_policy/rate_delay kwargs to tame how often that fires during a drag or time-filter playback (see Reacting to user interaction).
Choose kepler.gl when the map itself should be an end-user tool: let an analyst add layers, pick colors, build a time filter, and hand you back a config you can store and reload. For GPU-scale point/polygon rendering driven entirely from Python, prefer lonboard. For a styled vector-tile basemap with code-driven restyling and deck.gl layers, prefer maplibre. For per-feature click/hover callbacks and a simpler API, prefer ipyleaflet or leafmap.
Installation
pip install 'shinywidgets[keplergl]'This installs keplergl>=0.4.0 (0.4 is an anywidget rewrite; 0.3.x imports pkg_resources, which setuptools >= 82 no longer ships, so @render_keplergl raises a clear install-hint error rather than a confusing one on an older version). It also pulls in geopandas, pyarrow, shapely, and pyproj, because kepler.gl’s own serializer imports geopandas and pyarrow even for plain-DataFrame input.
Quick start
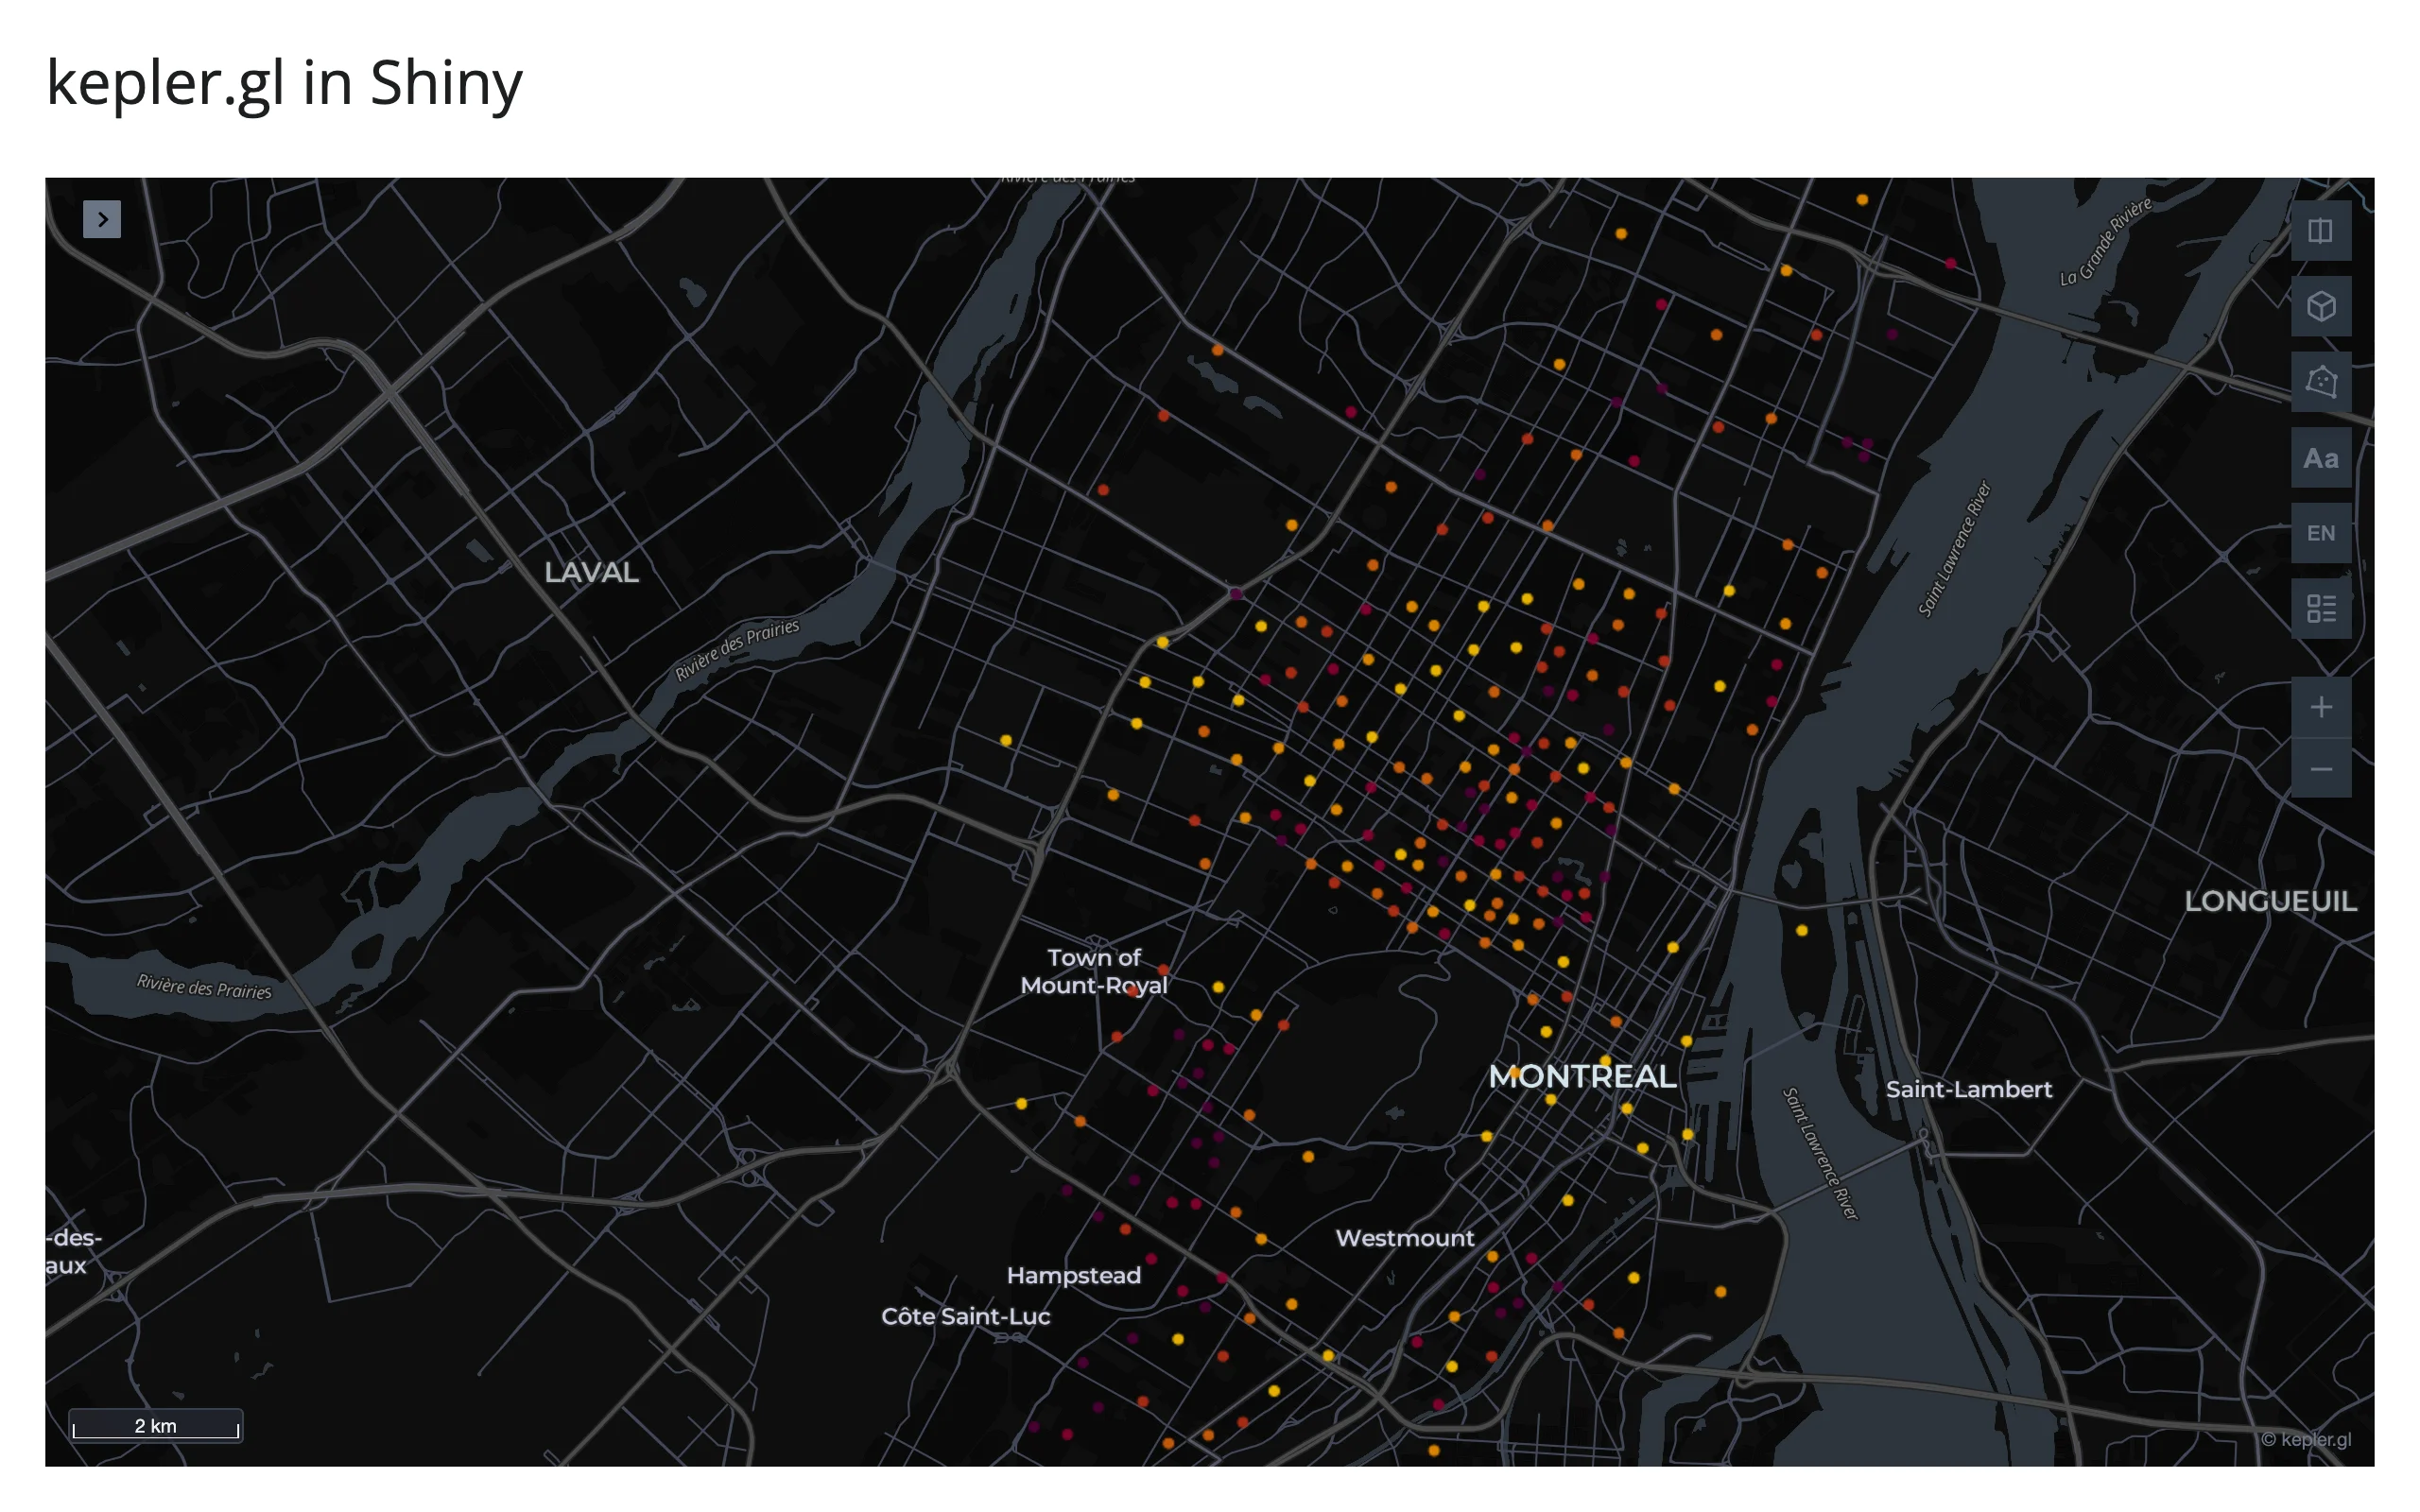
Return a DataFrame with recognizable latitude/longitude column names (lat/latitude, lon/lng/longitude) and kepler.gl auto-creates a colored point layer:
import plotly.express as px
from shiny.express import ui
from shinywidgets import render_keplergl

# Montreal car-share station activity: average hours in use per car, and
# the most common peak hour, at 249 stations
carshare = px.data.carshare().rename(
    columns={"centroid_lat": "lat", "centroid_lon": "lon"}
)

ui.page_opts(title="kepler.gl in Shiny", fillable=True)


@render_keplergl
def map():
    return carshare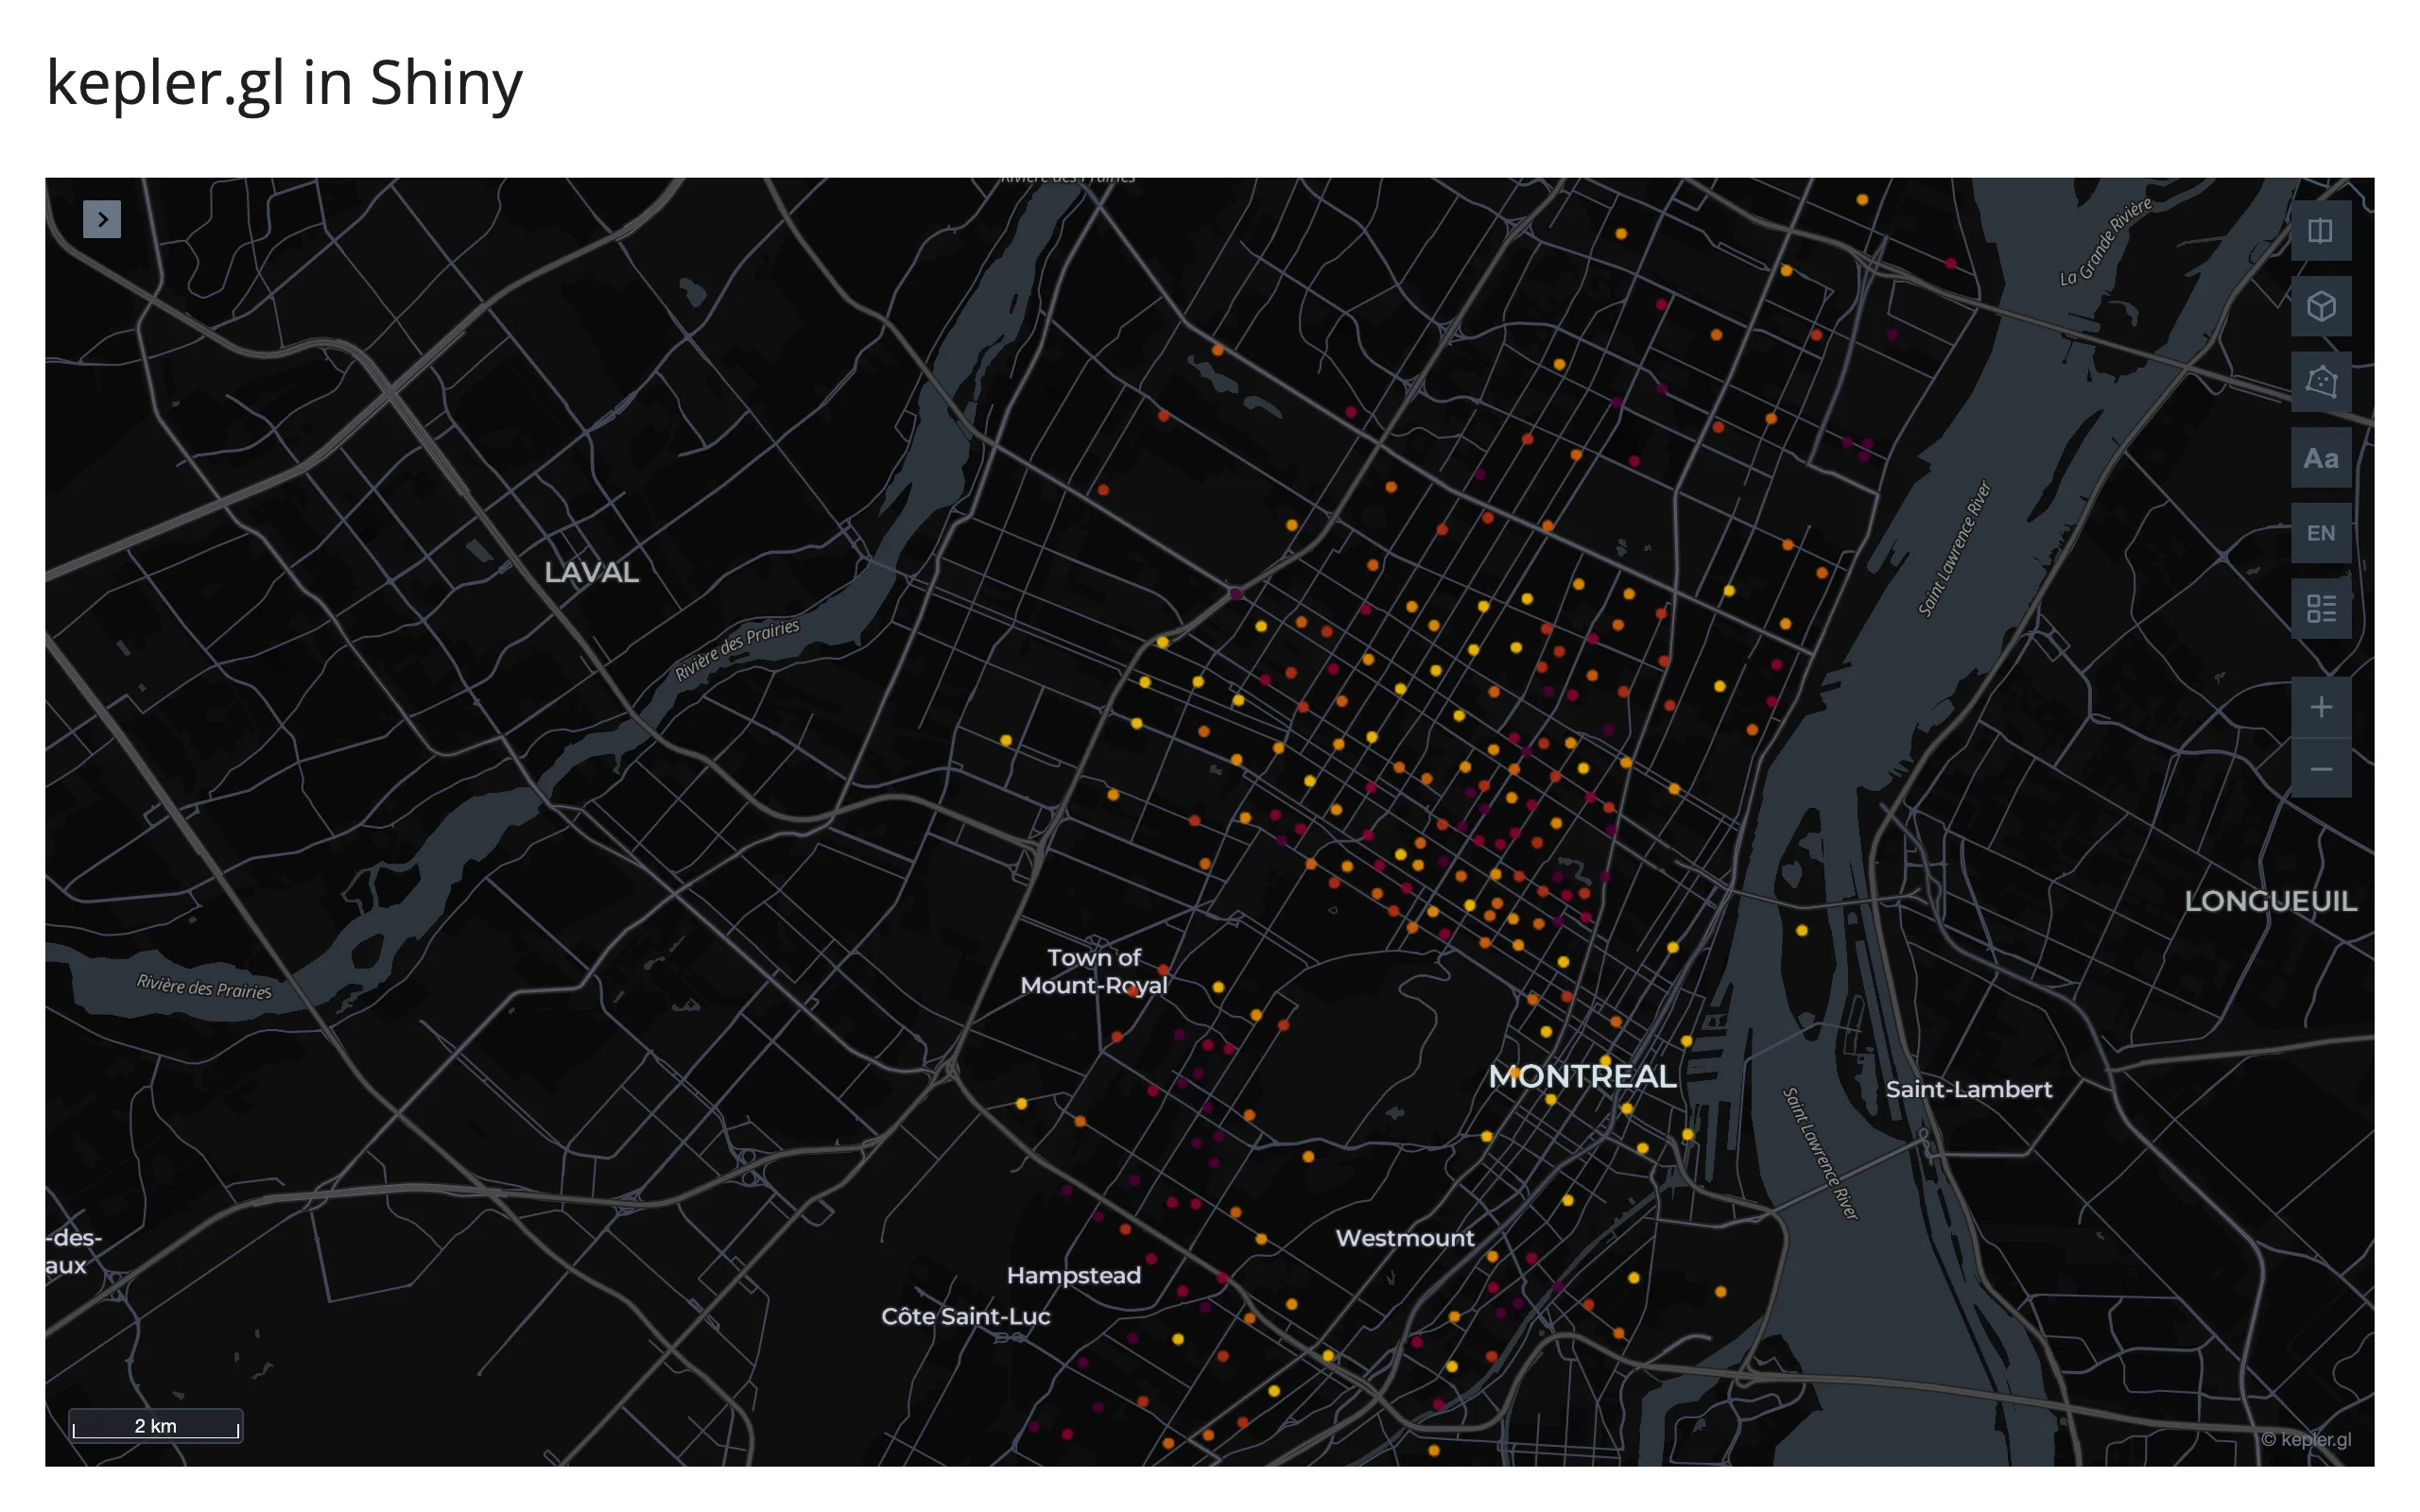
Open the side panel (the > arrow, top left) and every layer, filter, and basemap control is right there – no extra code.
What you can build
3D hexbins, authored entirely from Python
Pass a KeplerGl widget with a config instead of a bare DataFrame to skip the side-panel authoring step and open directly on a styled, aggregated view. A hexagon layer with enable3d turns point density into a 3D bar chart on the map:
import plotly.express as px
from keplergl import KeplerGl
from shiny.express import ui
from shinywidgets import render_keplergl

carshare = px.data.carshare().rename(
    columns={"centroid_lat": "lat", "centroid_lon": "lon"}
)

# A hand-written kepler.gl config: one 3D hexbin layer, colored and sized by
# average car-share hours per hexagon. Writing config upfront, rather than
# setting `.widget.config` after render, avoids a duplicate auto-created
# layer (see Gotchas & limitations).
CONFIG = {
    "version": "v1",
    "config": {
        "visState": {
            "layers": [
                {
                    "id": "carshare-hex",
                    "type": "hexagon",
                    "config": {
                        "dataId": "data",
                        "label": "Car-share activity",
                        "columns": {"lat": "lat", "lng": "lon"},
                        "isVisible": True,
                        "visConfig": {
                            "worldUnitSize": 0.5,
                            "resolution": 8,
                            "colorRange": {
                                "name": "Global Warming",
                                "type": "sequential",
                                "category": "Uber",
                                "colors": [
                                    "#4C0035",
                                    "#880030",
                                    "#B72F15",
                                    "#D6610A",
                                    "#EF9100",
                                    "#FFC300",
                                ],
                            },
                            "coverage": 0.9,
                            "elevationScale": 15,
                            "enable3d": True,
                        },
                    },
                    "visualChannels": {
                        "colorField": {"name": "car_hours", "type": "real"},
                        "colorScale": "quantile",
                        "sizeField": {"name": "car_hours", "type": "real"},
                        "sizeScale": "linear",
                    },
                }
            ],
        },
        "mapState": {
            "latitude": 45.53,
            "longitude": -73.626,
            "zoom": 11.2,
            "pitch": 50,
            "bearing": -15,
        },
    },
}

ui.page_opts(title="3D hexbin via config", fillable=True)


@render_keplergl
def map():
    return KeplerGl(data={"data": carshare}, config=CONFIG)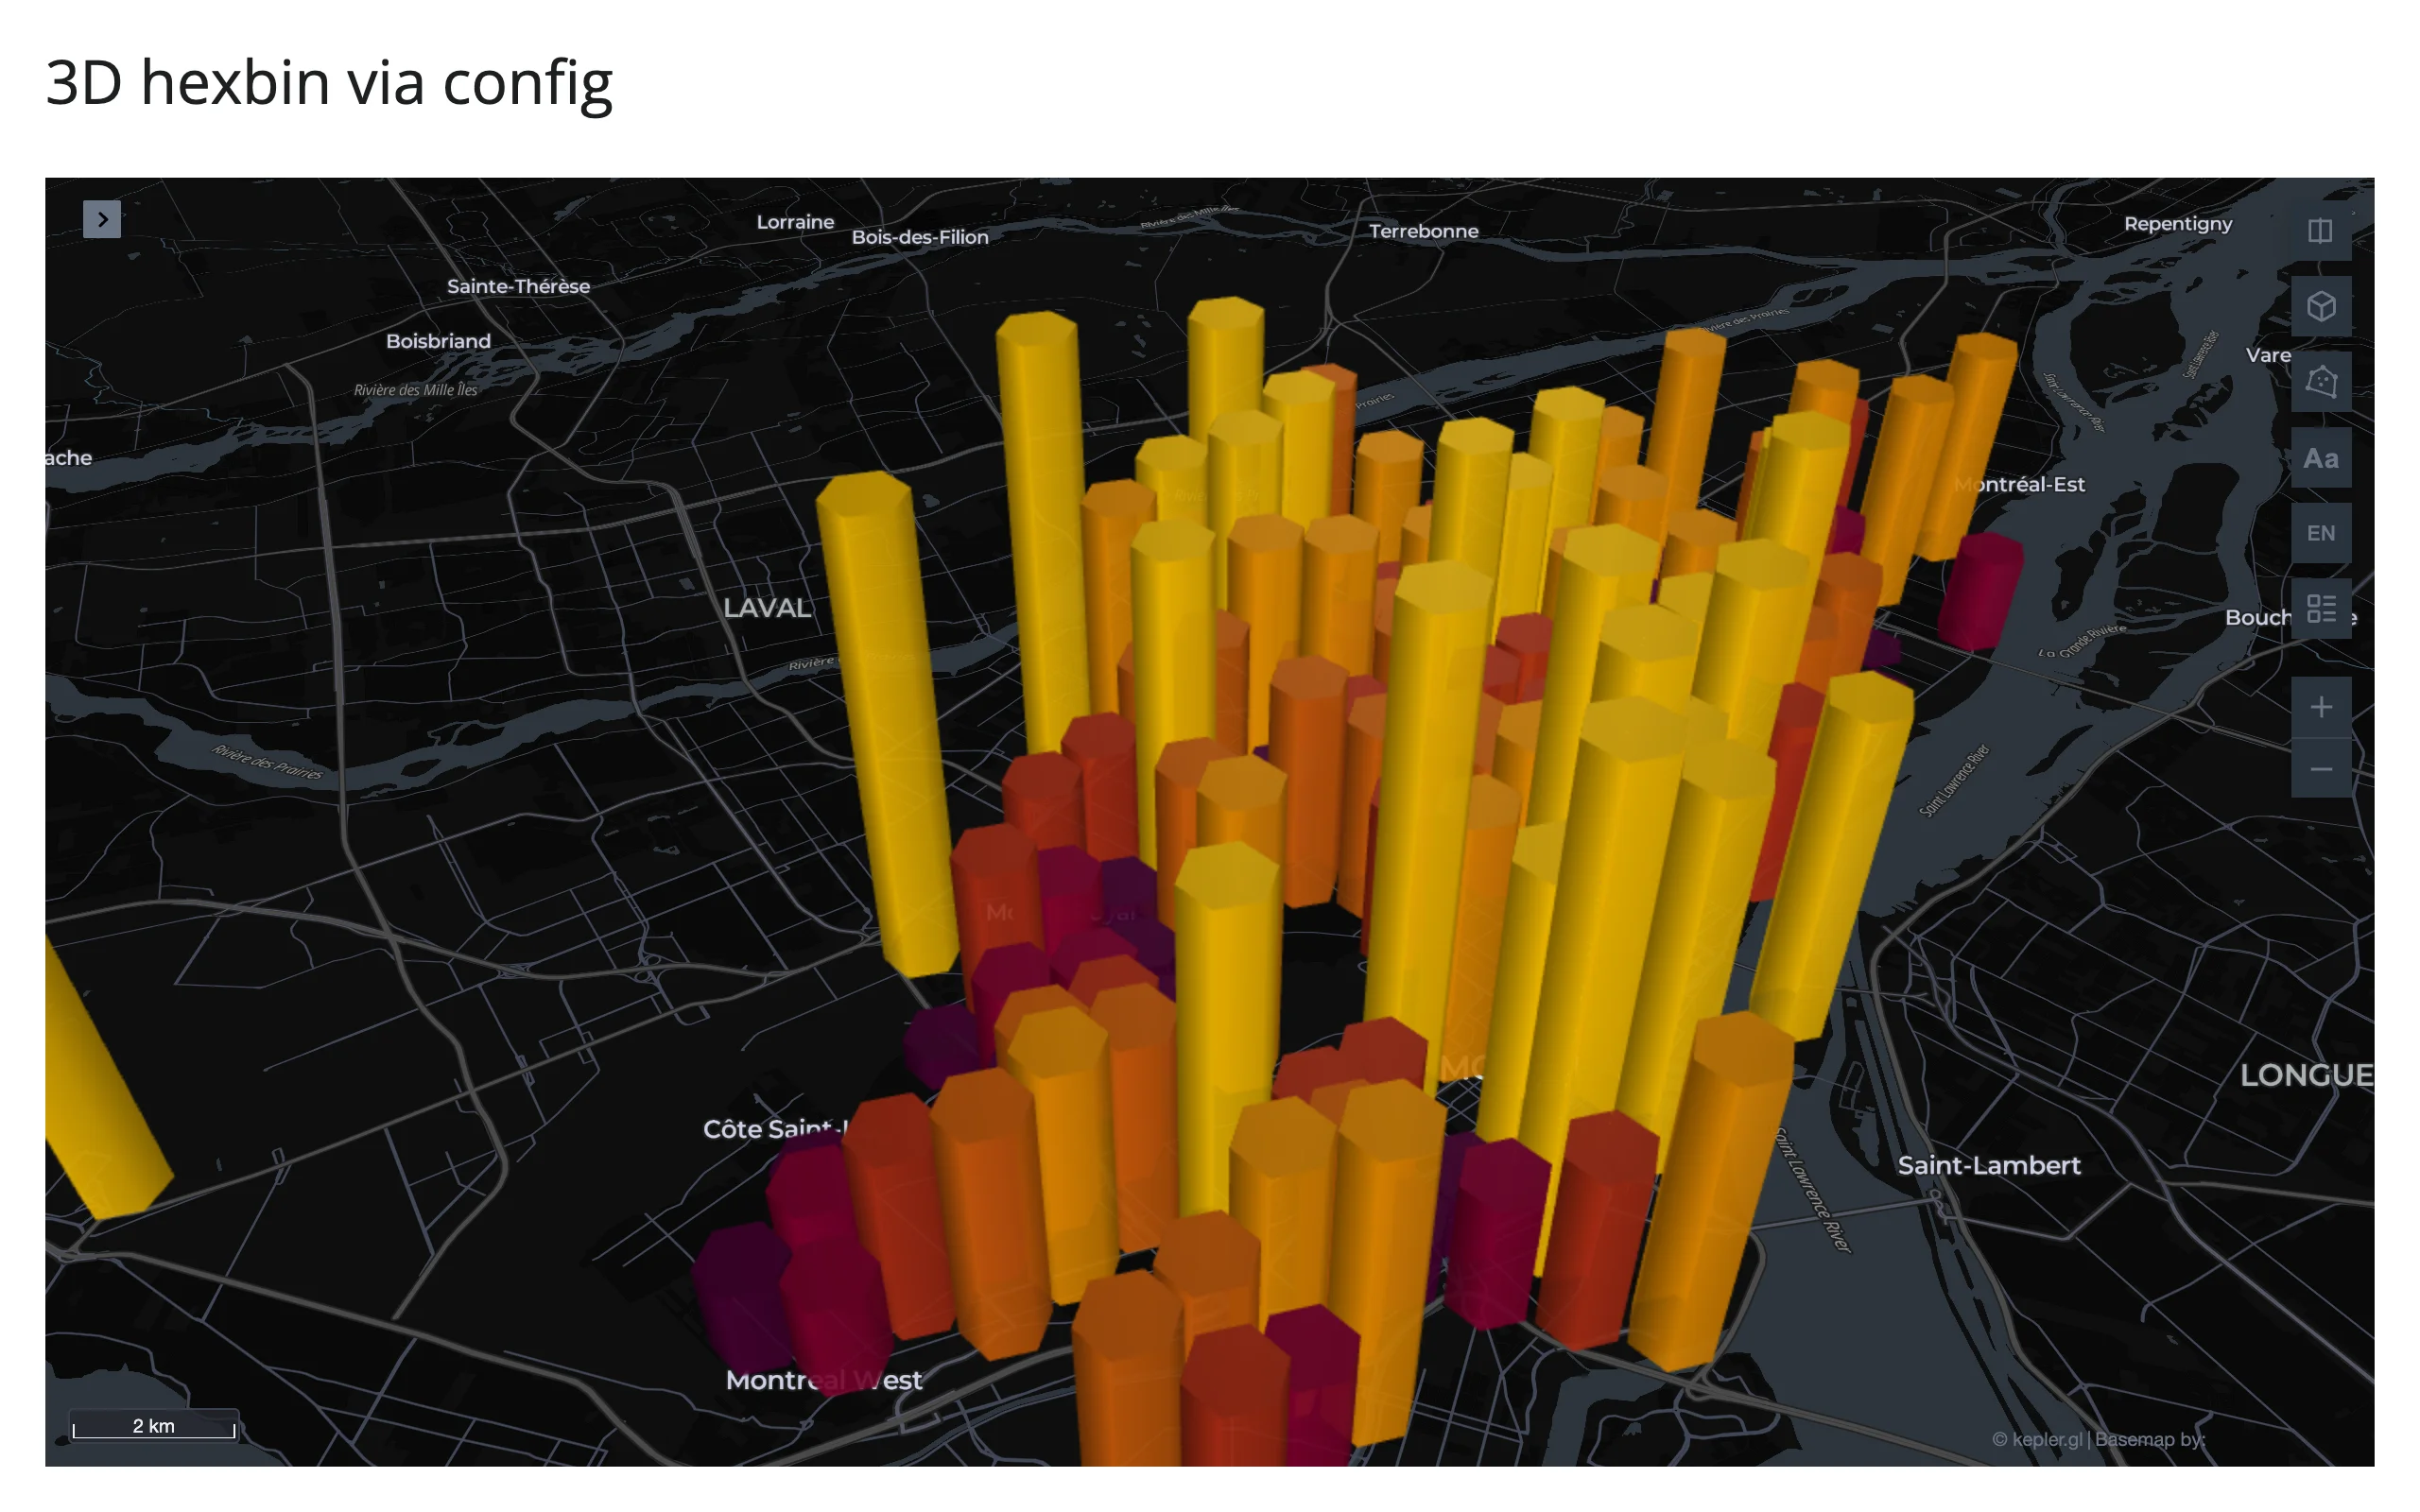
kepler.gl’s config schema is large but mostly optional – every key you omit falls back to a sensible default. The easiest way to get a starting config is to build one in the UI once and read it back with .read("config") (see Coordinating multiple views).
GeoDataFrame input
A GeoDataFrame works exactly like a plain DataFrame, as long as it’s in EPSG:4326 (longitude/latitude degrees) – kepler.gl does not reproject, so a GeoDataFrame in any other CRS renders silently in the wrong place.
import geopandas as gpd
import plotly.express as px
from shiny.express import ui
from shinywidgets import render_keplergl

carshare = px.data.carshare().rename(
    columns={"centroid_lat": "lat", "centroid_lon": "lon"}
)

# A GeoDataFrame works the same way as a plain DataFrame, as long as it's in
# EPSG:4326 (longitude/latitude degrees). kepler.gl doesn't reproject: a
# GeoDataFrame in any other CRS renders in the wrong place with no error.
stations = gpd.GeoDataFrame(
    carshare,
    geometry=gpd.points_from_xy(carshare.lon, carshare.lat),
    crs="EPSG:4326",
)

ui.page_opts(title="GeoDataFrame input", fillable=True)


@render_keplergl
def map():
    return stations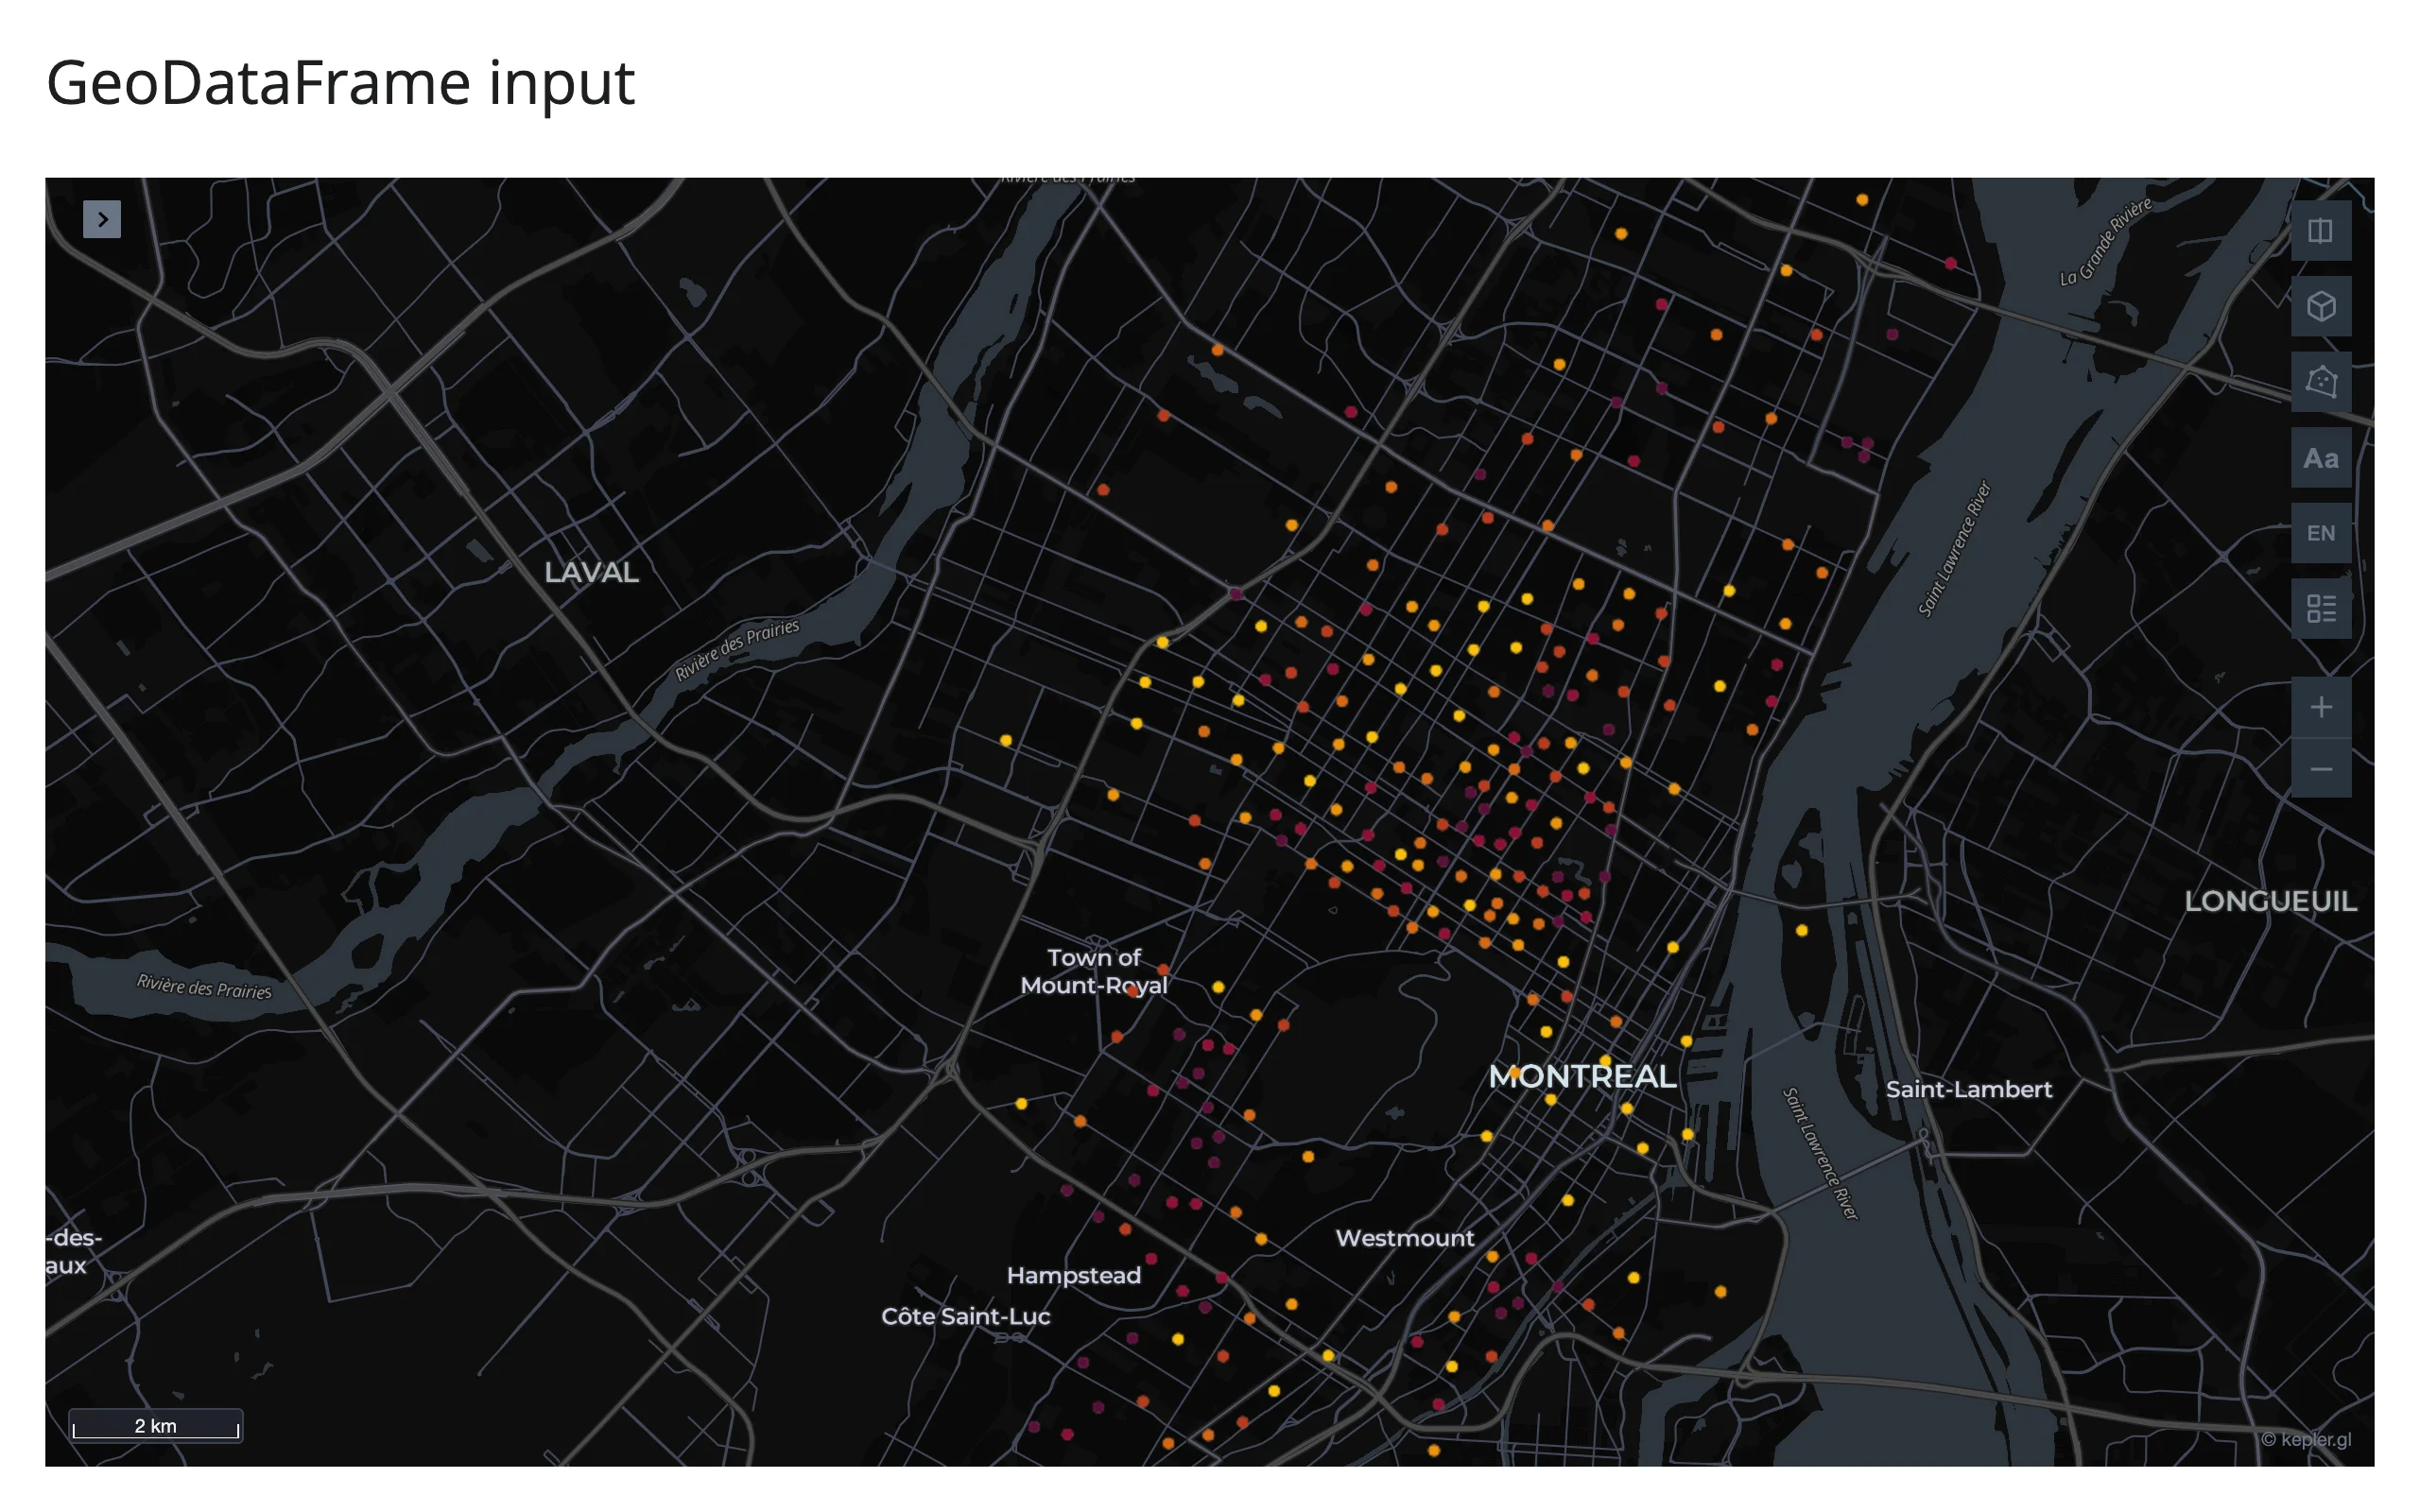
Time filter and playback
Add a timeRange filter to the config and kepler.gl draws a histogram + draggable window + play button at the bottom of the map. This is the single most distinctive kepler.gl feature: the window (and its playback) lives entirely in the widget’s config, so Python can read exactly what’s visible at any moment (see Coordinating multiple views).
import pandas as pd
from keplergl import KeplerGl
from shiny.express import ui
from shinywidgets import render_keplergl

# A full year (2015) of daily positions for ten tracked bird species migrating
# between South America and the Arctic (vega-datasets' "bird-migration", also
# one of kepler.gl's own demo datasets). kepler.gl needs a real timestamp dtype
# (not a date string) to offer a time filter.
birds = pd.read_csv("https://cdn.jsdelivr.net/gh/vega/vega-datasets@5448e25297c8f705be78e879d5423d55d04dc6f1/data/bird-migration.csv")
birds["date"] = pd.to_datetime(birds["date"])

# A timeRange filter adds the histogram + play button at the bottom of the
# map. The initial window (in epoch milliseconds) spotlights one week in
# April, mid-way through the northward spring migration.
CONFIG = {
    "version": "v1",
    "config": {
        "visState": {
            "filters": [
                {
                    "dataId": ["data"],
                    "id": "migration-date-window",
                    "name": ["date"],
                    "type": "timeRange",
                    "value": [1_427_846_400_000, 1_428_451_200_000],
                    "plotType": {"type": "histogram", "interval": "1-day"},
                    "animationWindow": "free",
                    "view": "enlarged",
                    "speed": 1,
                    "enabled": True,
                }
            ],
        },
        "mapState": {
            "latitude": 25.0,
            "longitude": -85.0,
            "zoom": 3.5,
        },
    },
}

ui.page_opts(title="Time filter and playback", fillable=True)


@render_keplergl
def map():
    return KeplerGl(data={"data": birds}, config=CONFIG)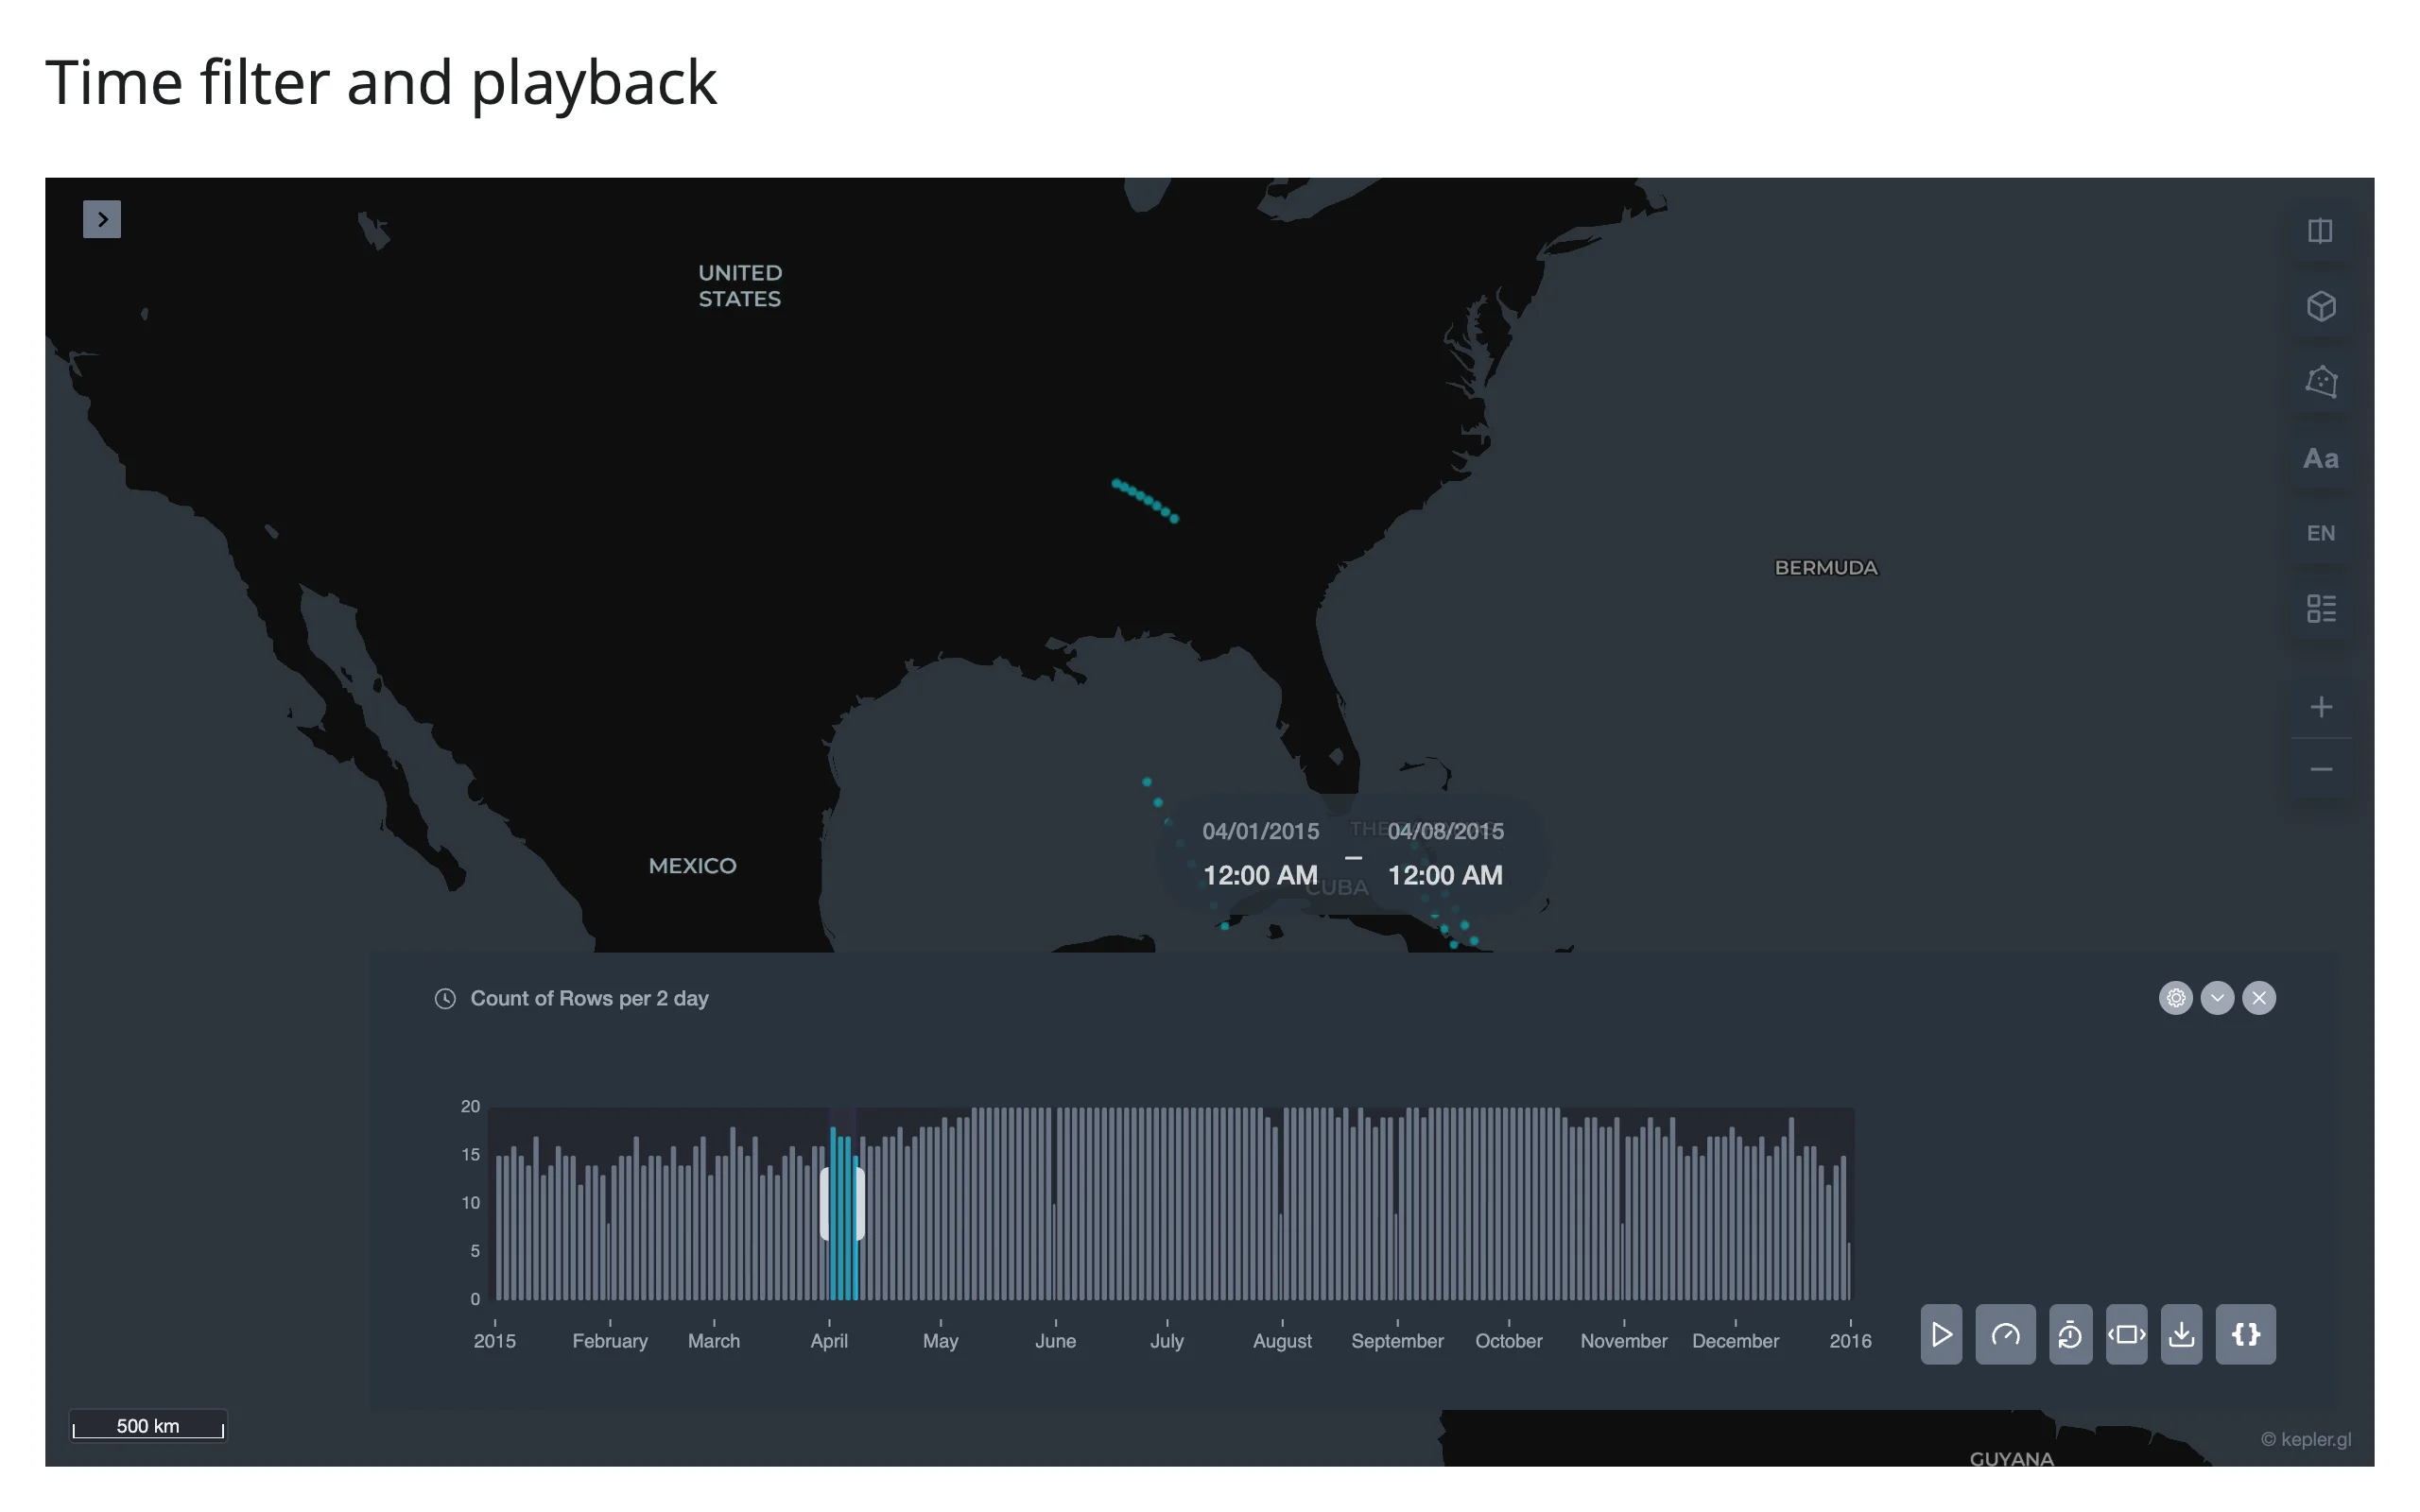
Timestamps need to be a real datetime dtype (not a date string): kepler.gl’s field-type detection only recognizes a timeRange-filterable column from an Arrow timestamp column, which use_arrow=True sends for any datetime64 column. A plain string column shows up as string, with no time filter available.
Reacting to user interaction
@render_keplergl declares no accessors: kepler.gl’s one synced-back trait is the entire map config, which the design deliberately leaves to .read() rather than wrapping in a named accessor. Two reasons: there is no single “headline” interaction (config mixes layer edits, filter drags, and camera moves in one blob), and during time-filter playback or a hexbin drag it can rewrite dozens of times a second – exactly the kind of noisy, undifferentiated stream that doesn’t suit a dedicated accessor but does suit a rate-limited .read().
Beyond the accessors: .read()
config is the trait worth reading. height also changes (the browser writes the measured size into it; see Layout and sizing), but data, mapbox_token, theme, and app_name are Python-to-browser only – kepler.gl’s bundled JS never writes them back.
config is {} until the map has loaded, so guard for that. Once populated, the useful parts are:
| Path | What it holds |
|---|---|
config["mapState"] |
latitude, longitude, zoom, pitch, bearing – updates on every pan, zoom, tilt, or rotate |
config["visState"]["layers"] |
Every layer’s type, columns, color/size encodings, and isVisible – updates when the user adds, edits, or toggles a layer in the side panel |
config["visState"]["filters"] |
Each filter’s current value (a [start, end] pair in epoch ms for a timeRange filter) – updates on every drag and on every animation frame during playback |
import plotly.express as px
from shiny.express import render, ui
from shinywidgets import render_keplergl

carshare = px.data.carshare().rename(
    columns={"centroid_lat": "lat", "centroid_lon": "lon"}
)

ui.page_opts(title="Reading kepler.gl's config", fillable=True)

with ui.layout_columns(col_widths=[8, 4]):
    with ui.card(full_screen=True):

        @render_keplergl
        def map():
            return carshare

    with ui.card():
        ui.card_header("Map view (from config.mapState)")

        @render.code
        def view_state():
            config = map.read("config")
            state = config.get("config", {}).get("mapState", {})
            if not state:
                return "Waiting for the map to load..."
            return (
                f"lat:     {state['latitude']:.3f}\n"
                f"lon:     {state['longitude']:.3f}\n"
                f"zoom:    {state['zoom']:.2f}\n"
                f"pitch:   {state['pitch']:.0f}\n"
                f"bearing: {state['bearing']:.0f}"
            )
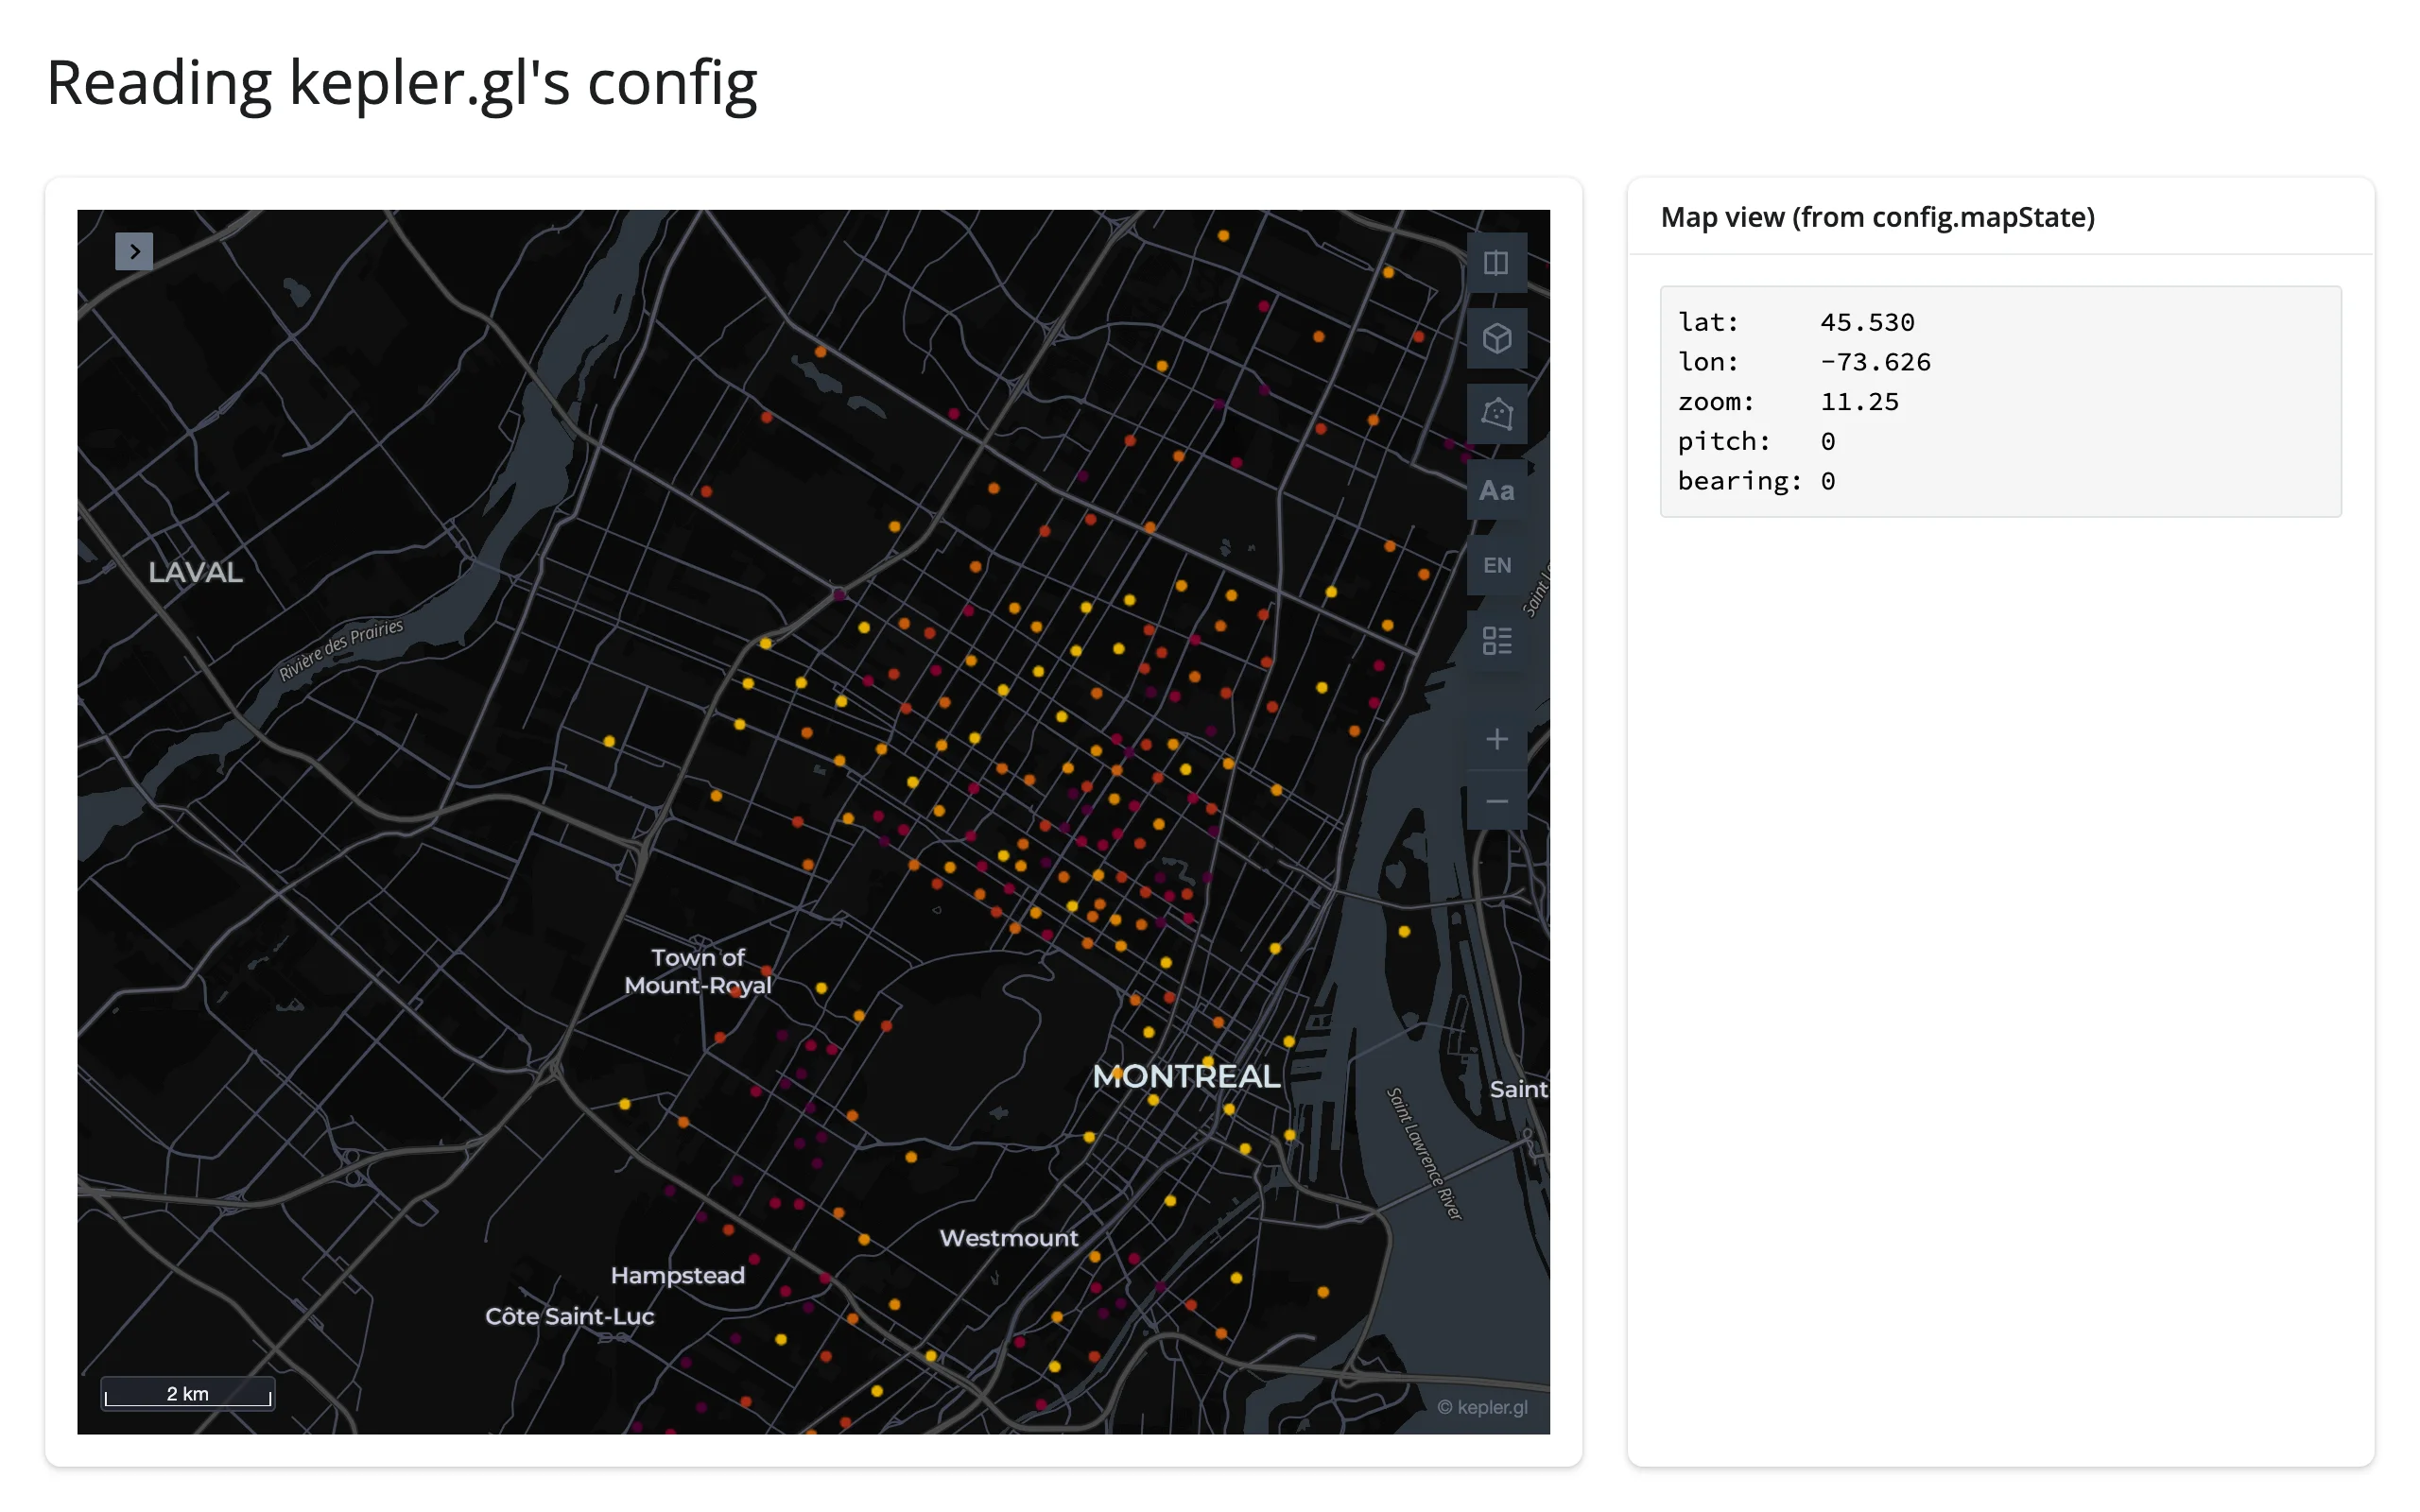
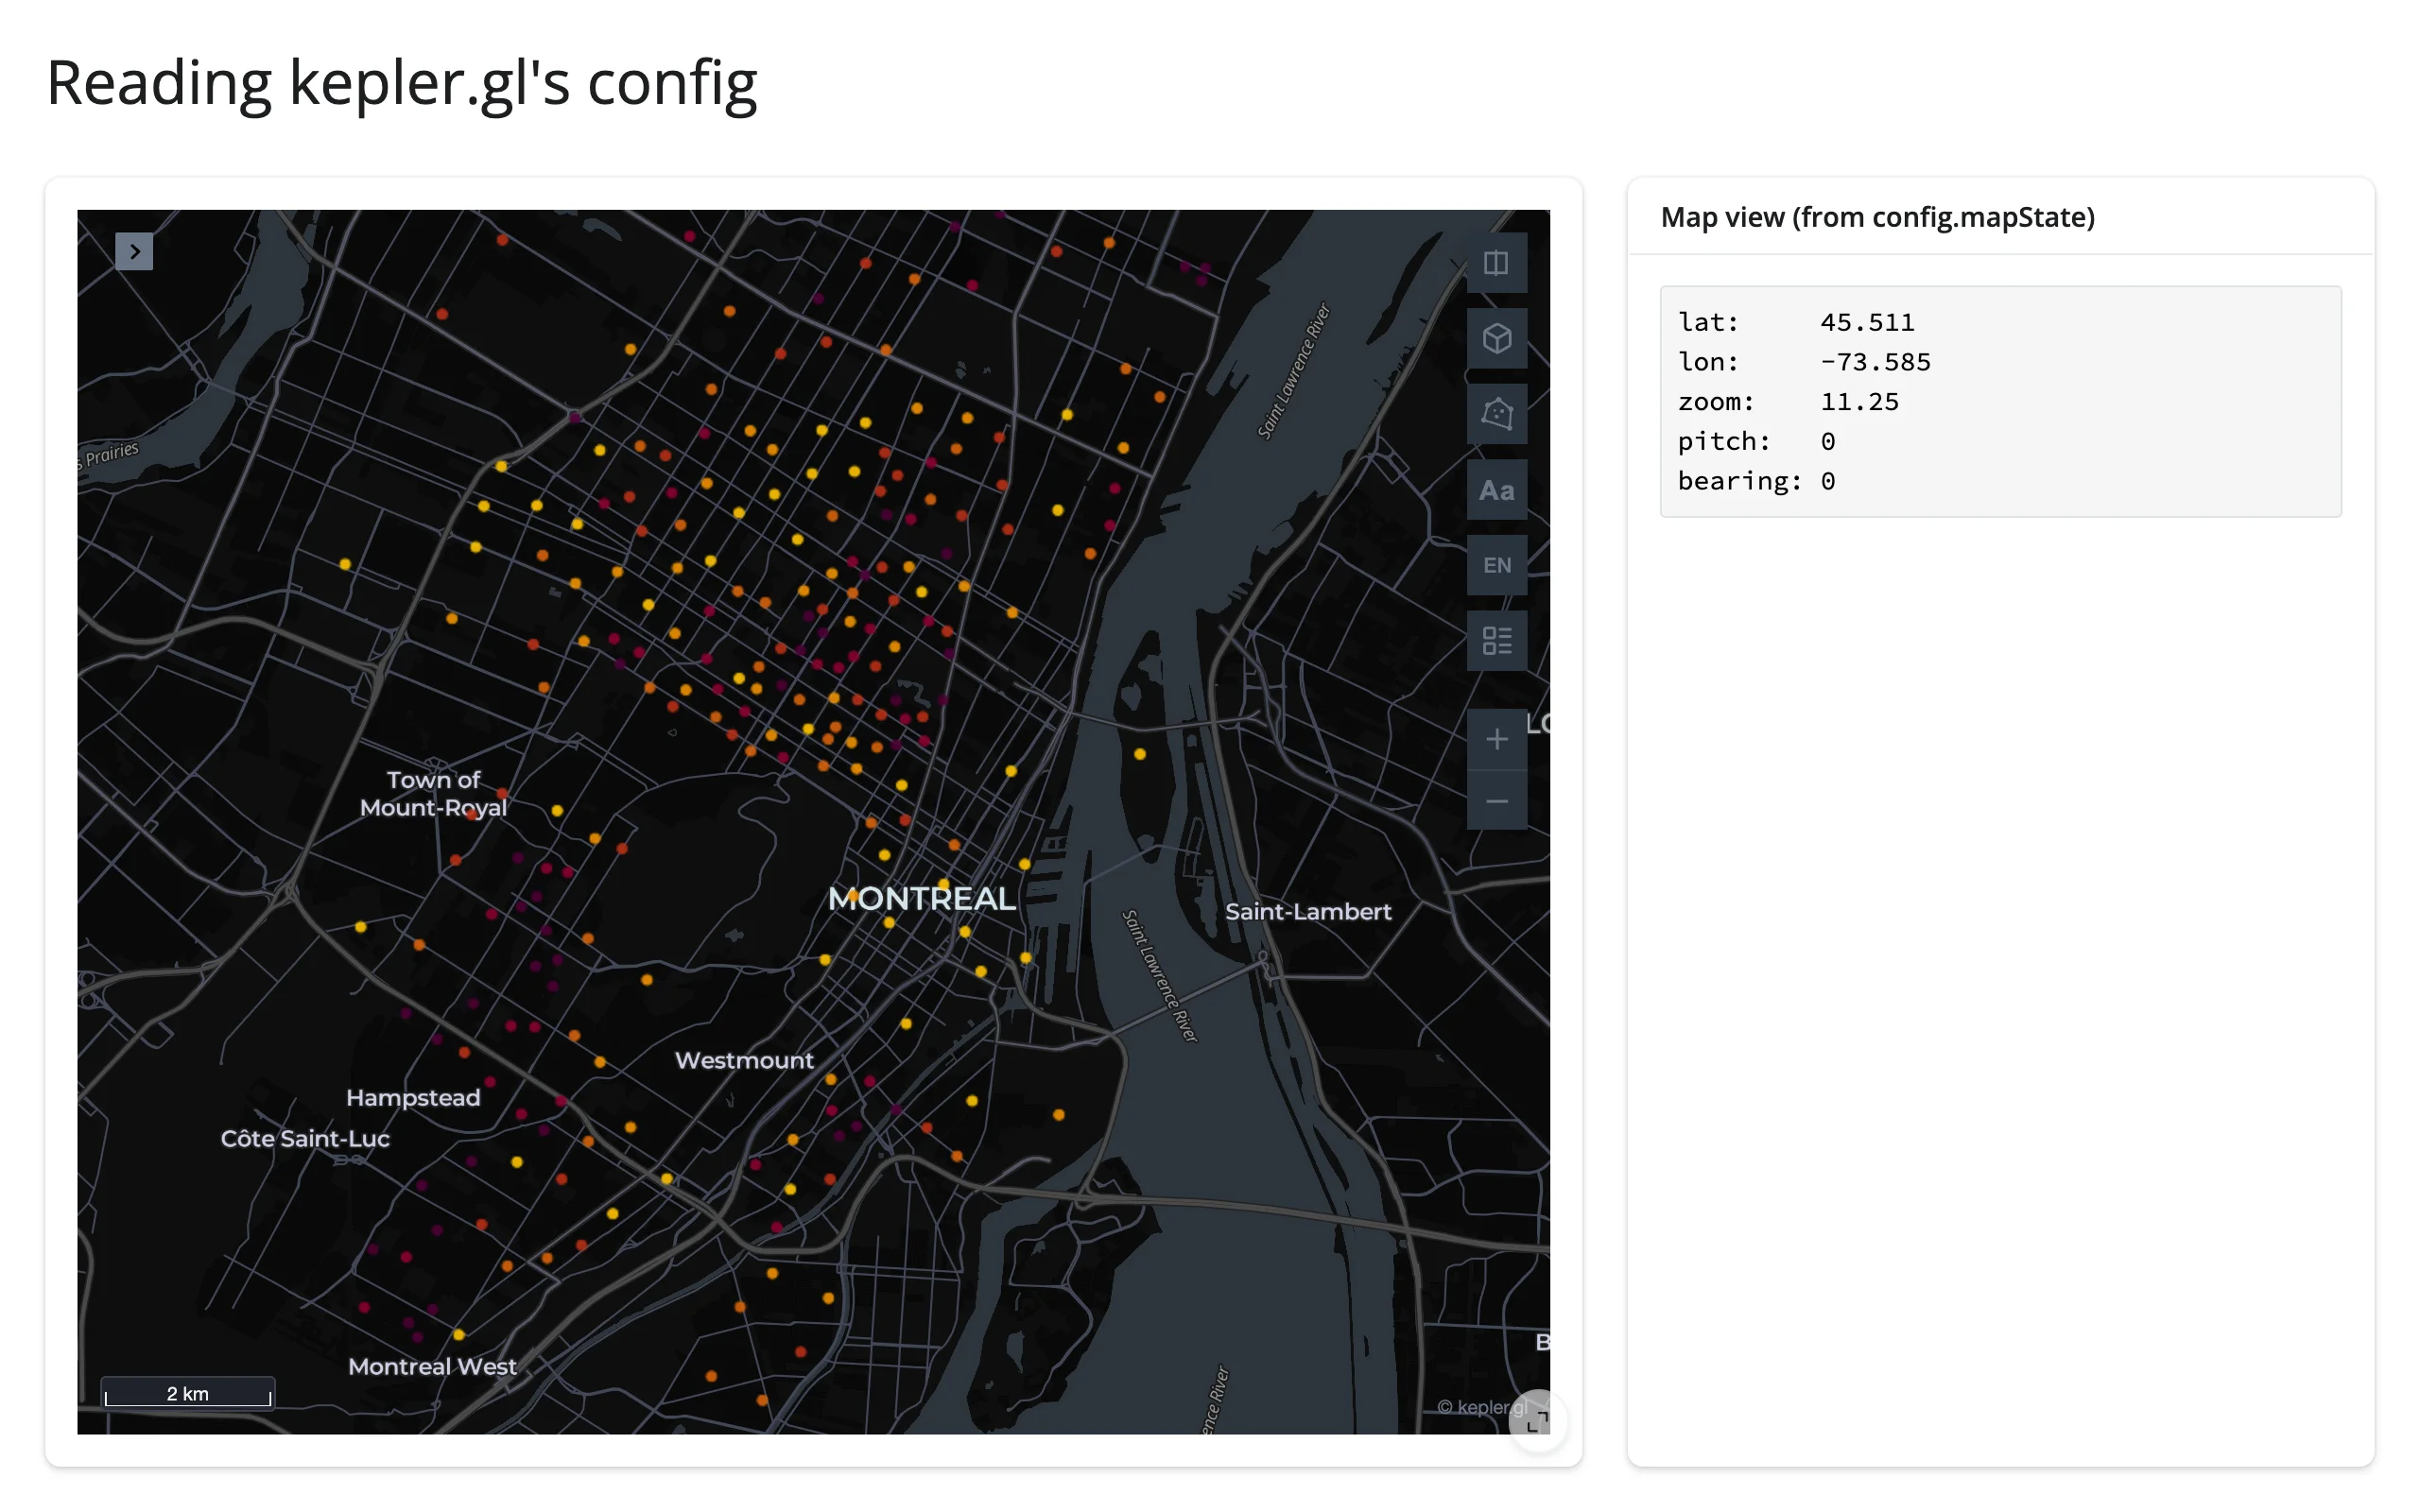
Before / after a drag on the map (verified: lat/lon update live, zoom/pitch/bearing unchanged by a pan):
Rate limiting
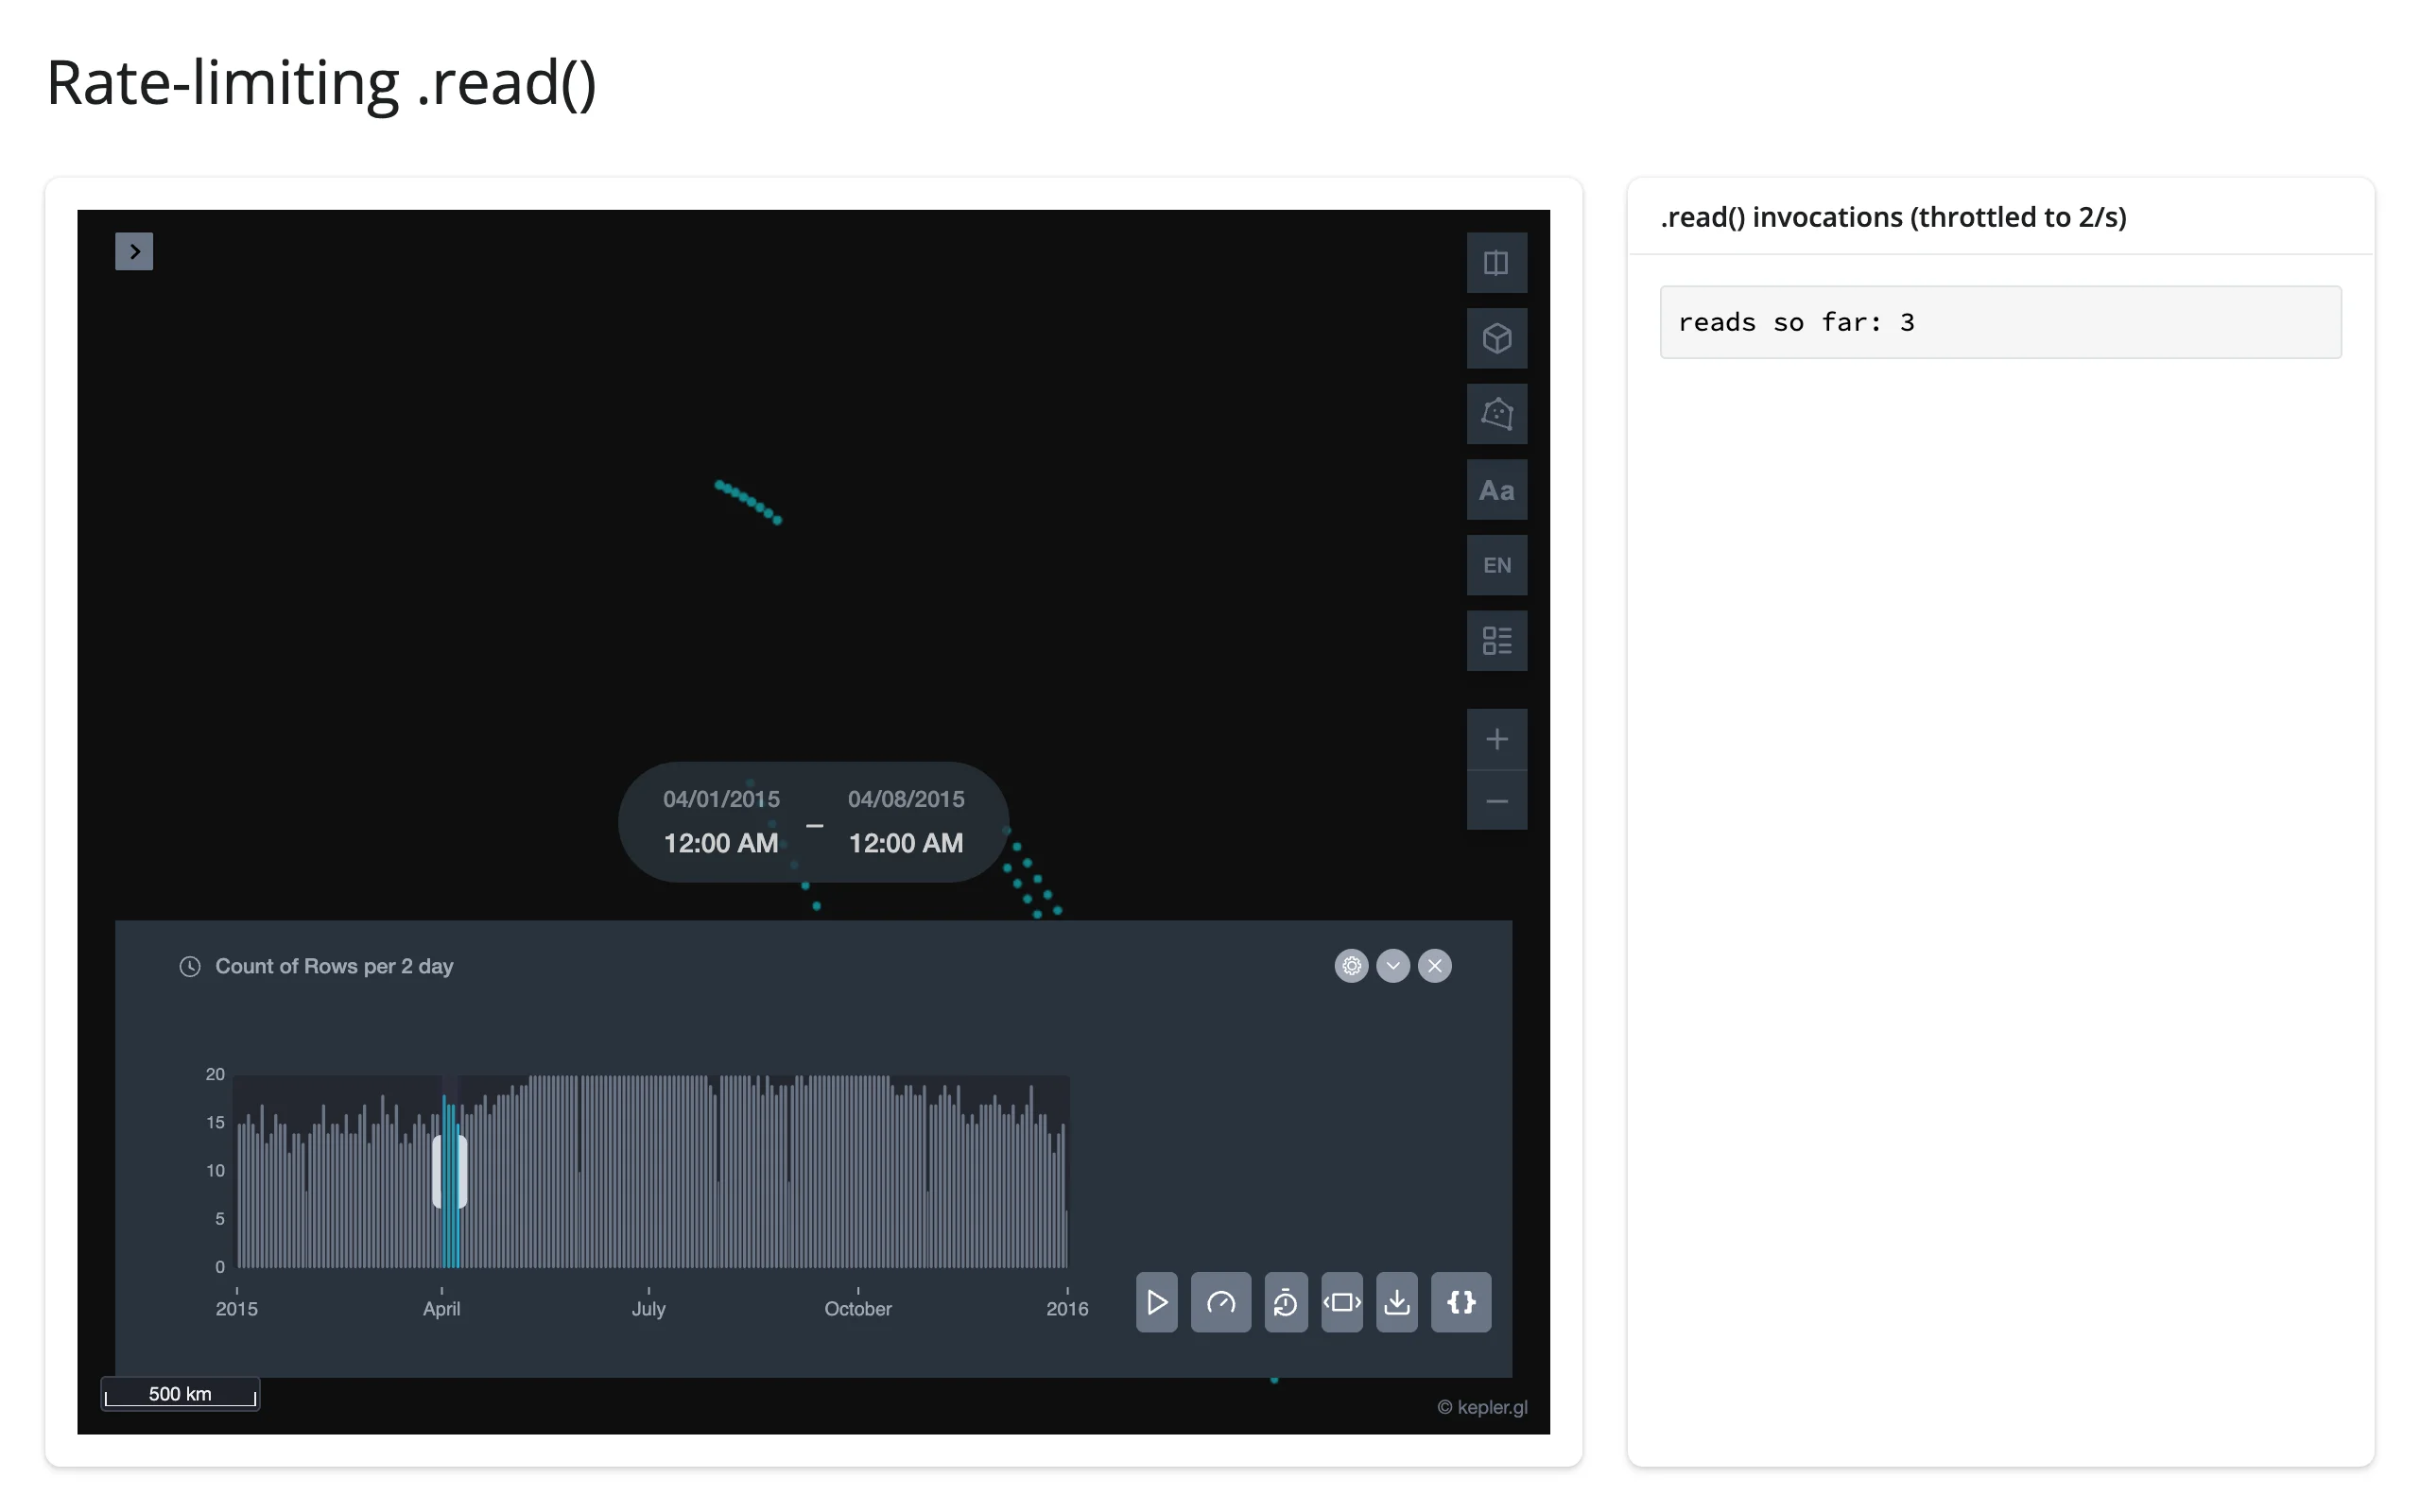
config rewrites on close to every animation frame during time-filter playback – measured at over 200 .read() invalidations in 4 seconds of playback with no rate limit, against a widget whose view only needs to update a couple of times a second. render_keplergl’s rate_policy and rate_delay kwargs throttle (or debounce) every .read()/reactive_read() on that widget’s instance, not just one reader:
import pandas as pd
from keplergl import KeplerGl
from shiny import reactive
from shiny.express import render, ui
from shinywidgets import render_keplergl

birds = pd.read_csv("https://cdn.jsdelivr.net/gh/vega/vega-datasets@5448e25297c8f705be78e879d5423d55d04dc6f1/data/bird-migration.csv")
birds["date"] = pd.to_datetime(birds["date"])

CONFIG = {
    "version": "v1",
    "config": {
        "visState": {
            "filters": [
                {
                    "dataId": ["data"],
                    "id": "migration-date-window",
                    "name": ["date"],
                    "type": "timeRange",
                    "value": [1_427_846_400_000, 1_428_451_200_000],
                    "plotType": {"type": "histogram", "interval": "1-day"},
                    "animationWindow": "free",
                    "view": "enlarged",
                    "speed": 1,
                    "enabled": True,
                }
            ],
        },
        "mapState": {
            "latitude": 25.0,
            "longitude": -85.0,
            "zoom": 3.5,
        },
    },
}

ui.page_opts(title="Rate-limiting .read()", fillable=True)

with ui.layout_columns(col_widths=[8, 4]):
    with ui.card(full_screen=True):

        # `config` rewrites on almost every animation frame during playback.
        # Without a rate policy, every frame invalidates every reader.
        @render_keplergl(rate_policy="throttle", rate_delay=0.5)
        def map():
            return KeplerGl(data={"data": birds}, config=CONFIG)

    with ui.card():
        ui.card_header(".read() invocations (throttled to 2/s)")
        count = reactive.value(0)

        @reactive.effect
        def _():
            map.read("config")
            with reactive.isolate():
                count.set(count.get() + 1)

        @render.code
        def n():
            return f"reads so far: {count.get()}"
Driving the same playback gesture against this widget: throttled to at most one read per 0.5 s (2/s), vs. dozens per second unthrottled.
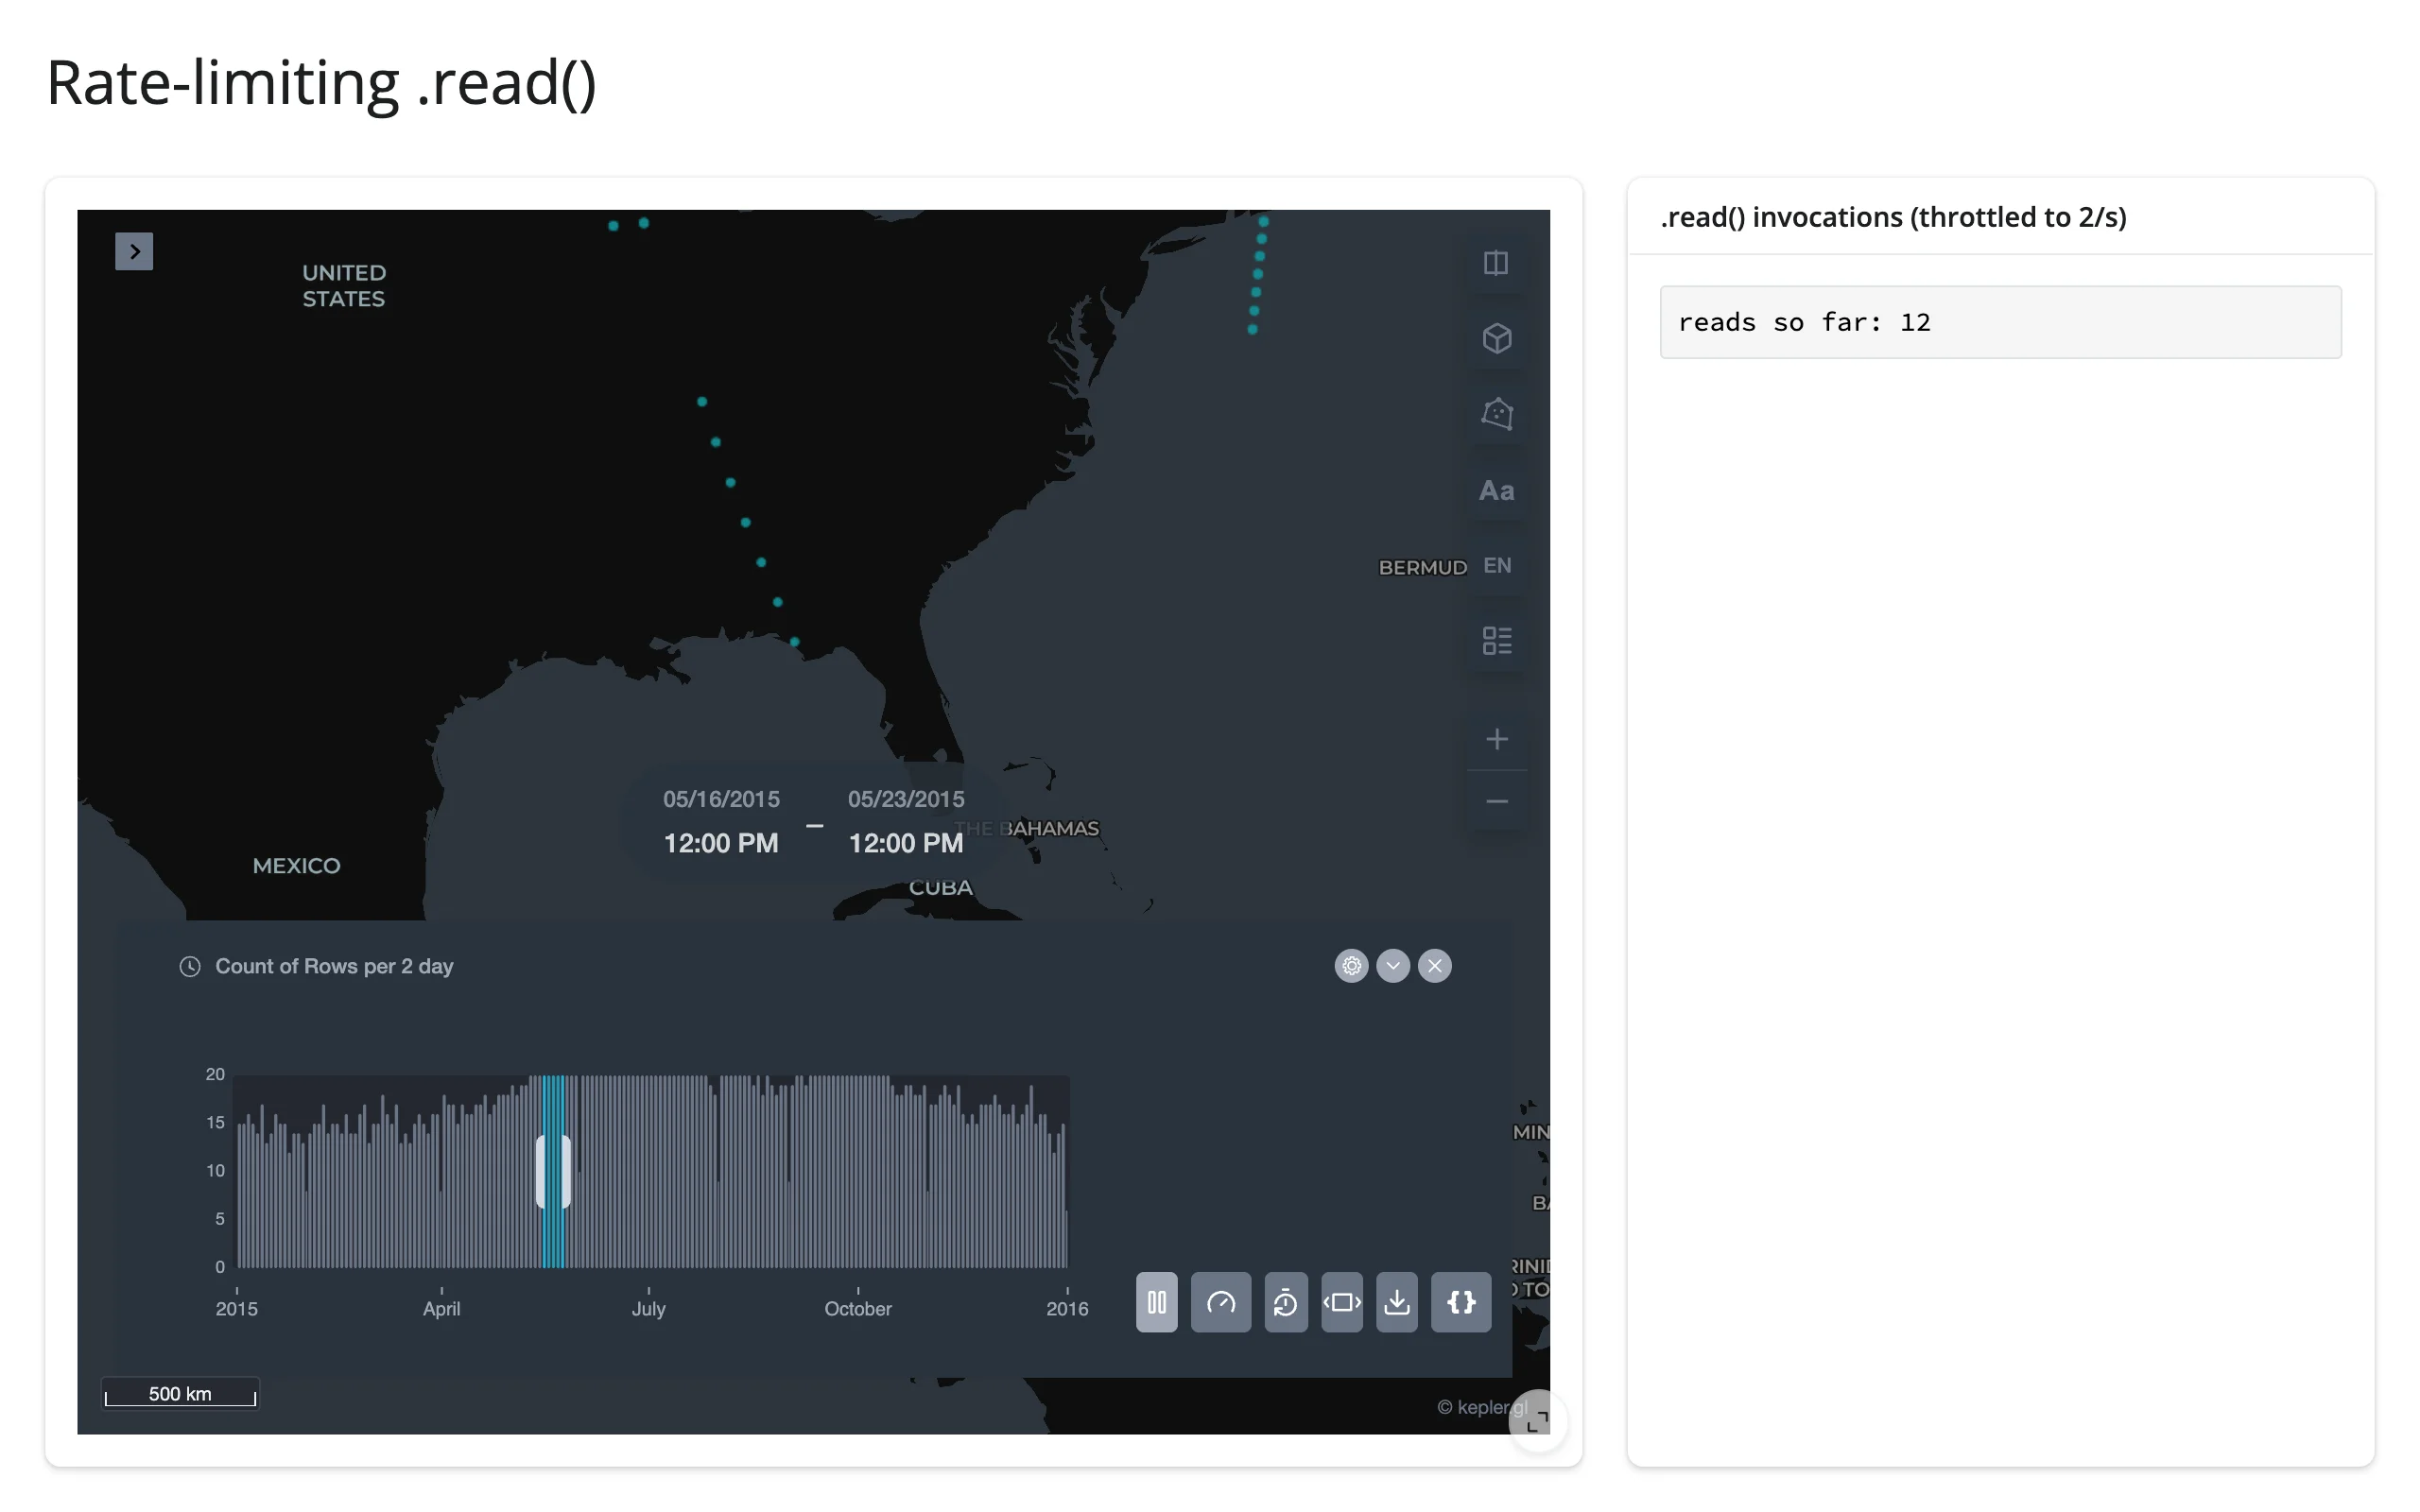
Reach for a rate policy whenever a downstream calculation driven by map.read("config") is non-trivial (a DataFrame filter, a database query, another render) and the map has a time filter, or when users are likely to drag the map around a lot. For a cheap read like the mapState printout above, the default (no limit) is fine.
Updating the widget from Python
Every newly rendered KeplerGl widget ships kepler.gl’s full JavaScript bundle again – measured at 12.9 MB for the initial comm_open message. Re-returning a new value from the render function (even an unchanged one) re-renders the widget and re-sends that bundle, and it also discards any layers, colors, or filters the user built in kepler’s side panel, since those live only in the old (now-replaced) widget instance.
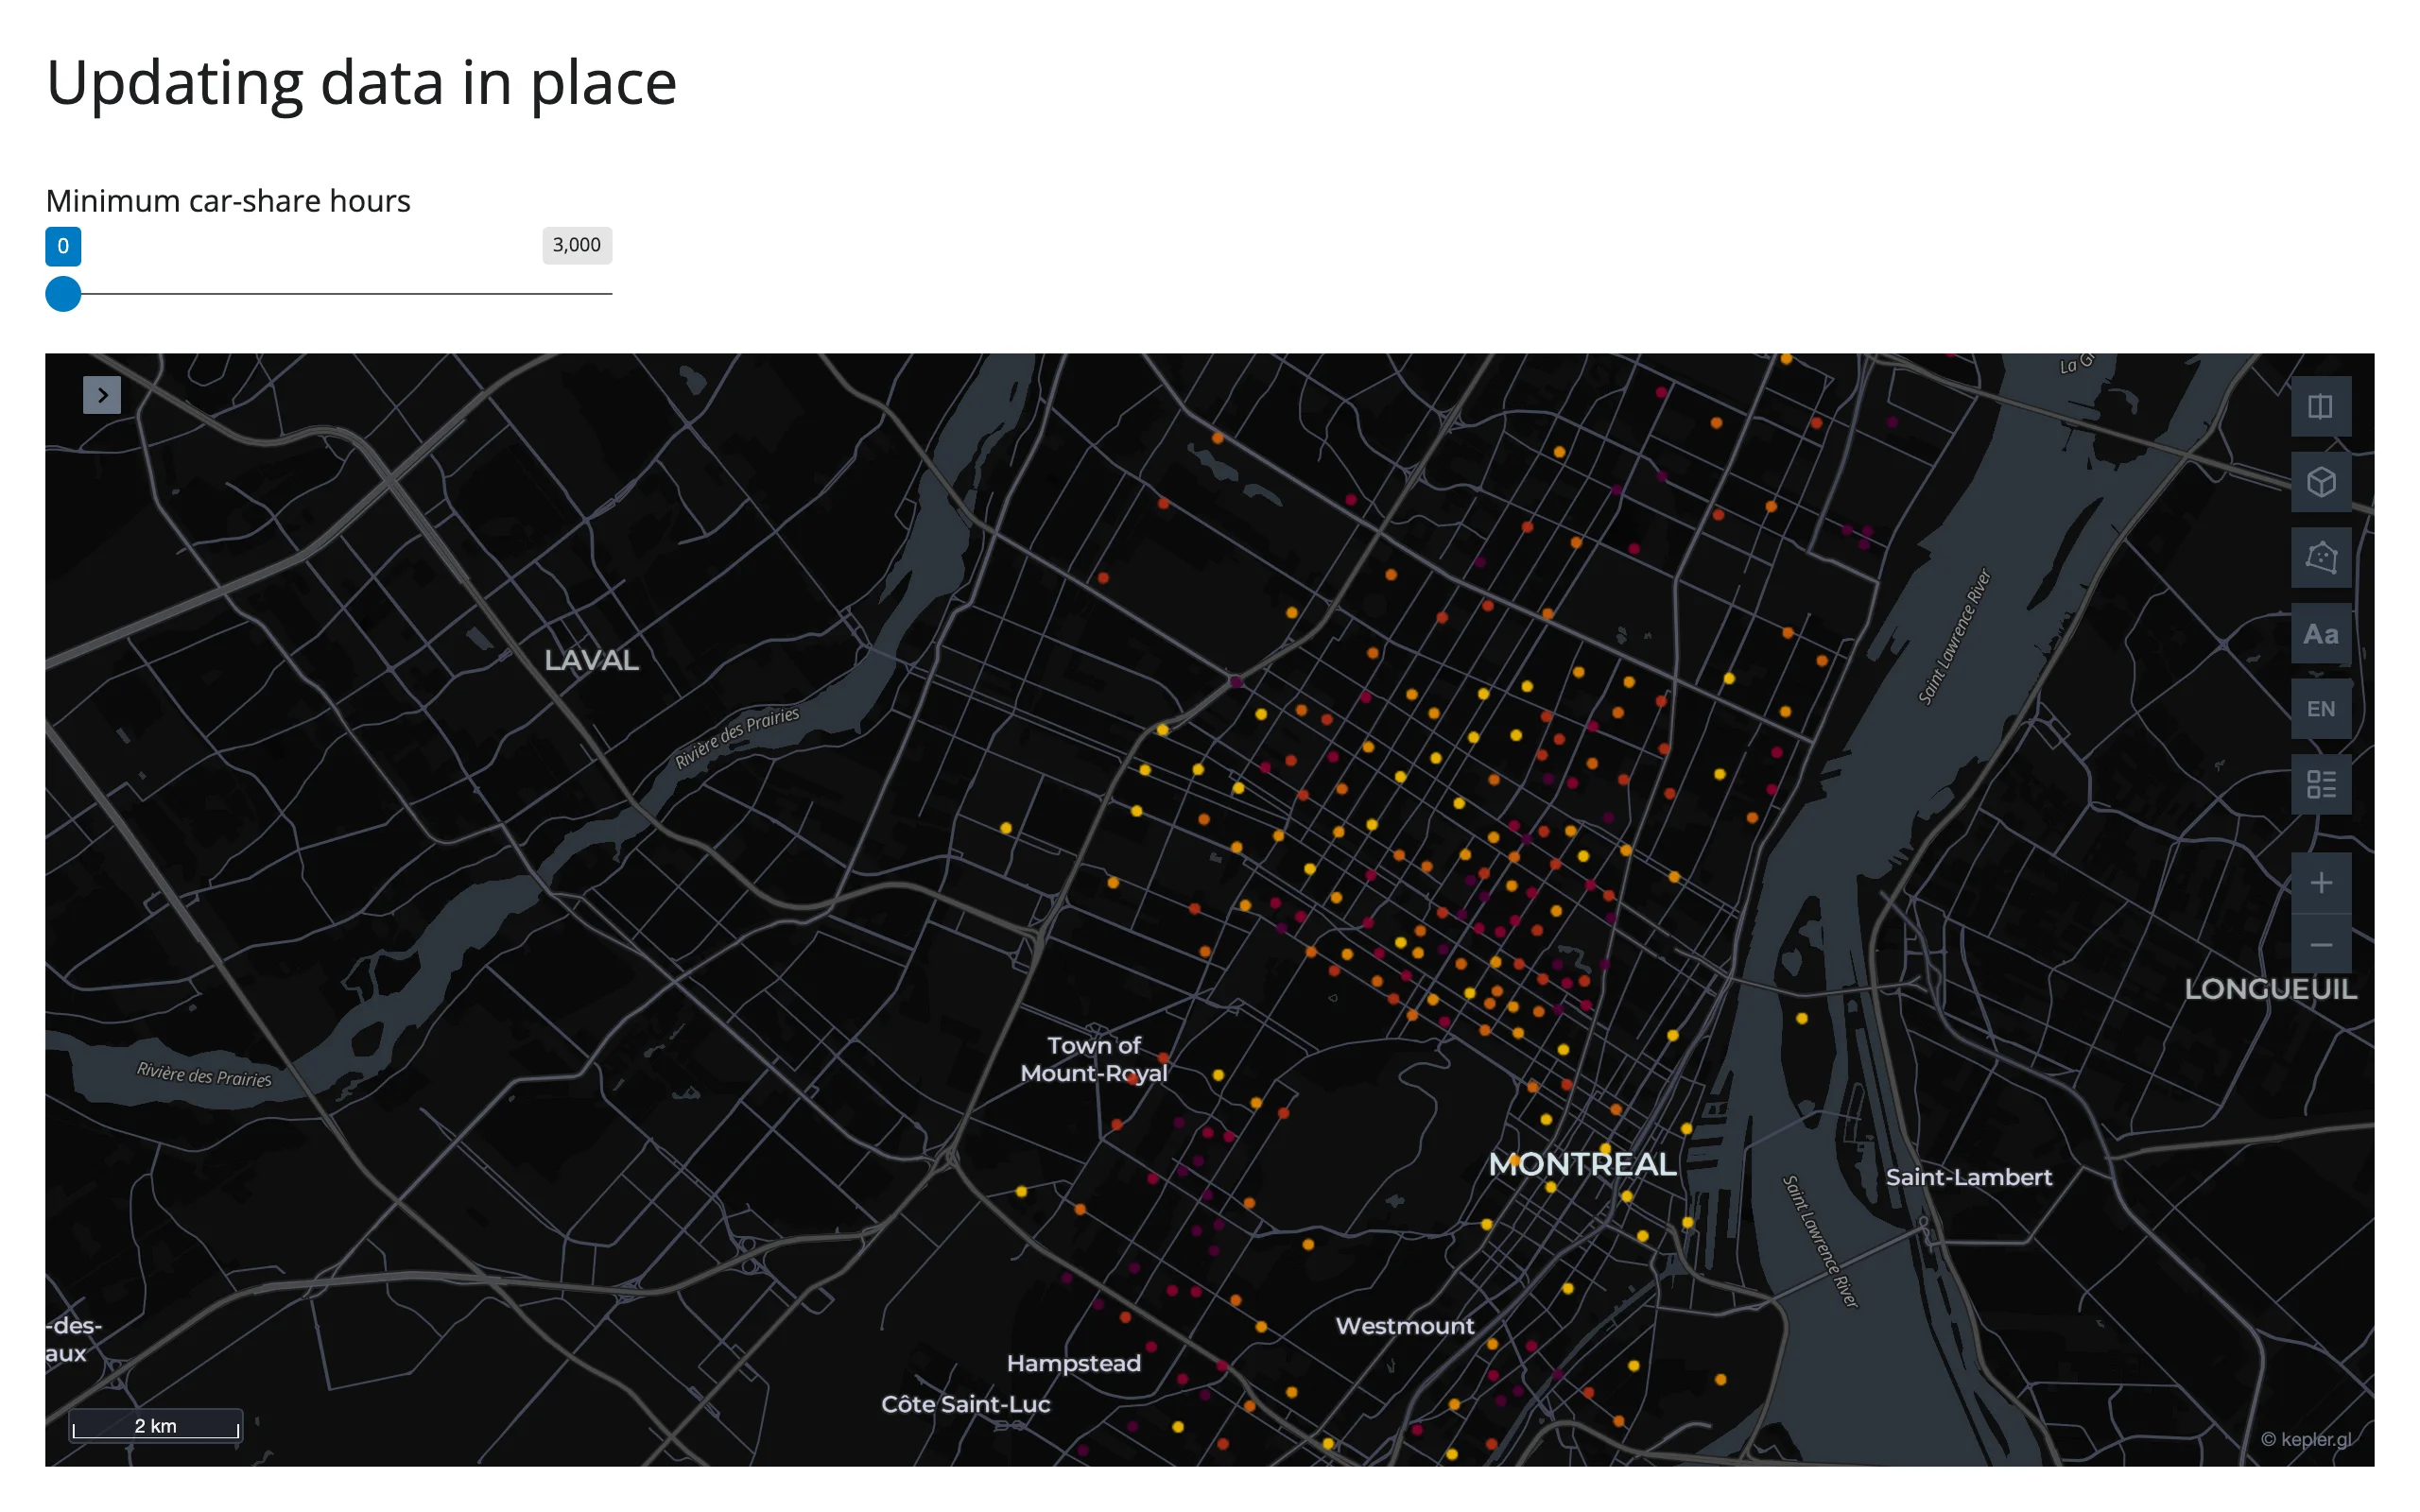
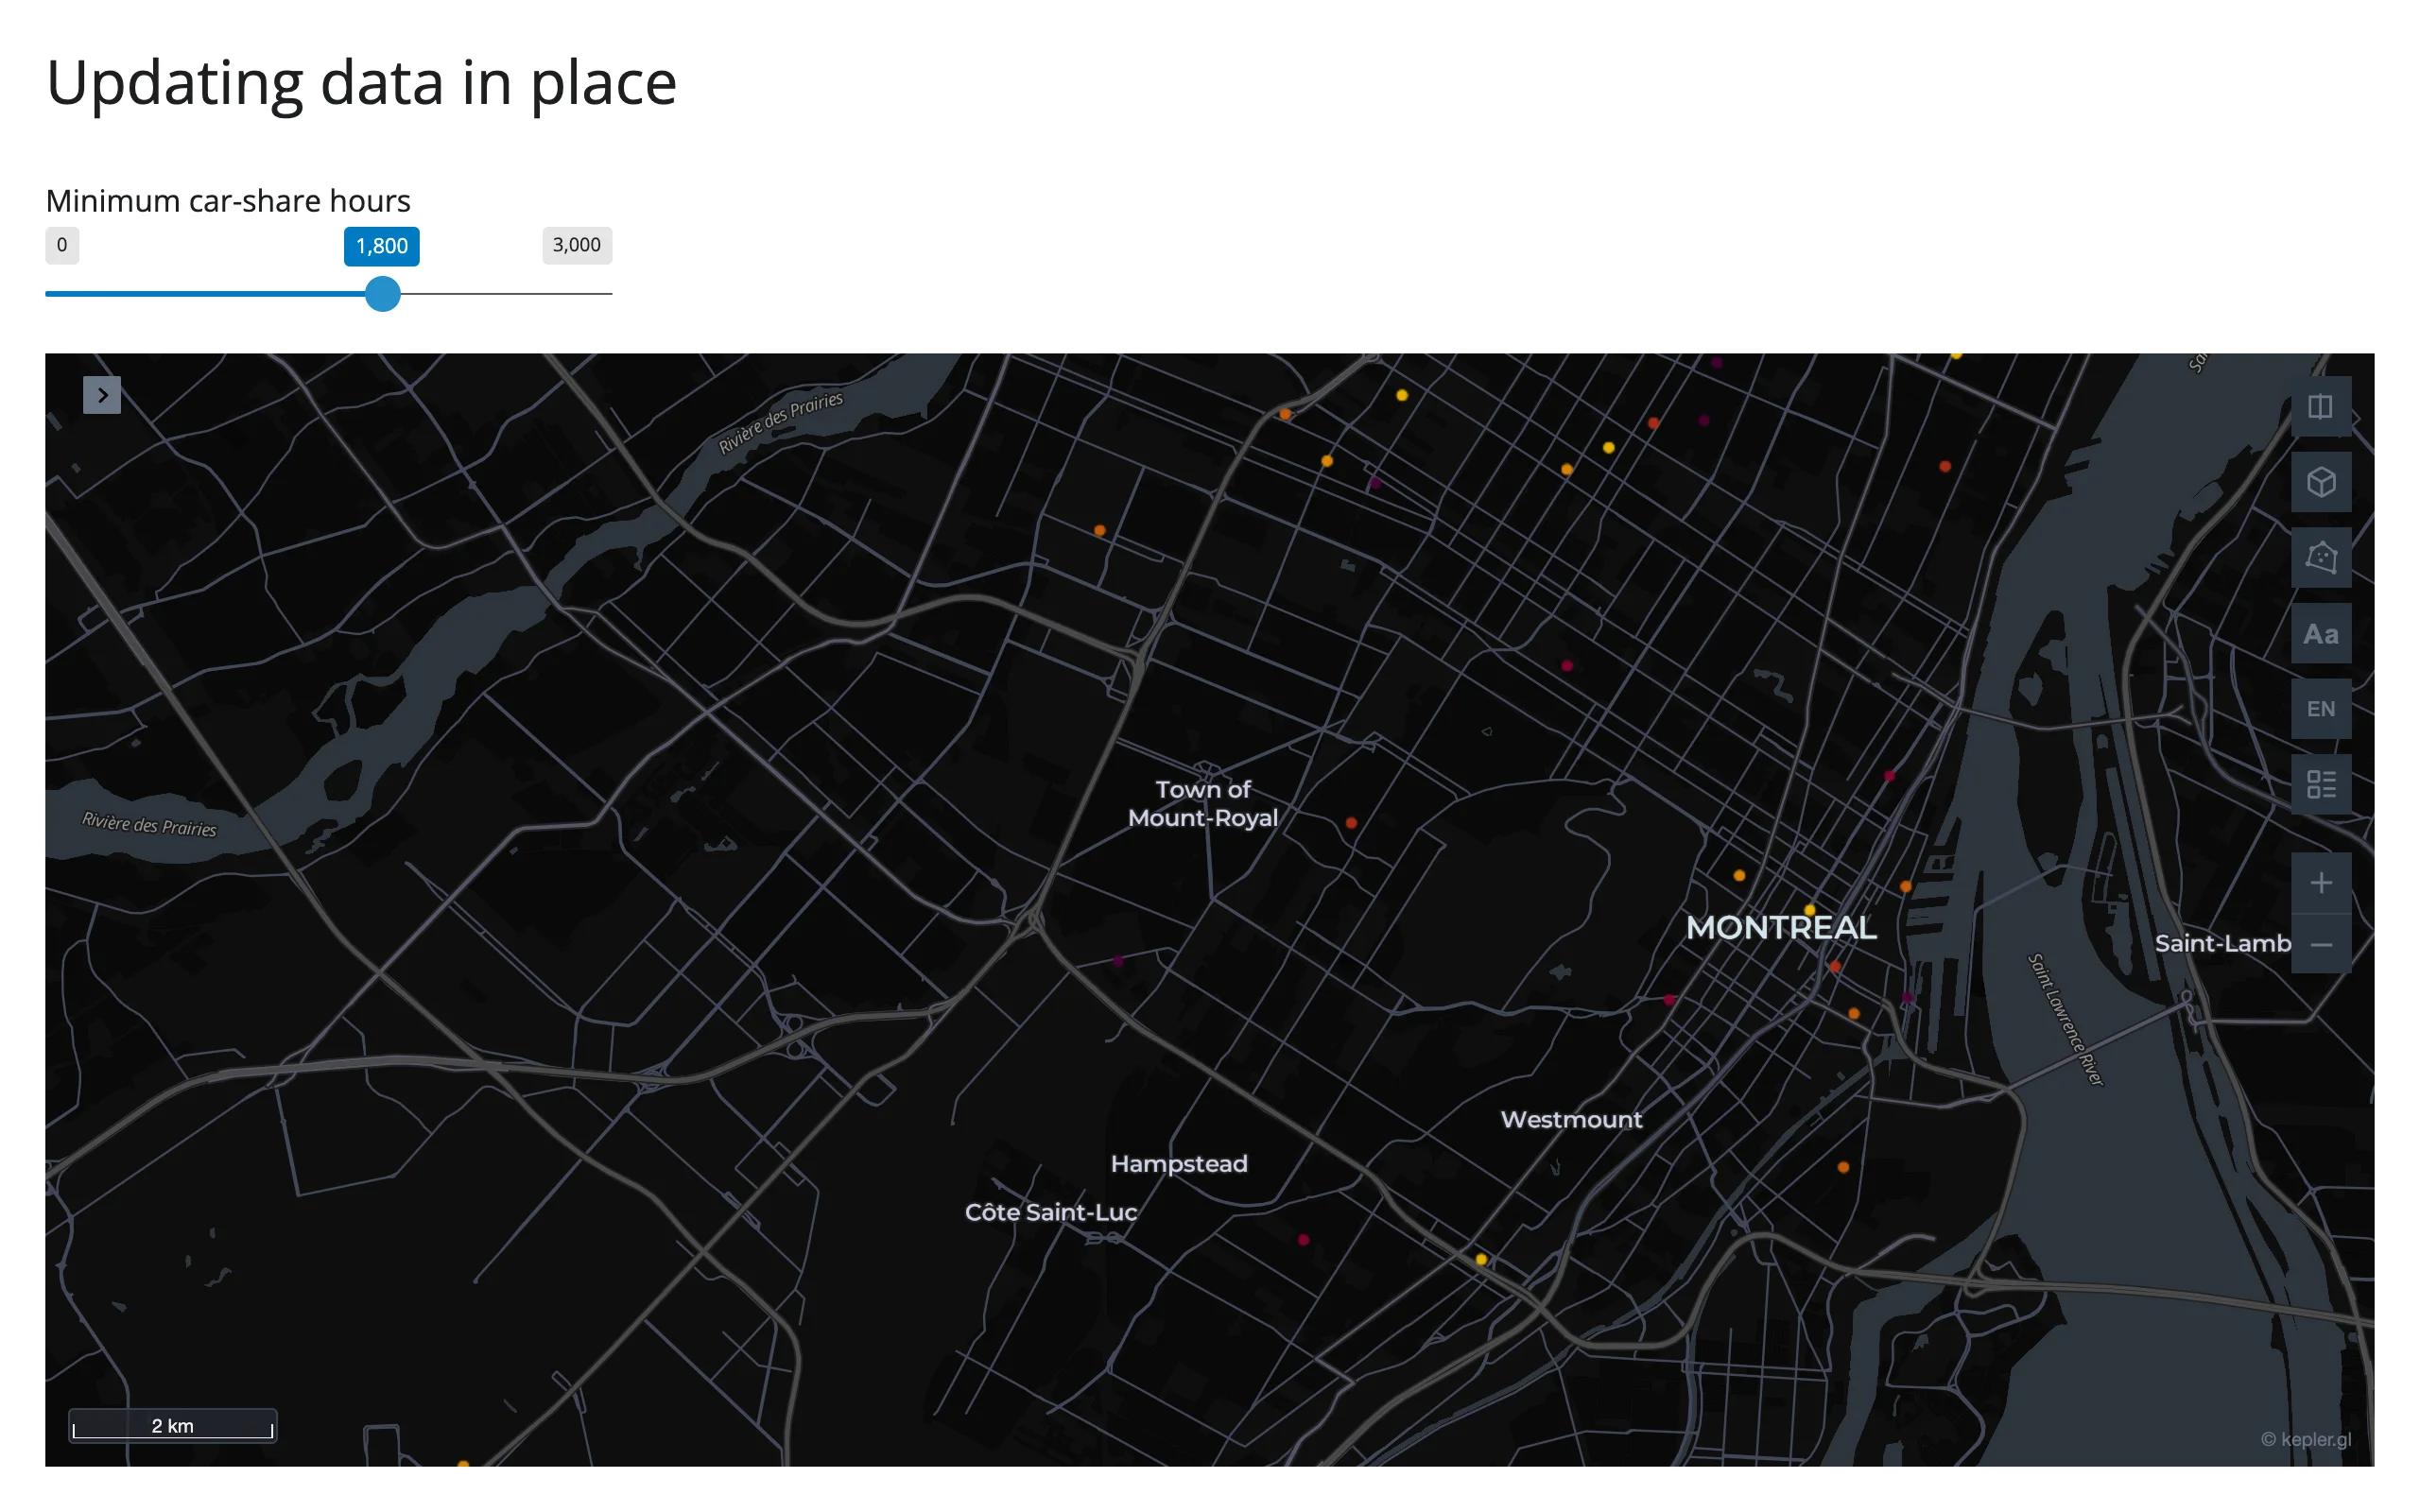
Updating .widget.data in place avoids both costs: it sends only the new rows (measured at 8.6 KB for a slider-driven update to the example below, about 1,500x smaller), keeps the same widget mounted in the browser, and preserves the user’s styling, layers, filters, and camera position.
import plotly.express as px
from shiny import reactive
from shiny.express import input, ui
from shinywidgets import render_keplergl

carshare = px.data.carshare().rename(
    columns={"centroid_lat": "lat", "centroid_lon": "lon"}
)

ui.page_opts(title="Updating data in place", fillable=True)
ui.input_slider("min_hours", "Minimum car-share hours", 0, 3000, 0, step=100)


def filtered():
    return carshare[carshare["car_hours"] >= input.min_hours()]


@render_keplergl
def map():
    # Read the input under isolate(): this render function only runs once
    # (on first display). The effect below keeps the data current.
    with reactive.isolate():
        return filtered()


@reactive.effect
@reactive.event(input.min_hours)
def _():
    # Swapping `.widget.data` in place sends only the new rows (kilobytes),
    # keeps the map mounted, and preserves any layer/filter/camera changes
    # the user made in kepler's side panel. Re-returning a new value from
    # `map()` instead would re-send kepler's ~13 MB bundle and reset the UI.
    map.widget.data = {"data": filtered()}
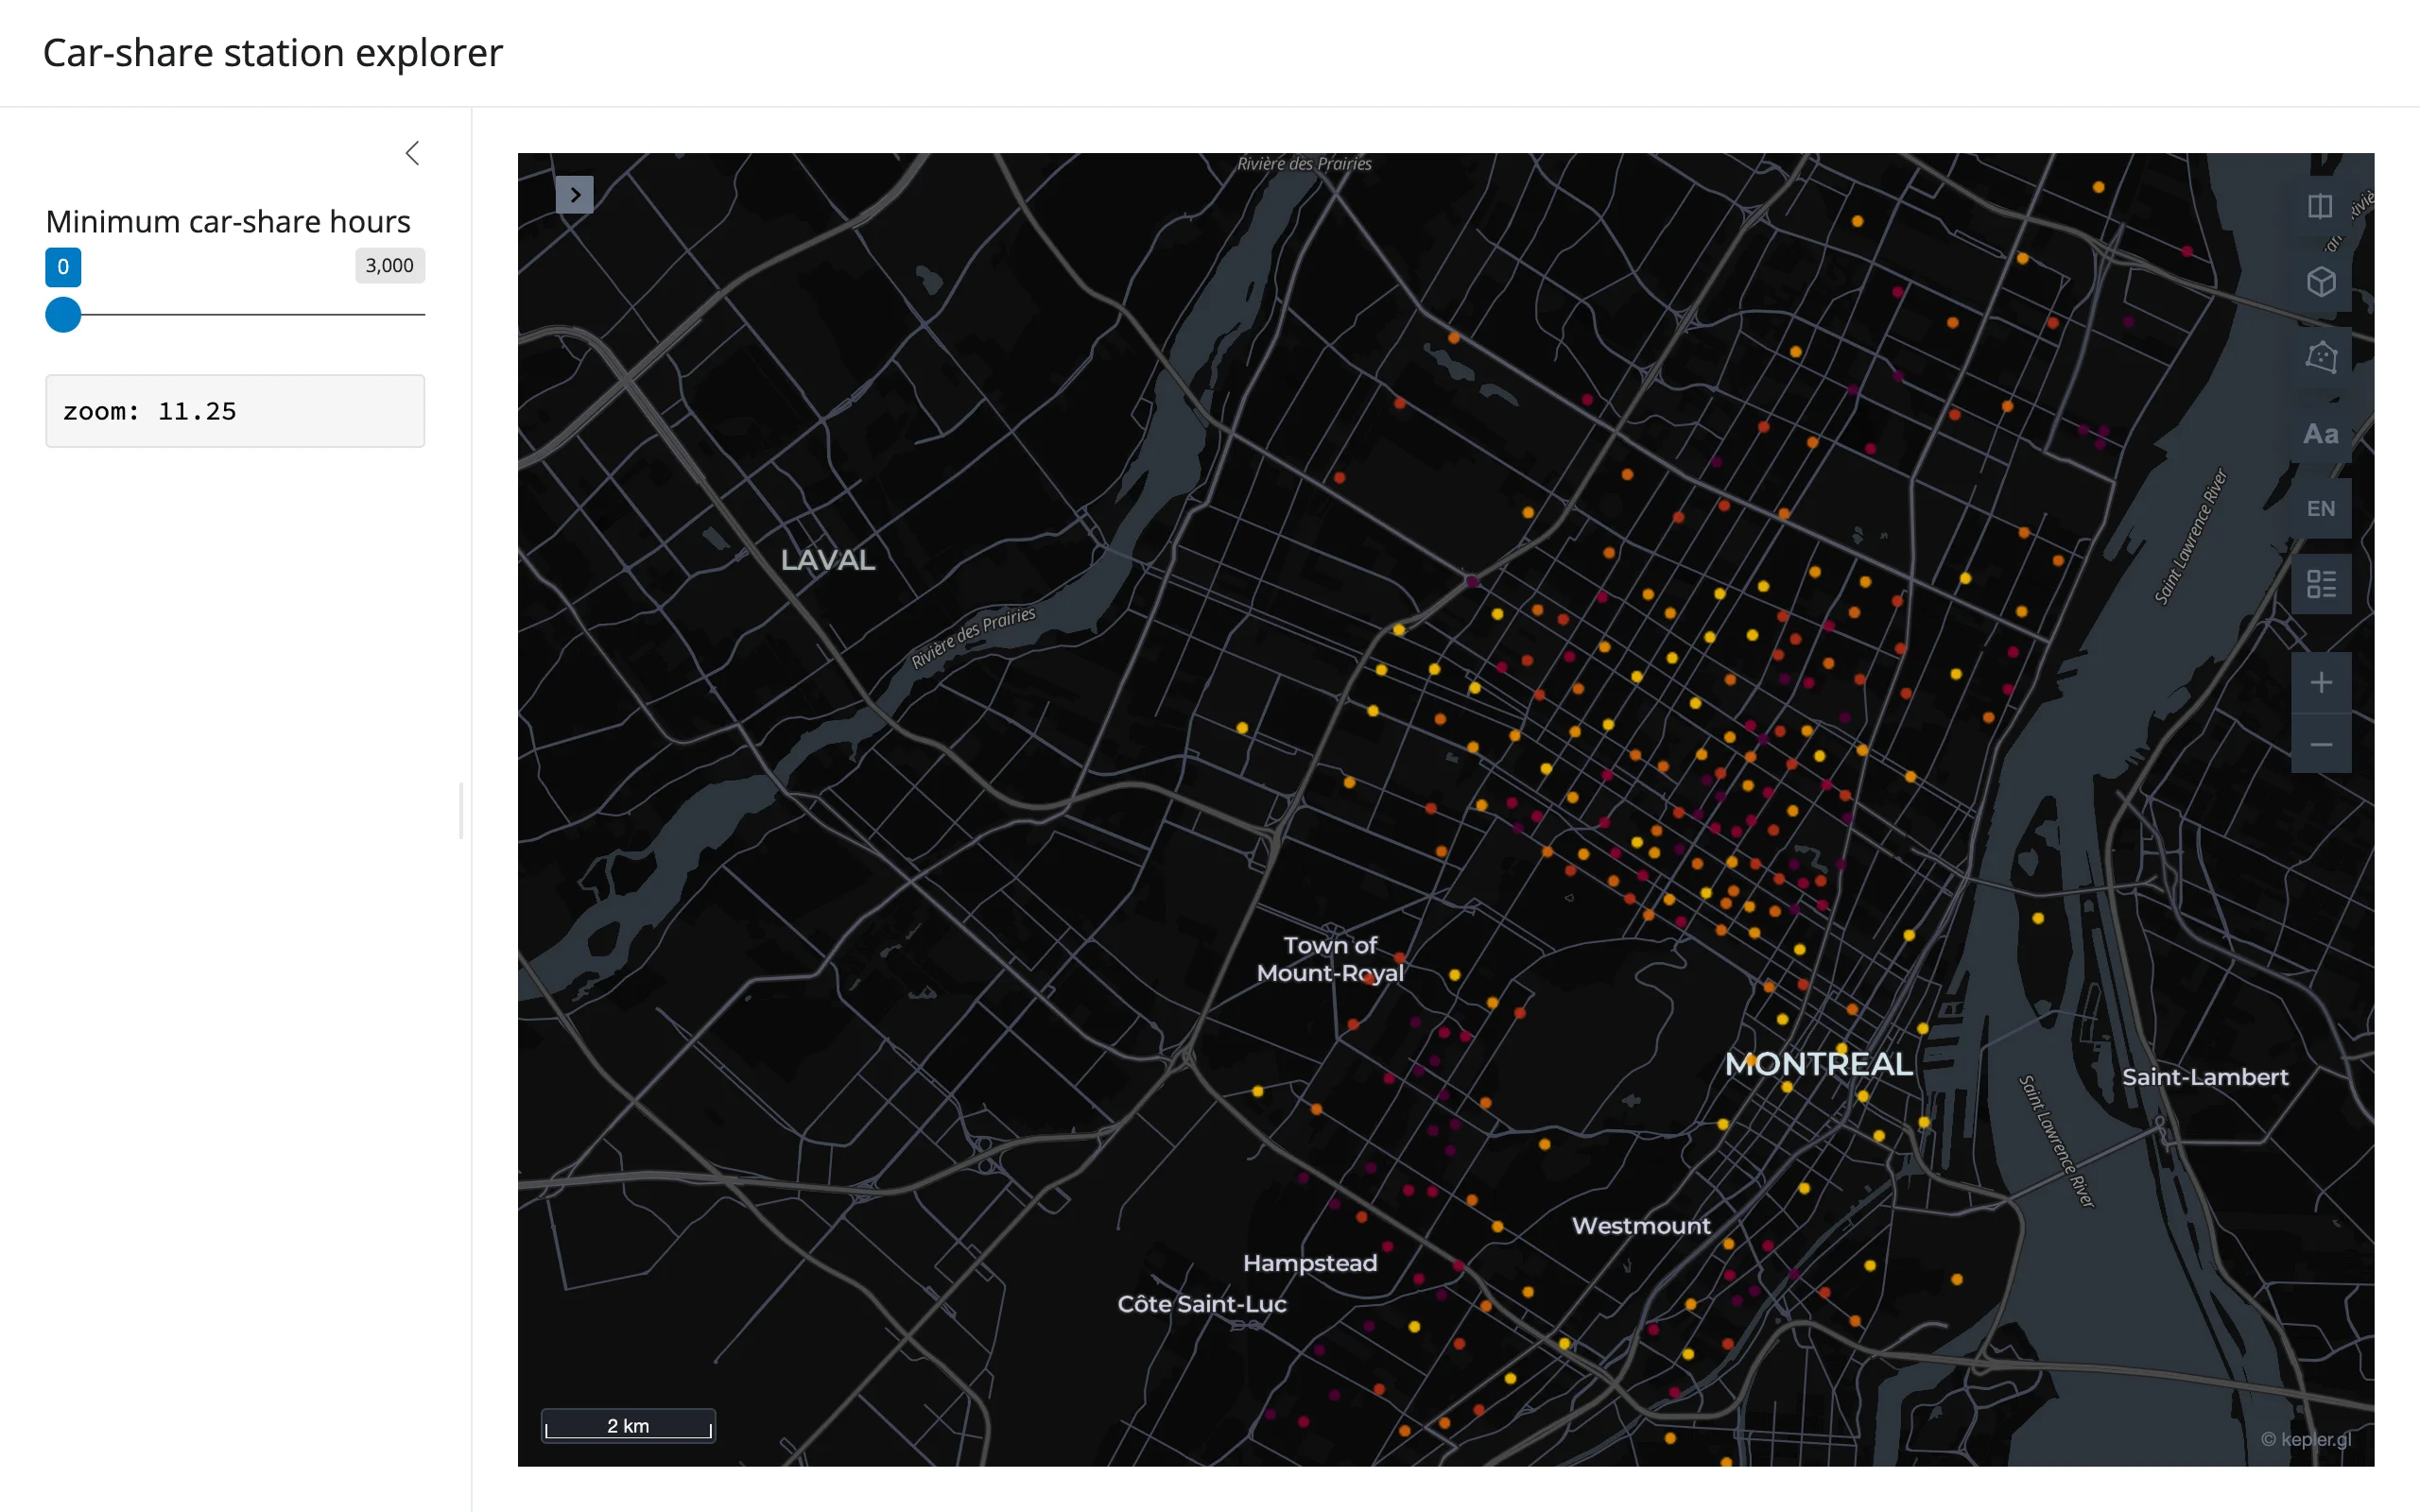
Before / after moving the slider to 1,800 (same zoom, same basemap position – only the points change):
Use in-place updates for anything driven by a Shiny input (filters, a different dataset slice, a live feed). Re-render only when the number or identity of datasets changes in a way that’s easier to express as a fresh KeplerGl(...) call than as a .data = / .add_data() update, or when you want to deliberately reset the user’s styling.
Coordinating multiple views
Save a styled view, restore it later
Because the entire authored state – camera, layers, colors, filters – lives in one config dict, map.read("config") is a complete, serializable snapshot of whatever a user built. Store it, and .widget.config = saved reproduces it exactly, including on a widget that has since been reset or moved elsewhere:
import plotly.express as px
from keplergl import KeplerGl
from shiny import reactive
from shiny.express import input, render, ui
from shinywidgets import render_keplergl

carshare = px.data.carshare().rename(
    columns={"centroid_lat": "lat", "centroid_lon": "lon"}
)
DEFAULT_CONFIG = {
    "version": "v1",
    "config": {"mapState": {"latitude": 45.53, "longitude": -73.6, "zoom": 10}},
}

saved_config = reactive.value(None)

ui.page_opts(title="Saving and restoring a view", fillable=True)

with ui.layout_columns(col_widths=[8, 4]):
    with ui.card(full_screen=True):

        @render_keplergl
        def map():
            return KeplerGl(data={"data": carshare}, config=DEFAULT_CONFIG)

    with ui.card():
        ui.input_action_button("save", "Save current view")
        ui.input_action_button("reset", "Reset to default")
        ui.input_action_button("restore", "Restore saved view")

        @render.code
        def saved_view():
            cfg = saved_config.get()
            if cfg is None:
                return "No view saved yet."
            state = cfg.get("config", {}).get("mapState", {})
            return (
                f"saved zoom: {state.get('zoom', 0):.2f}, "
                f"lat: {state.get('latitude', 0):.3f}"
            )


# The whole config -- not just mapState -- round-trips, so this also
# preserves any layers, colors, or filters the user set up in kepler's UI.
@reactive.effect
@reactive.event(input.save)
def _():
    saved_config.set(map.read("config"))


@reactive.effect
@reactive.event(input.reset)
def _():
    map.widget.config = DEFAULT_CONFIG


@reactive.effect
@reactive.event(input.restore)
def _():
    if saved_config.get() is not None:
        map.widget.config = saved_config.get()
Verified end to end: pan the map, save, reset (camera returns to the default), restore (camera returns to exactly the saved position):
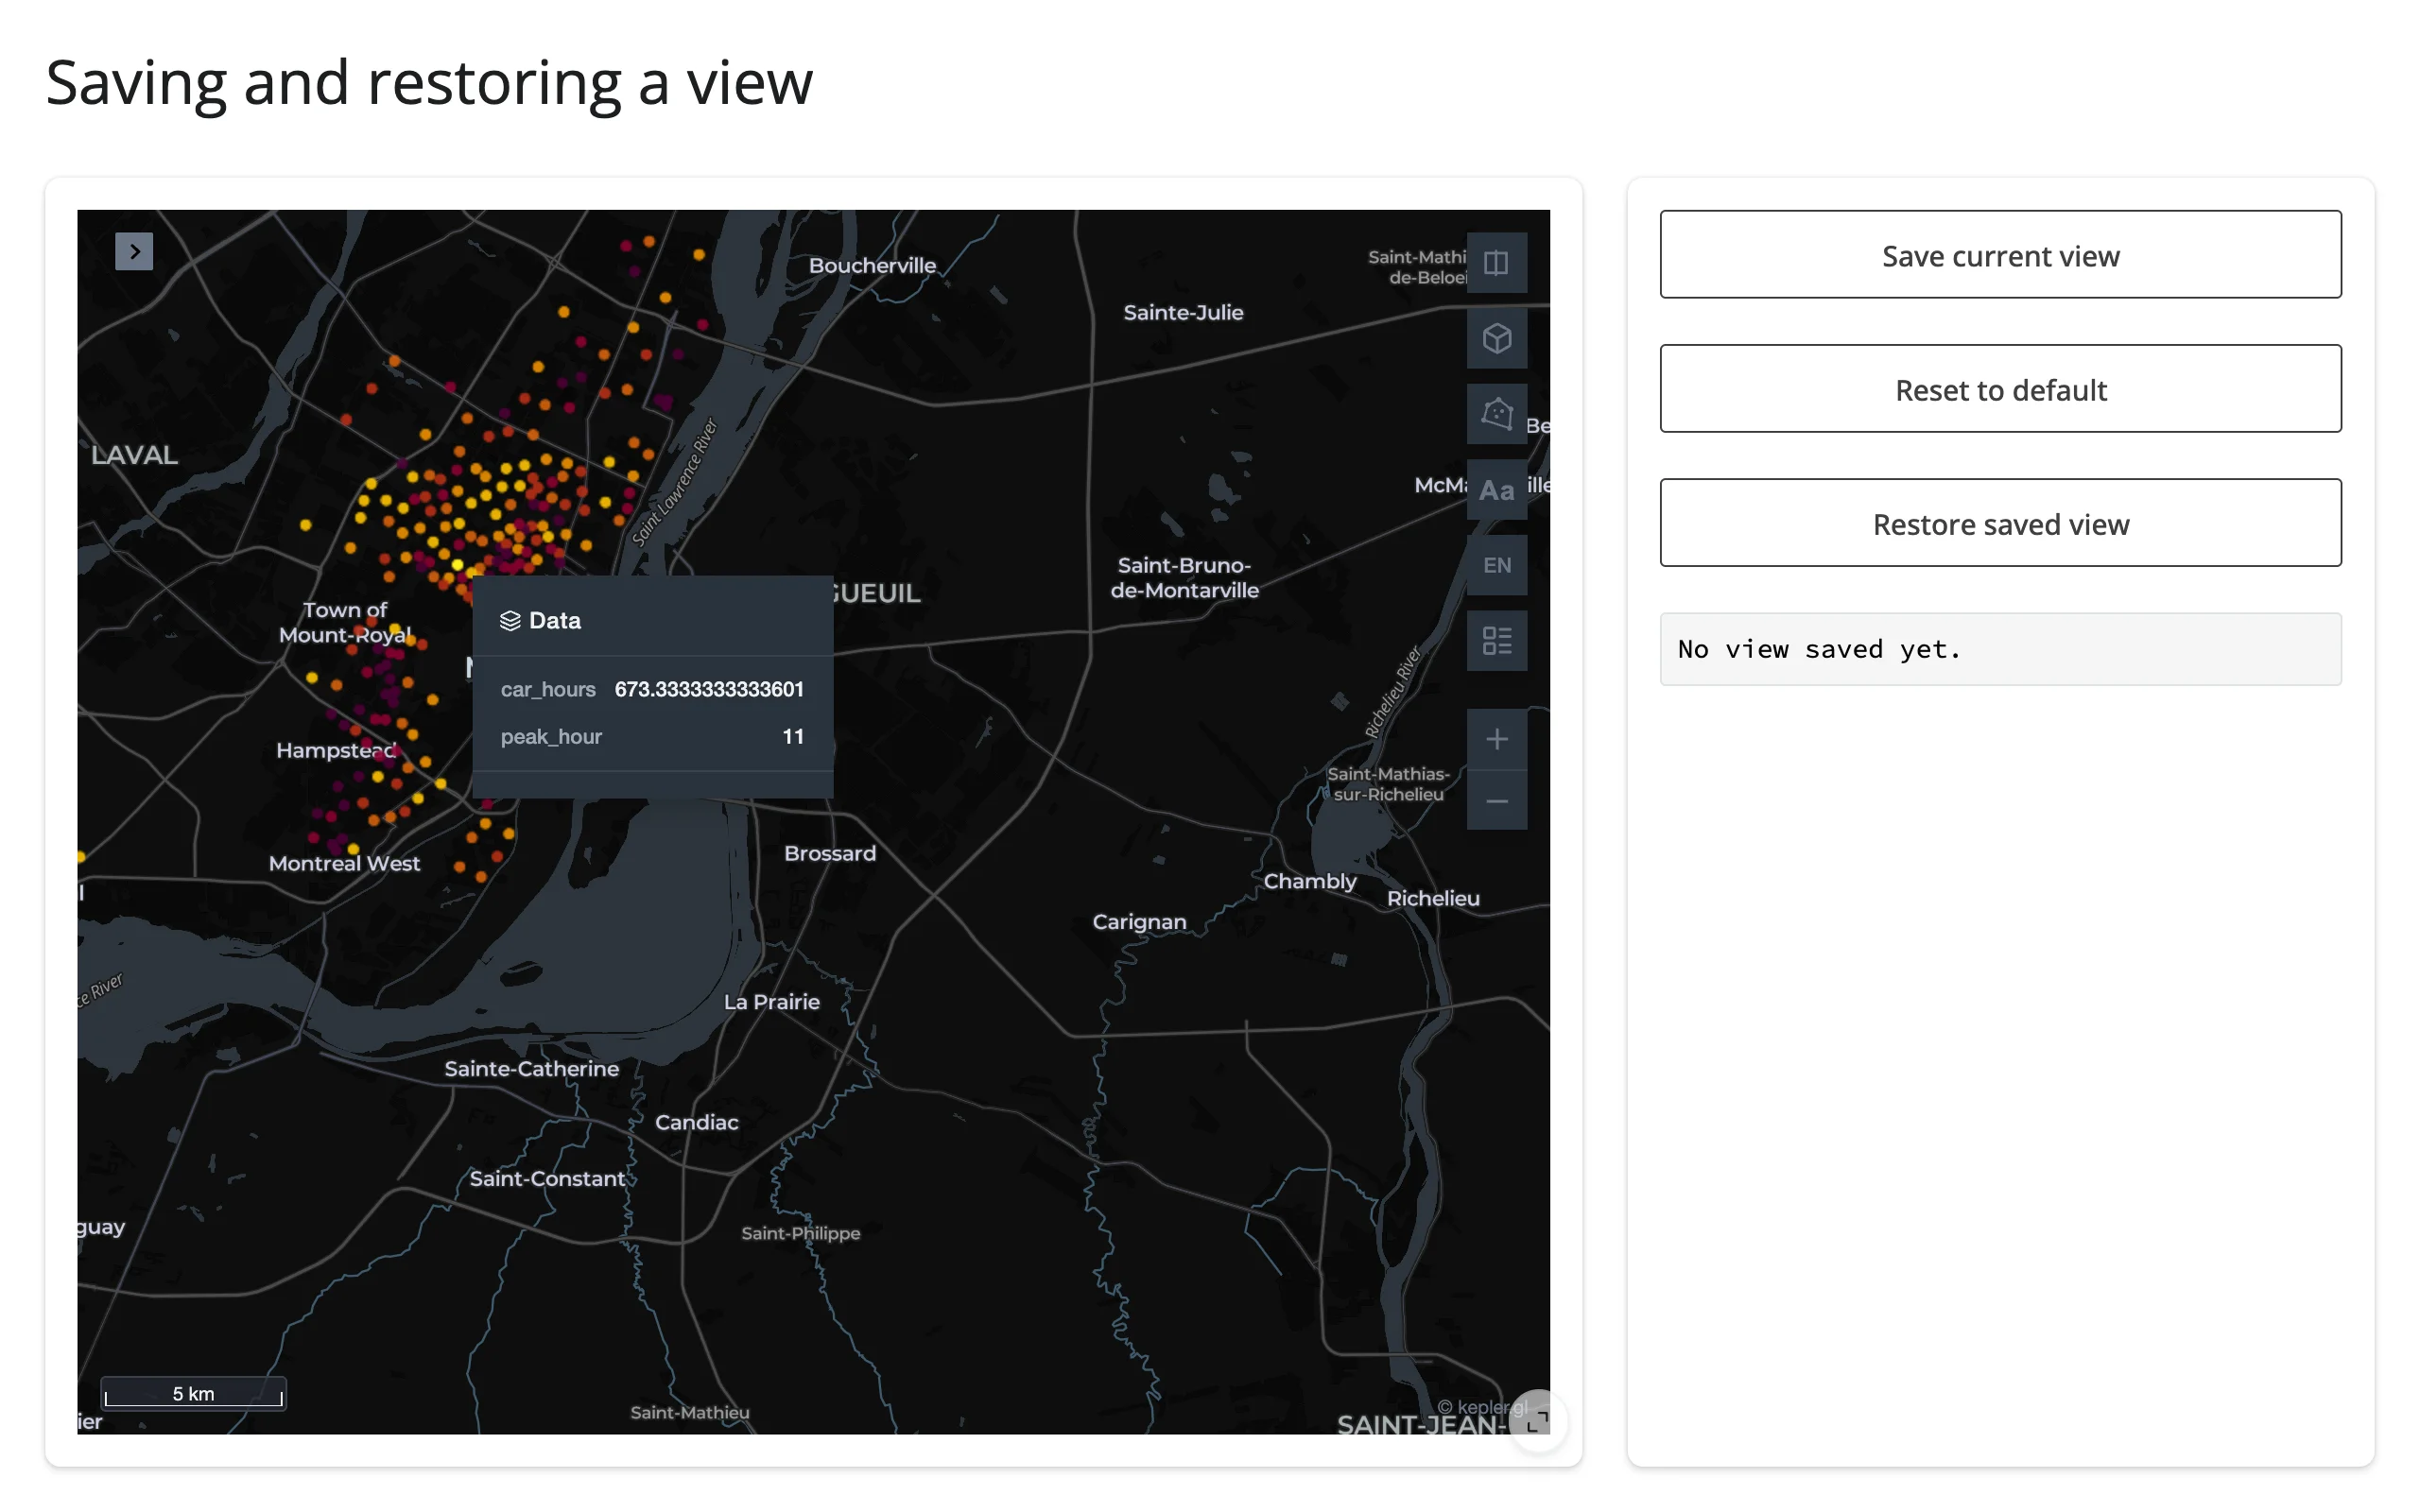
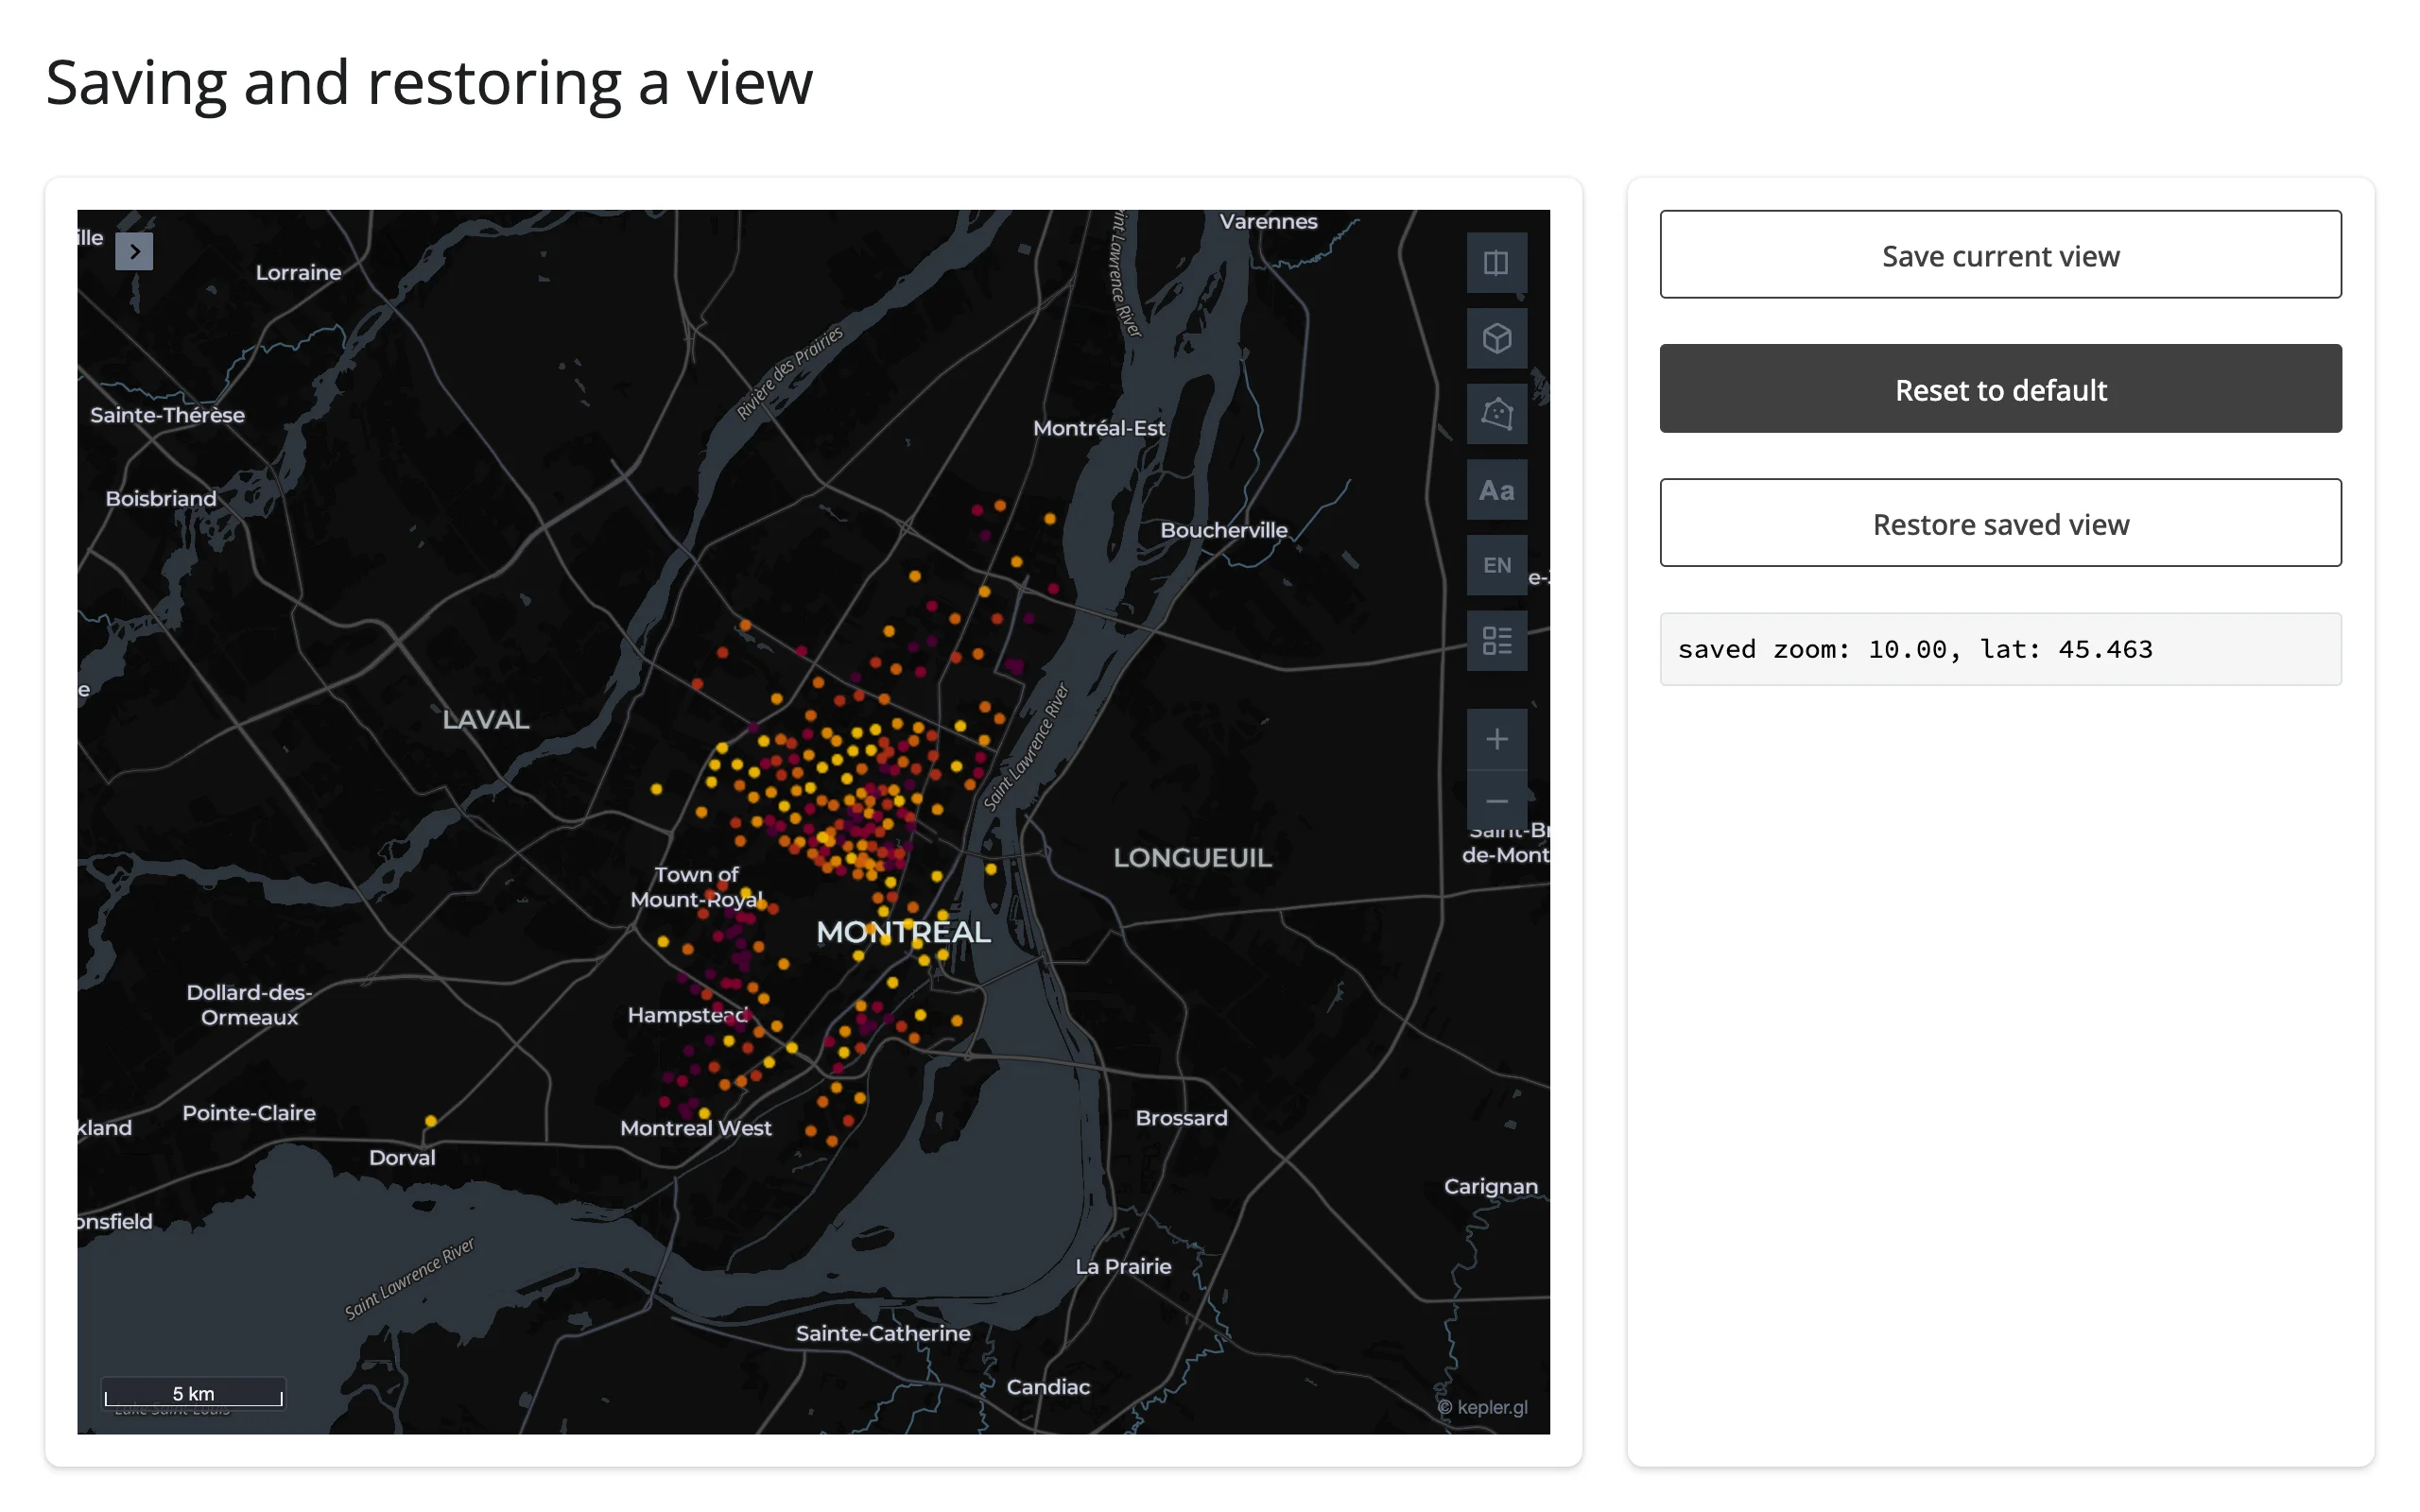
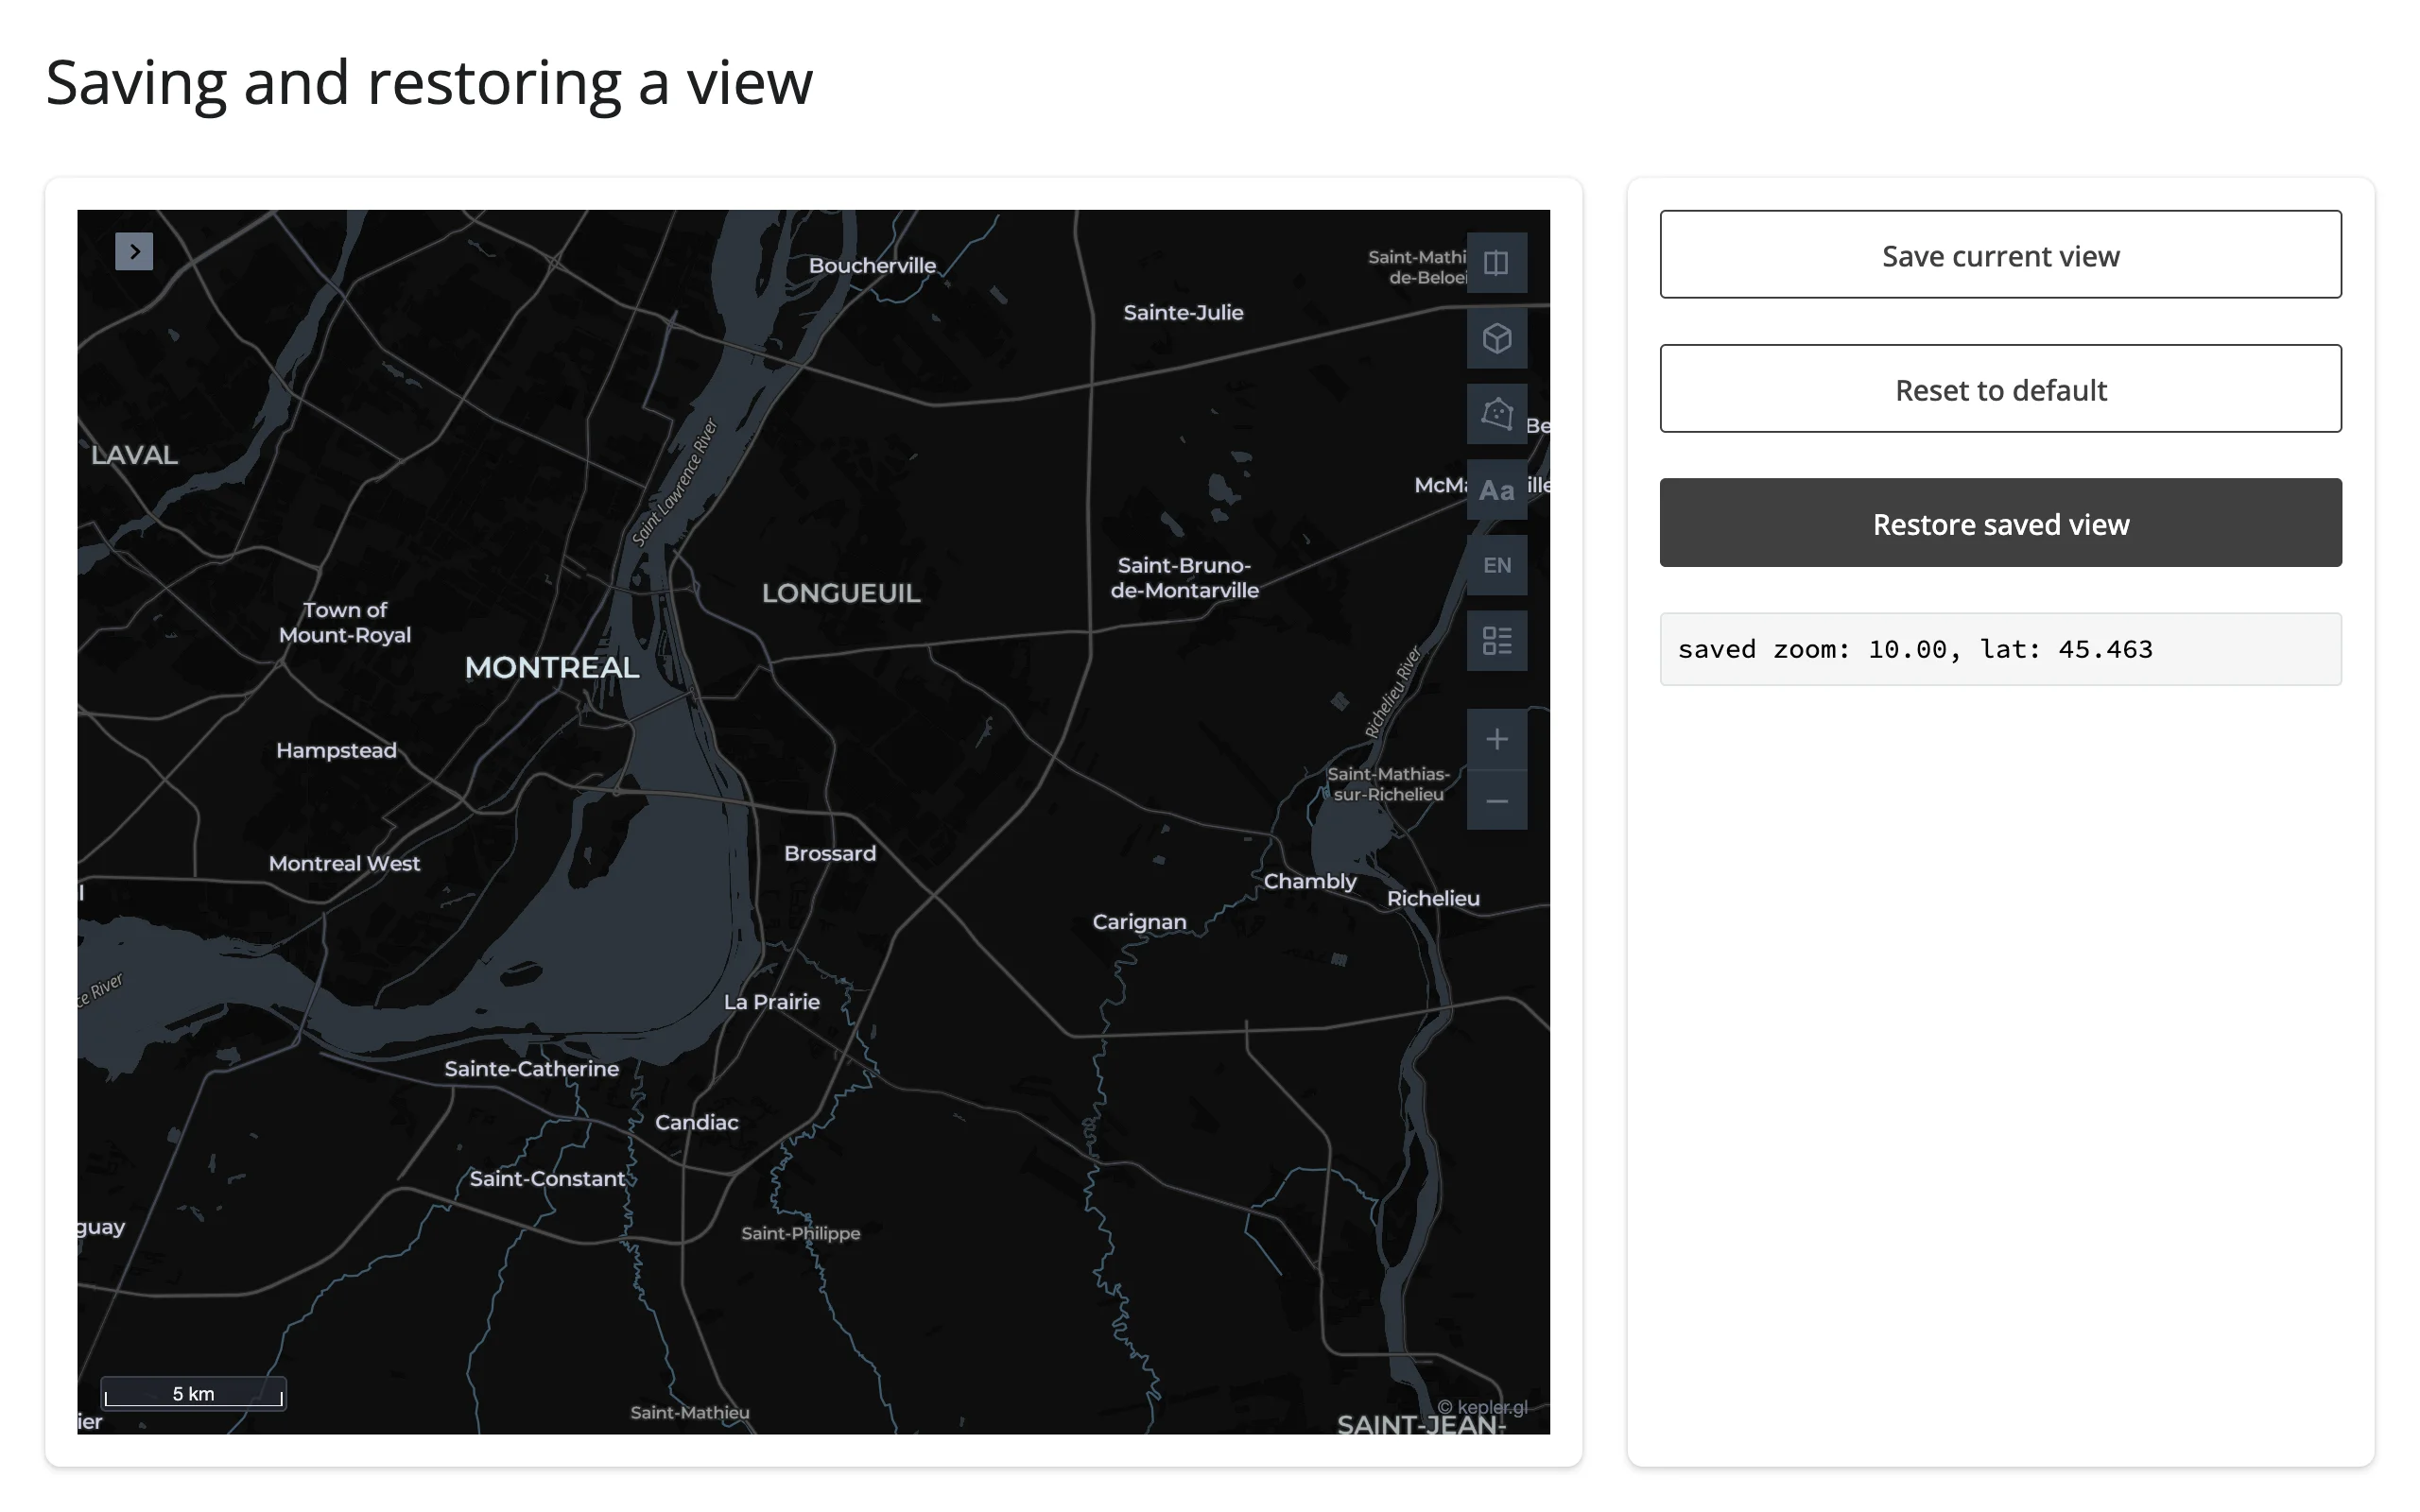
This is the pattern to reach for whenever a user should be able to “save this view” (a bookmark, a report snapshot, a default for next time): persist the dict (it’s plain JSON) anywhere Shiny can read it back – a database row, a file, another user’s session.
Time window drives a detail table
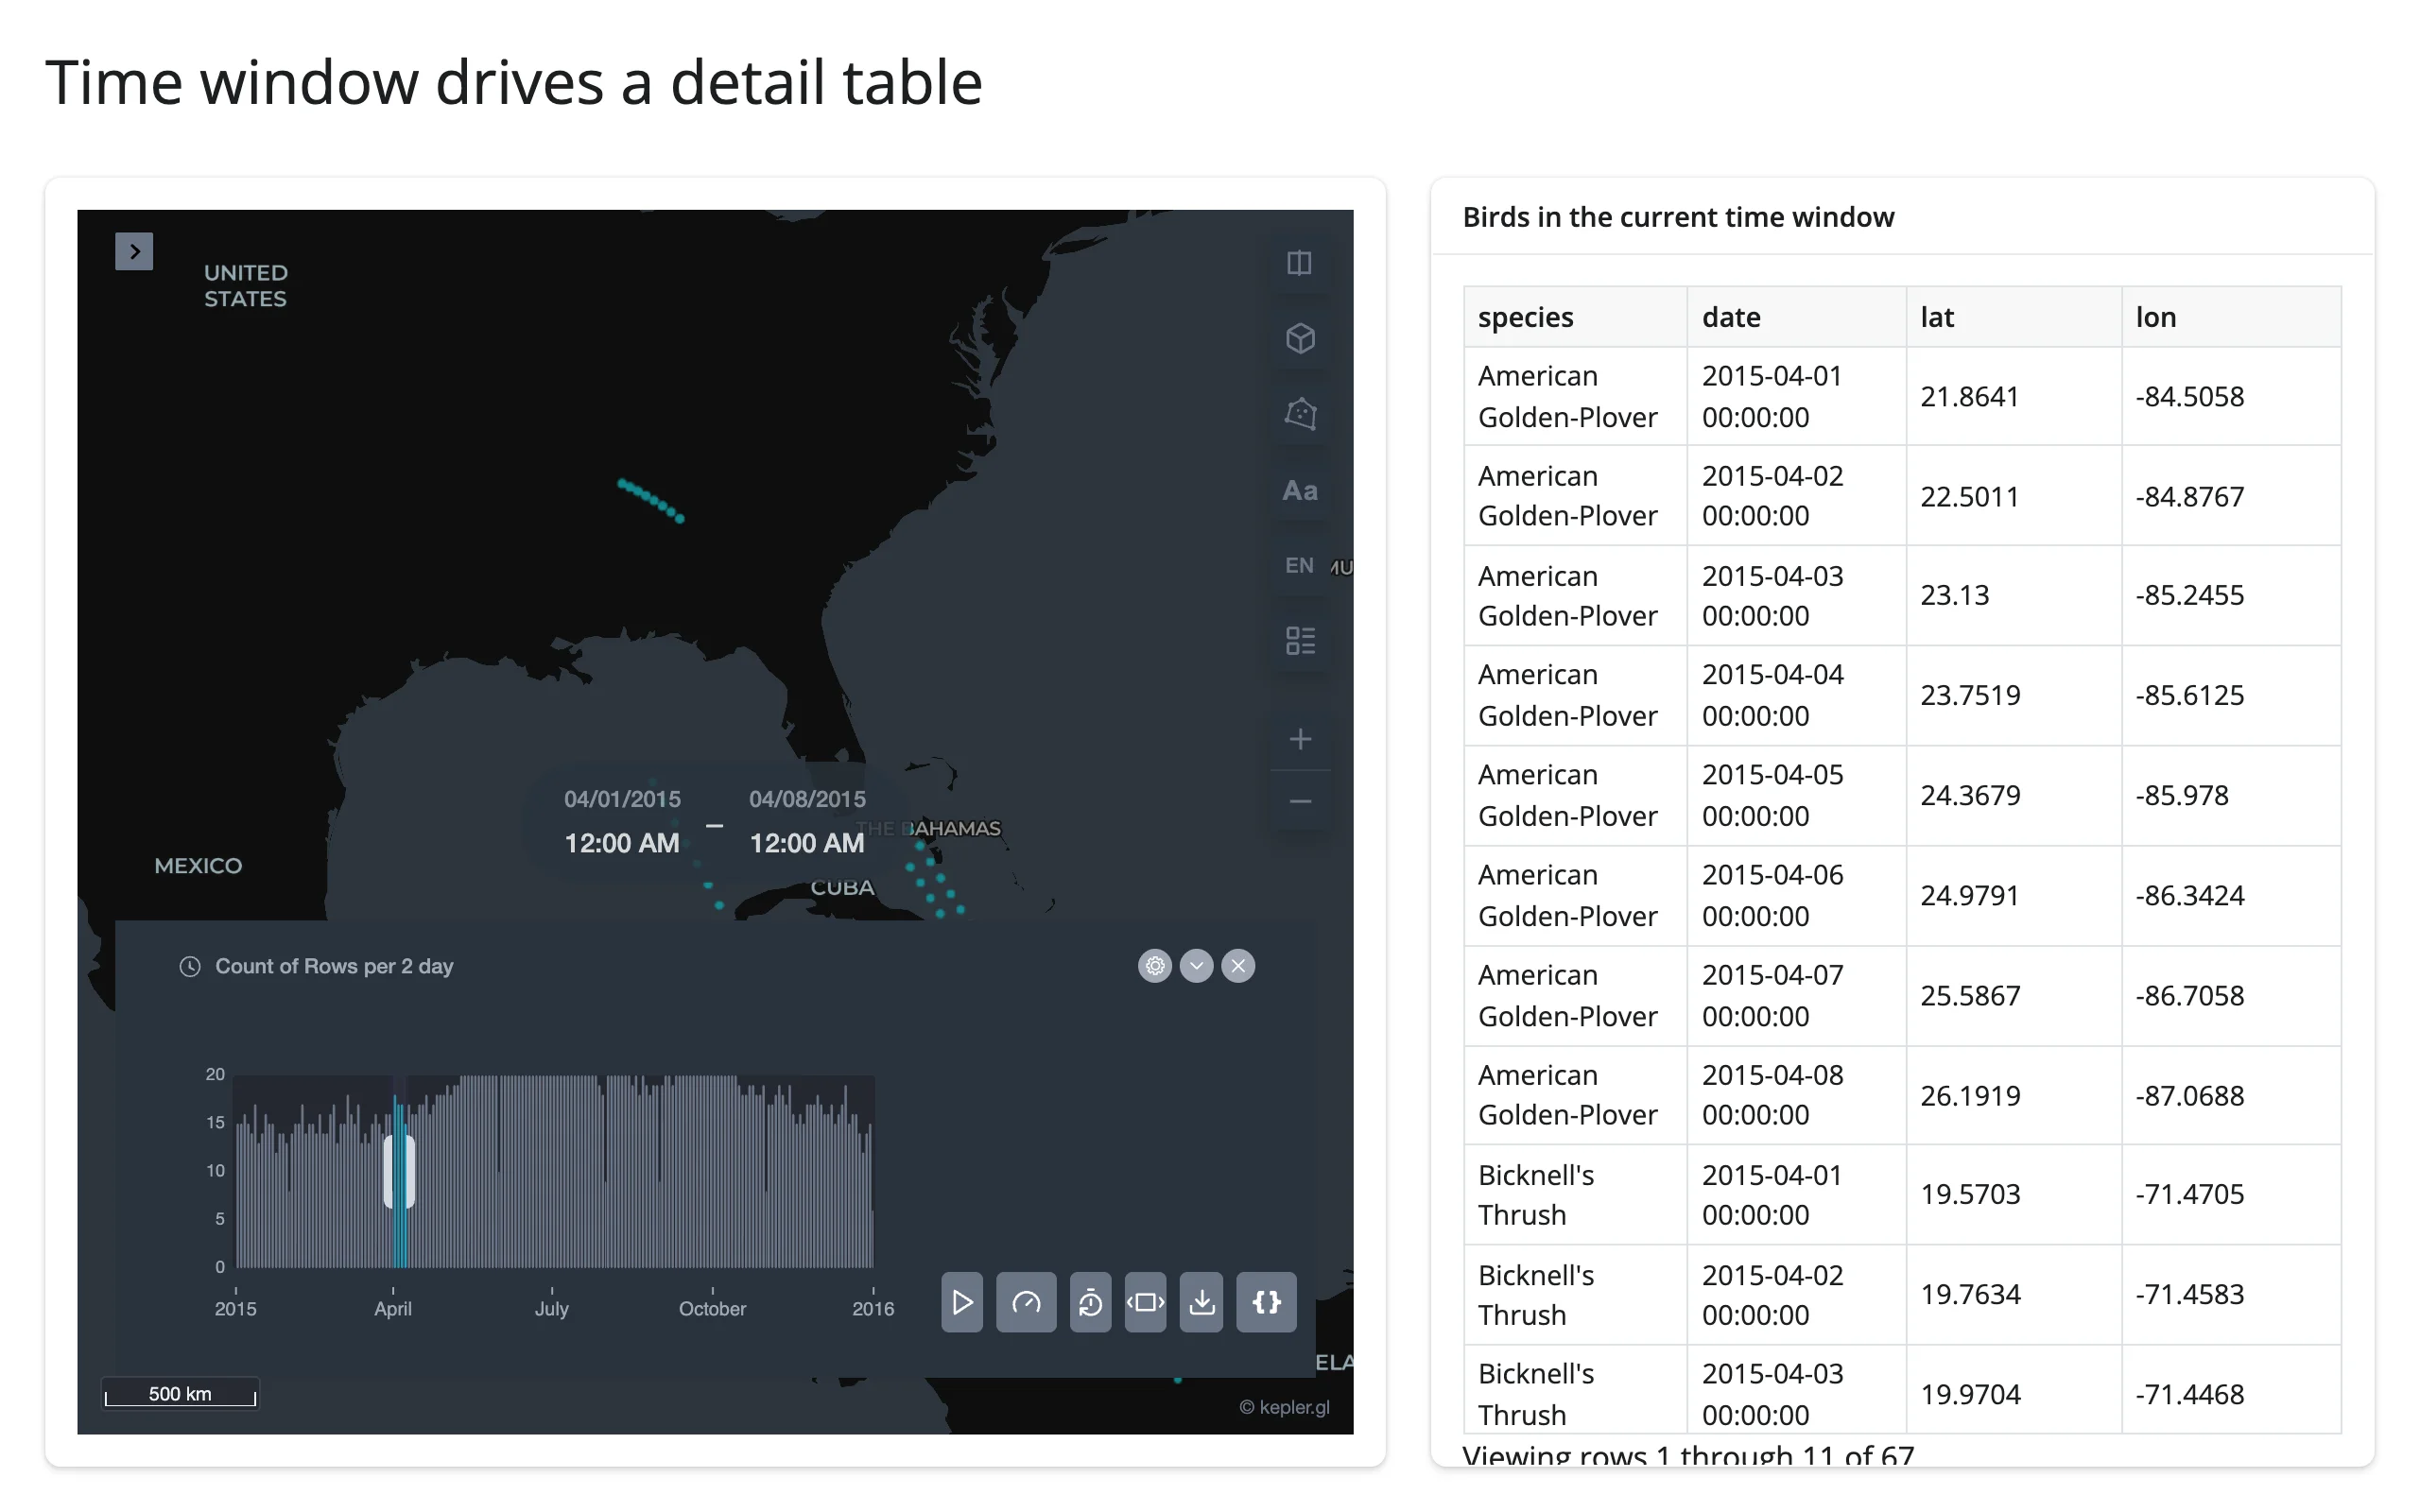
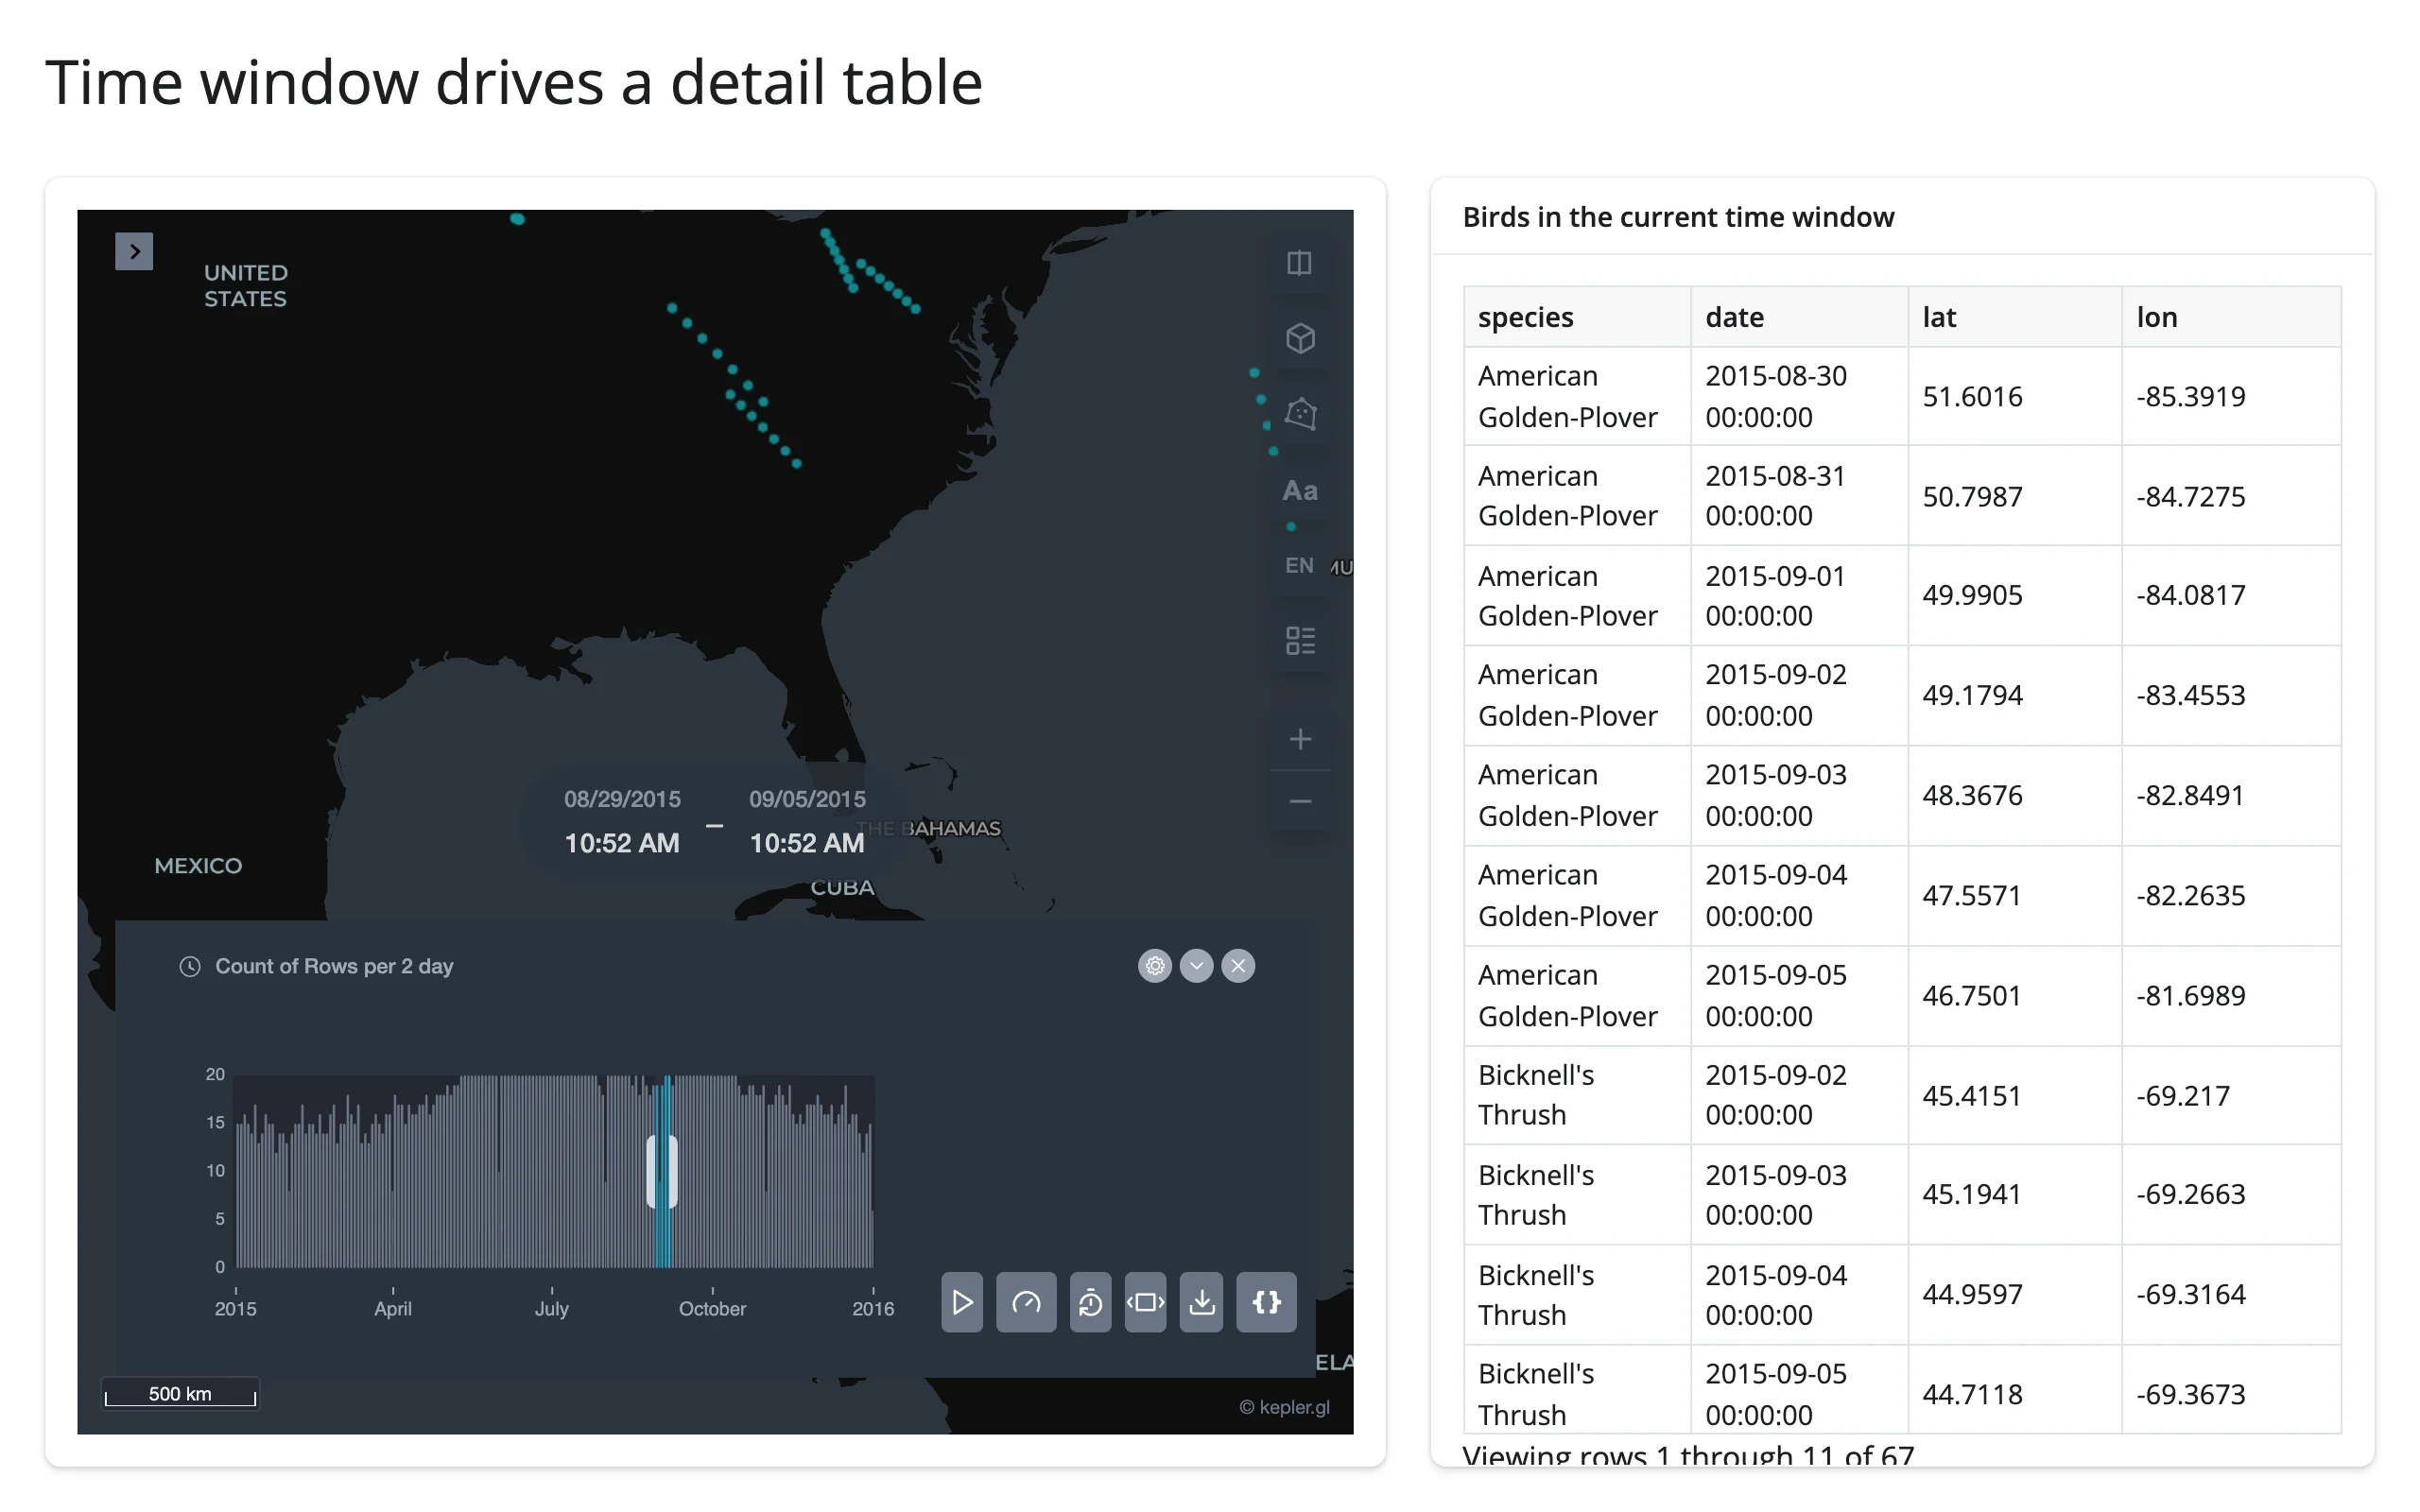
Read the active timeRange filter’s value and filter your own copy of the data by it, for a table (or any other output) that always matches exactly what the map is currently showing – including live, frame by frame, during playback.
import pandas as pd
from keplergl import KeplerGl
from shiny.express import render, ui
from shinywidgets import render_keplergl

birds = pd.read_csv("https://cdn.jsdelivr.net/gh/vega/vega-datasets@5448e25297c8f705be78e879d5423d55d04dc6f1/data/bird-migration.csv")
birds["date"] = pd.to_datetime(birds["date"])

CONFIG = {
    "version": "v1",
    "config": {
        "visState": {
            "filters": [
                {
                    "dataId": ["data"],
                    "id": "migration-date-window",
                    "name": ["date"],
                    "type": "timeRange",
                    "value": [1_427_846_400_000, 1_428_451_200_000],
                    "plotType": {"type": "histogram", "interval": "1-day"},
                    "animationWindow": "free",
                    "view": "enlarged",
                    "speed": 1,
                    "enabled": True,
                }
            ],
        },
        "mapState": {
            "latitude": 25.0,
            "longitude": -85.0,
            "zoom": 3.5,
        },
    },
}

ui.page_opts(title="Time window drives a detail table", fillable=True)

with ui.layout_columns(col_widths=[7, 5]):
    with ui.card(full_screen=True):

        @render_keplergl(rate_policy="throttle", rate_delay=0.5)
        def map():
            return KeplerGl(data={"data": birds}, config=CONFIG)

    with ui.card(full_screen=True):
        ui.card_header("Birds in the current time window")

        @render.data_frame
        def visible_rows():
            config = map.read("config")
            filters = config.get("config", {}).get("visState", {}).get("filters", [])
            if not filters:
                return birds.iloc[0:0]
            start_ms, end_ms = filters[0]["value"]
            start, end = pd.to_datetime(start_ms, unit="ms"), pd.to_datetime(end_ms, unit="ms")
            window = birds[birds["date"].between(start, end)]
            return render.DataGrid(
                window[["species", "date", "lat", "lon"]],
                height="100%",
            )
Before pressing play (67 of 3,229 rows, matching the initial one-week window) and partway through playback (the window has moved on to early September – the plovers are flying south again – and the table now holds exactly the rows inside the new window):
One input, two linked views
A single Shiny input can drive the map (in place) and a companion chart from the same filtered data, so they never disagree:
import plotly.express as px
import plotly.graph_objects as go
from shiny import reactive
from shiny.express import input, ui
from shinywidgets import render_keplergl, render_plotly

carshare = px.data.carshare().rename(
    columns={"centroid_lat": "lat", "centroid_lon": "lon"}
)

ui.page_opts(title="One input, two linked views", fillable=True)
ui.input_slider("min_hours", "Minimum car-share hours", 0, 3000, 0, step=100)


def filtered():
    return carshare[carshare["car_hours"] >= input.min_hours()]


with ui.layout_columns(col_widths=[7, 5]):
    with ui.card(full_screen=True):

        @render_keplergl
        def map():
            with reactive.isolate():
                return filtered()

    with ui.card(full_screen=True):

        @render_plotly
        def hist():
            fig = px.histogram(filtered(), x="car_hours", nbins=20)
            fig.update_layout(
                title=f"{len(filtered())} stations", margin=dict(t=40)
            )
            return fig


@reactive.effect
@reactive.event(input.min_hours)
def _():
    # Both views come from the same `filtered()` call: the map updates in
    # place (preserving its camera and any styling), and the histogram
    # re-renders -- cheap, since it's an ordinary plotly figure.
    map.widget.data = {"data": filtered()}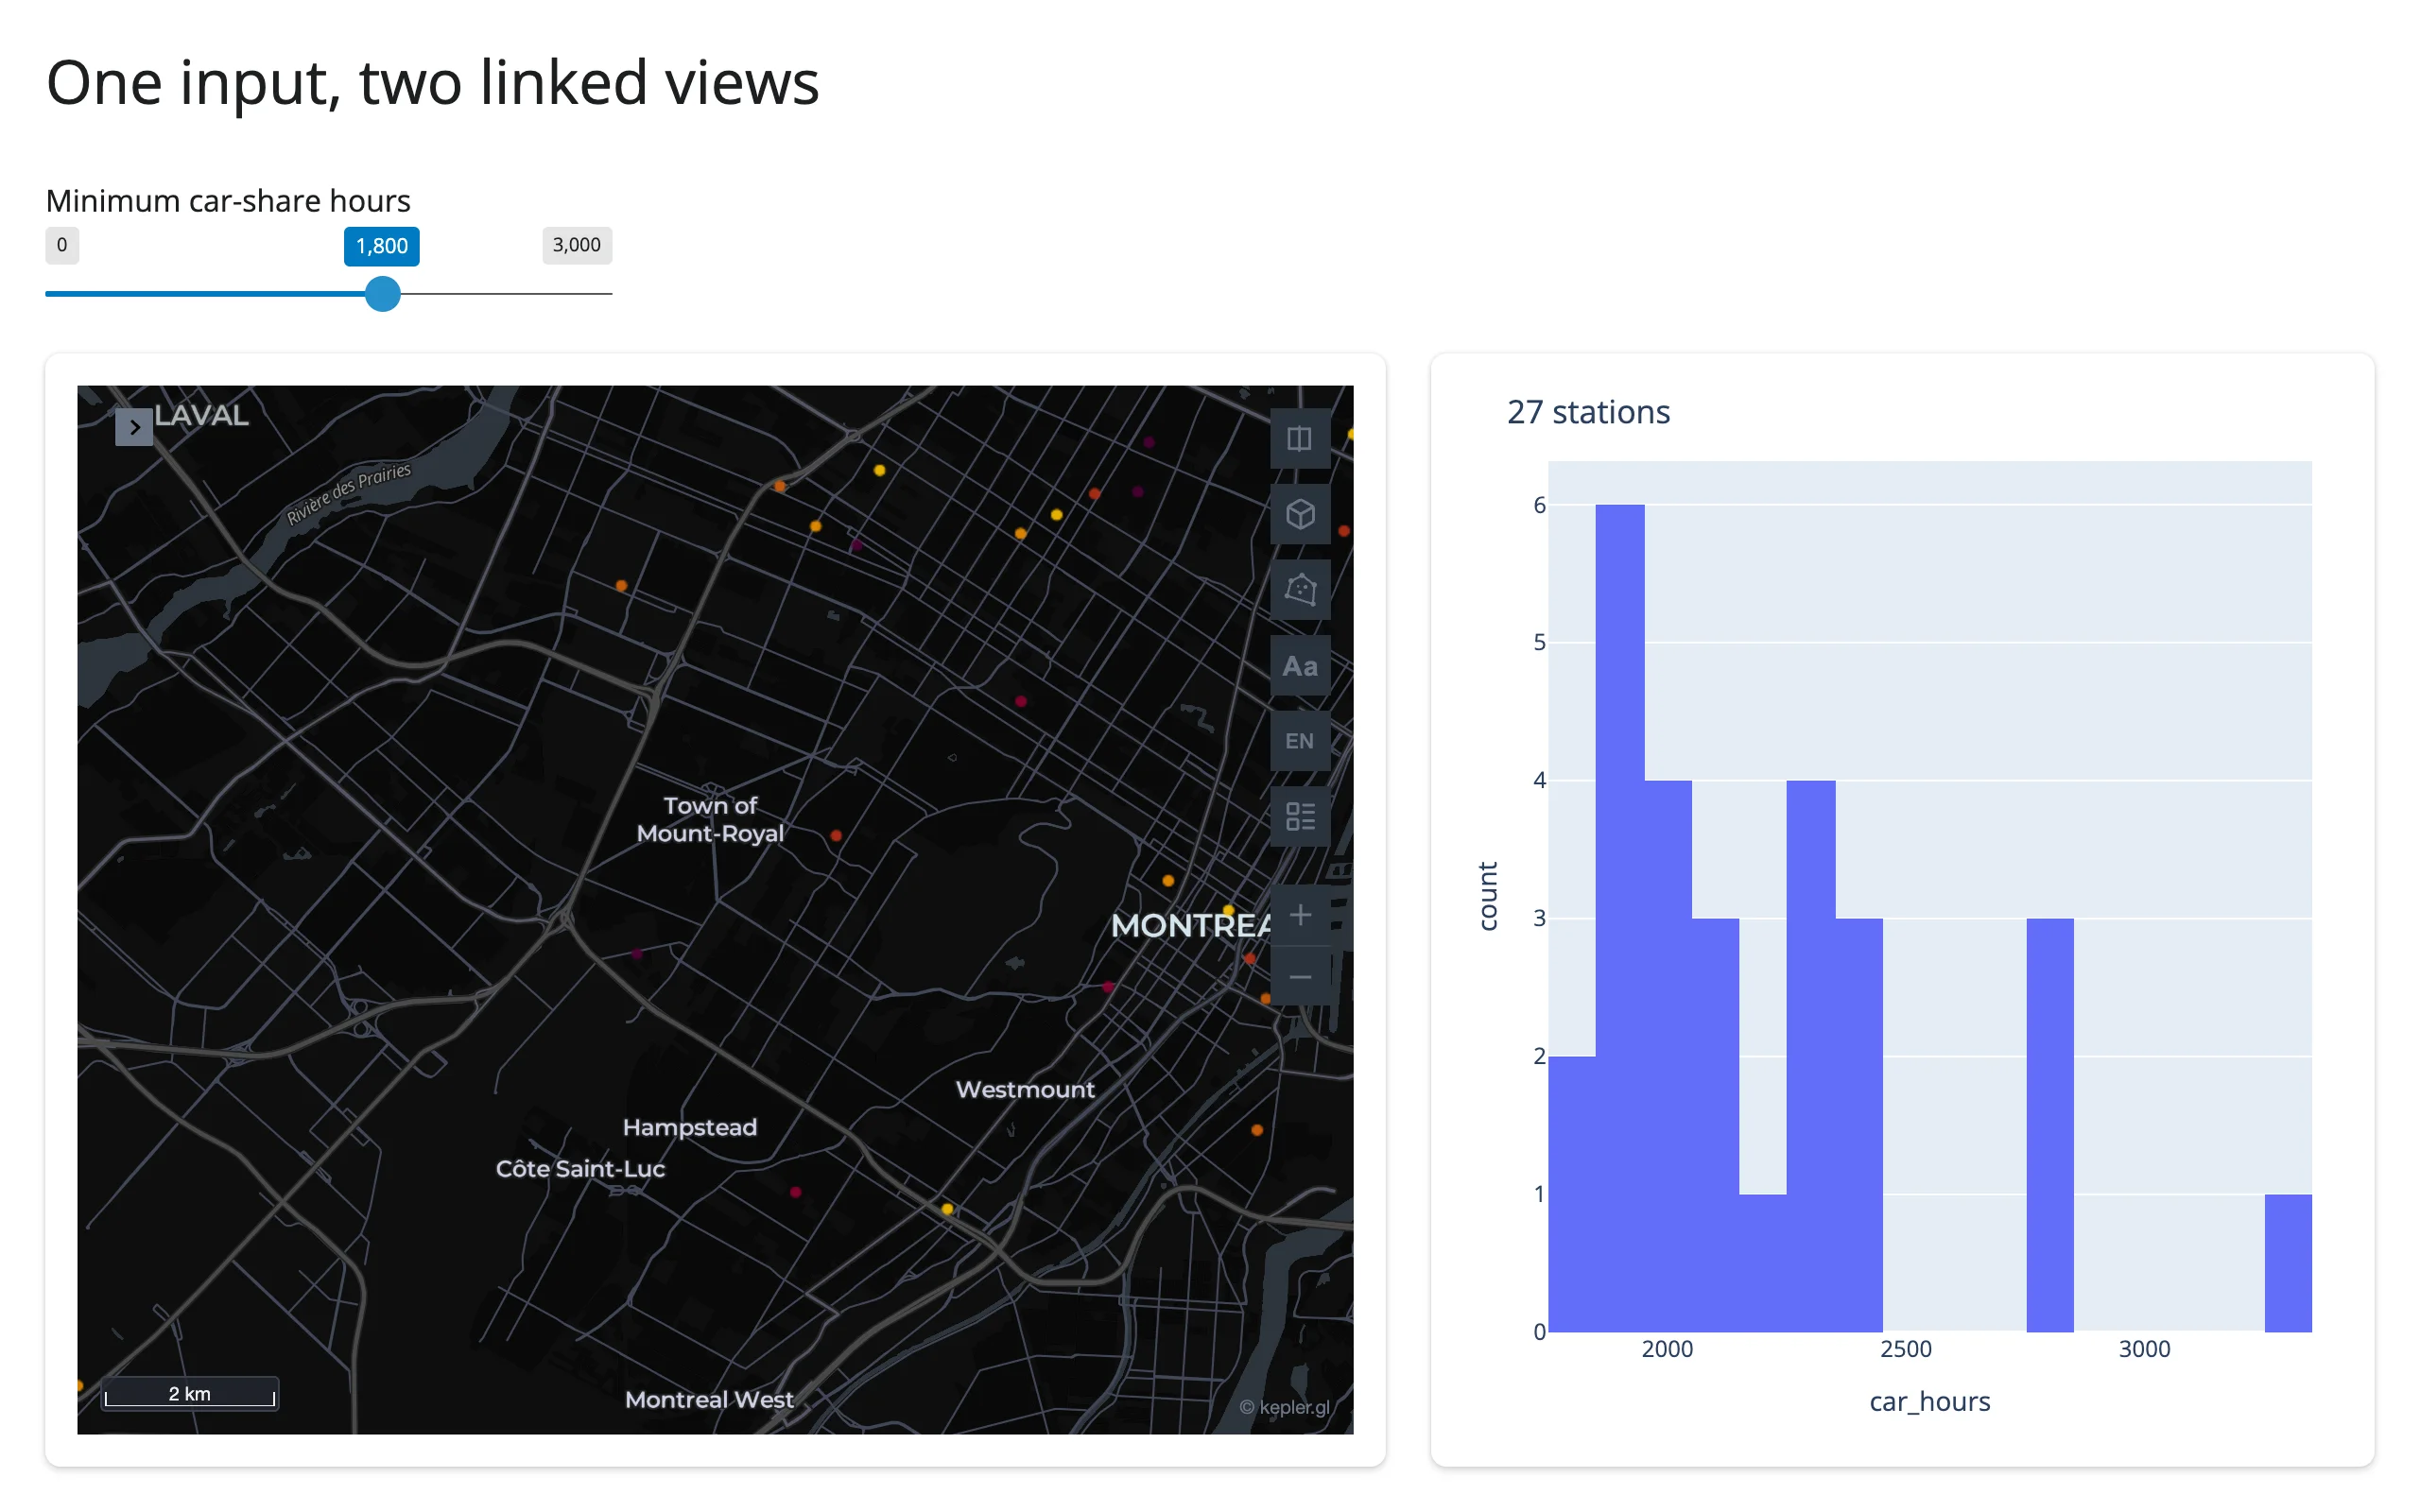
Pairs with: plotly.
Large data
kepler.gl’s own tagline describes it as built for large-scale geospatial datasets, using deck.gl’s GPU aggregation layers (hexbin, grid, cluster) – the same engine lonboard uses, the GPU-in-browser approach. That GPU rendering doesn’t change what crosses the wire, though: the full dataset still goes to the browser as Arrow (see Updating the widget from Python for the measured cost of an initial render), and only the aggregation happens client-side. This guide hasn’t re-measured a specific row-count ceiling; see kepler.gl’s own docs for upstream guidance. For per-gesture accessors and the lightest payload at real scale, prefer lonboard instead – kepler.gl trades that for its point-and-click authoring UI. See the Large data & performance article for the general comparison.
Layout and sizing
In a filling layout (ui.card(full_screen=True), a sidebar, page_opts(fillable=True)), the map resizes to its container the same way every shinywidgets output does. The one kepler-specific wrinkle: the browser (not Python) ends up owning the widget’s height trait once the output is sizing the map, because kepler.gl’s own React state reads height from the model, so a ResizeObserver writes the measured pixel height back into it. Don’t set .widget.height from Python while the output is filling or has an explicit height – change the output’s size (output_widget(height=...) in Core mode, or the surrounding card/sidebar) instead. KeplerGl(height=400) is indistinguishable from the library’s own default and so still fills; pass a different height to opt out, or size the output explicitly.
Fill, cards, full_screen, hidden tabs, and explicit pixel/vh/% heights are all covered by tests/playwright/render_keplergl/test_render_keplergl.py and pass on current main.
Gotchas and limitations
Verified on current main (shinywidgets at 00f90249, keplergl 0.4.0, shiny 1.9.0):
- No CRS reprojection. kepler.gl assumes EPSG:4326 (WGS84 lon/lat) and does not reproject; a GeoDataFrame in a projected CRS (e.g. EPSG:3857) renders silently in the wrong place. Reproject with
.to_crs(4326)first. - The dataset name is
"data". A returned DataFrame/GeoDataFrame becomes a dataset named"data"; use that as thedataIdin any hand-writtenconfig. - Auto-layers need recognizable column names.
lat/latitudepluslon/lng/longitudegets a layer;x/ydoes not. A column literally namednpicks up an extra icon layer. (keplergl-side behavior, not shinywidgets.) - Time columns need a real datetime dtype. A date string column (even an ISO one) is detected as a plain
stringfield, with no time filter available; convert withpd.to_datetime()first so it’s sent as an Arrow timestamp column. - Setting
.widget.configafter render, with a brand-new layer, used to duplicate the auto-created layer. This is the one bug the previous (pre-0.4, release-candidate) evaluation of this renderer flagged as a blocker. It does not reproduce on keplergl 0.4.0 final for auto-created layers: repeatedly re-assigning.widget.configsettles at the correct layer count every time in this pass’s testing. Still prefer passingconfigat construction (KeplerGl(data=..., config=CONFIG)) when you can – it avoids the question entirely and is one fewer round trip. - …but a config-set containing an explicit
layersentry does break on keplergl 0.4.0 (an upstream keplergl-widget bug, not shinywidgets): the layer stops rendering, and with a fully materialized (synced-back) config it is also duplicated in kepler’s layer panel. And because keplergl’s config-set path hardcodes kepler.gl’skeepExistingConfigmerge, incomingvalues for filters that already exist are ignored – a saved time window can’t be restored programmatically. Camera-only restore works around both: stripvisState.layersfrom the saved config before assigning it, as the gallery showcase does. - Bundle size is real and by design. Every freshly rendered
KeplerGlwidget ships kepler.gl’s ~12.9 MB JavaScript bundle (anywidget inlines_esmin the comm payload; Jupyter pays the same cost per widget). This is why Updating the widget from Python matters more here than for most widgets. - Console noise from kepler.gl itself, harmless: a “Timeout waiting for instance registration” warning on every mount (an uncleared
setTimeout),[keplergl-data]debug logging, and a “Mapbox Token not valid” warning even when using a token-free basemap (CARTO dark-matter/positron/voyager, no_map). Mapbox-hosted styles do needmapbox_token=. - 0.4.0 is a young release (an anywidget rewrite of what had been an ipywidgets-7 widget); expect the usual early-release rough edges upstream.
What’s not a bug, verified this pass: a DataFrame with missing values renders and does not crash the session (use_arrow=True is NaN-safe); a pd.Series or other non-DataFrame pandas object is rejected with a clear TypeError rather than silently misbehaving; and the formerly-documented echo-replay issue (stale browser-originated updates being re-applied, which previously caused blank maps and runaway layer duplication during playback) is fixed on main – _comm.py and comm.ts now tag every message with a msg_id/parent_header pair.
Gallery candidates
gallery/template_station_explorer.py (template, ~45 lines): a minimal, adaptable starting point – a slider filters car-share stations, the map updates in place, and a sidebar reads the live config.mapState.zoom back from the browser.
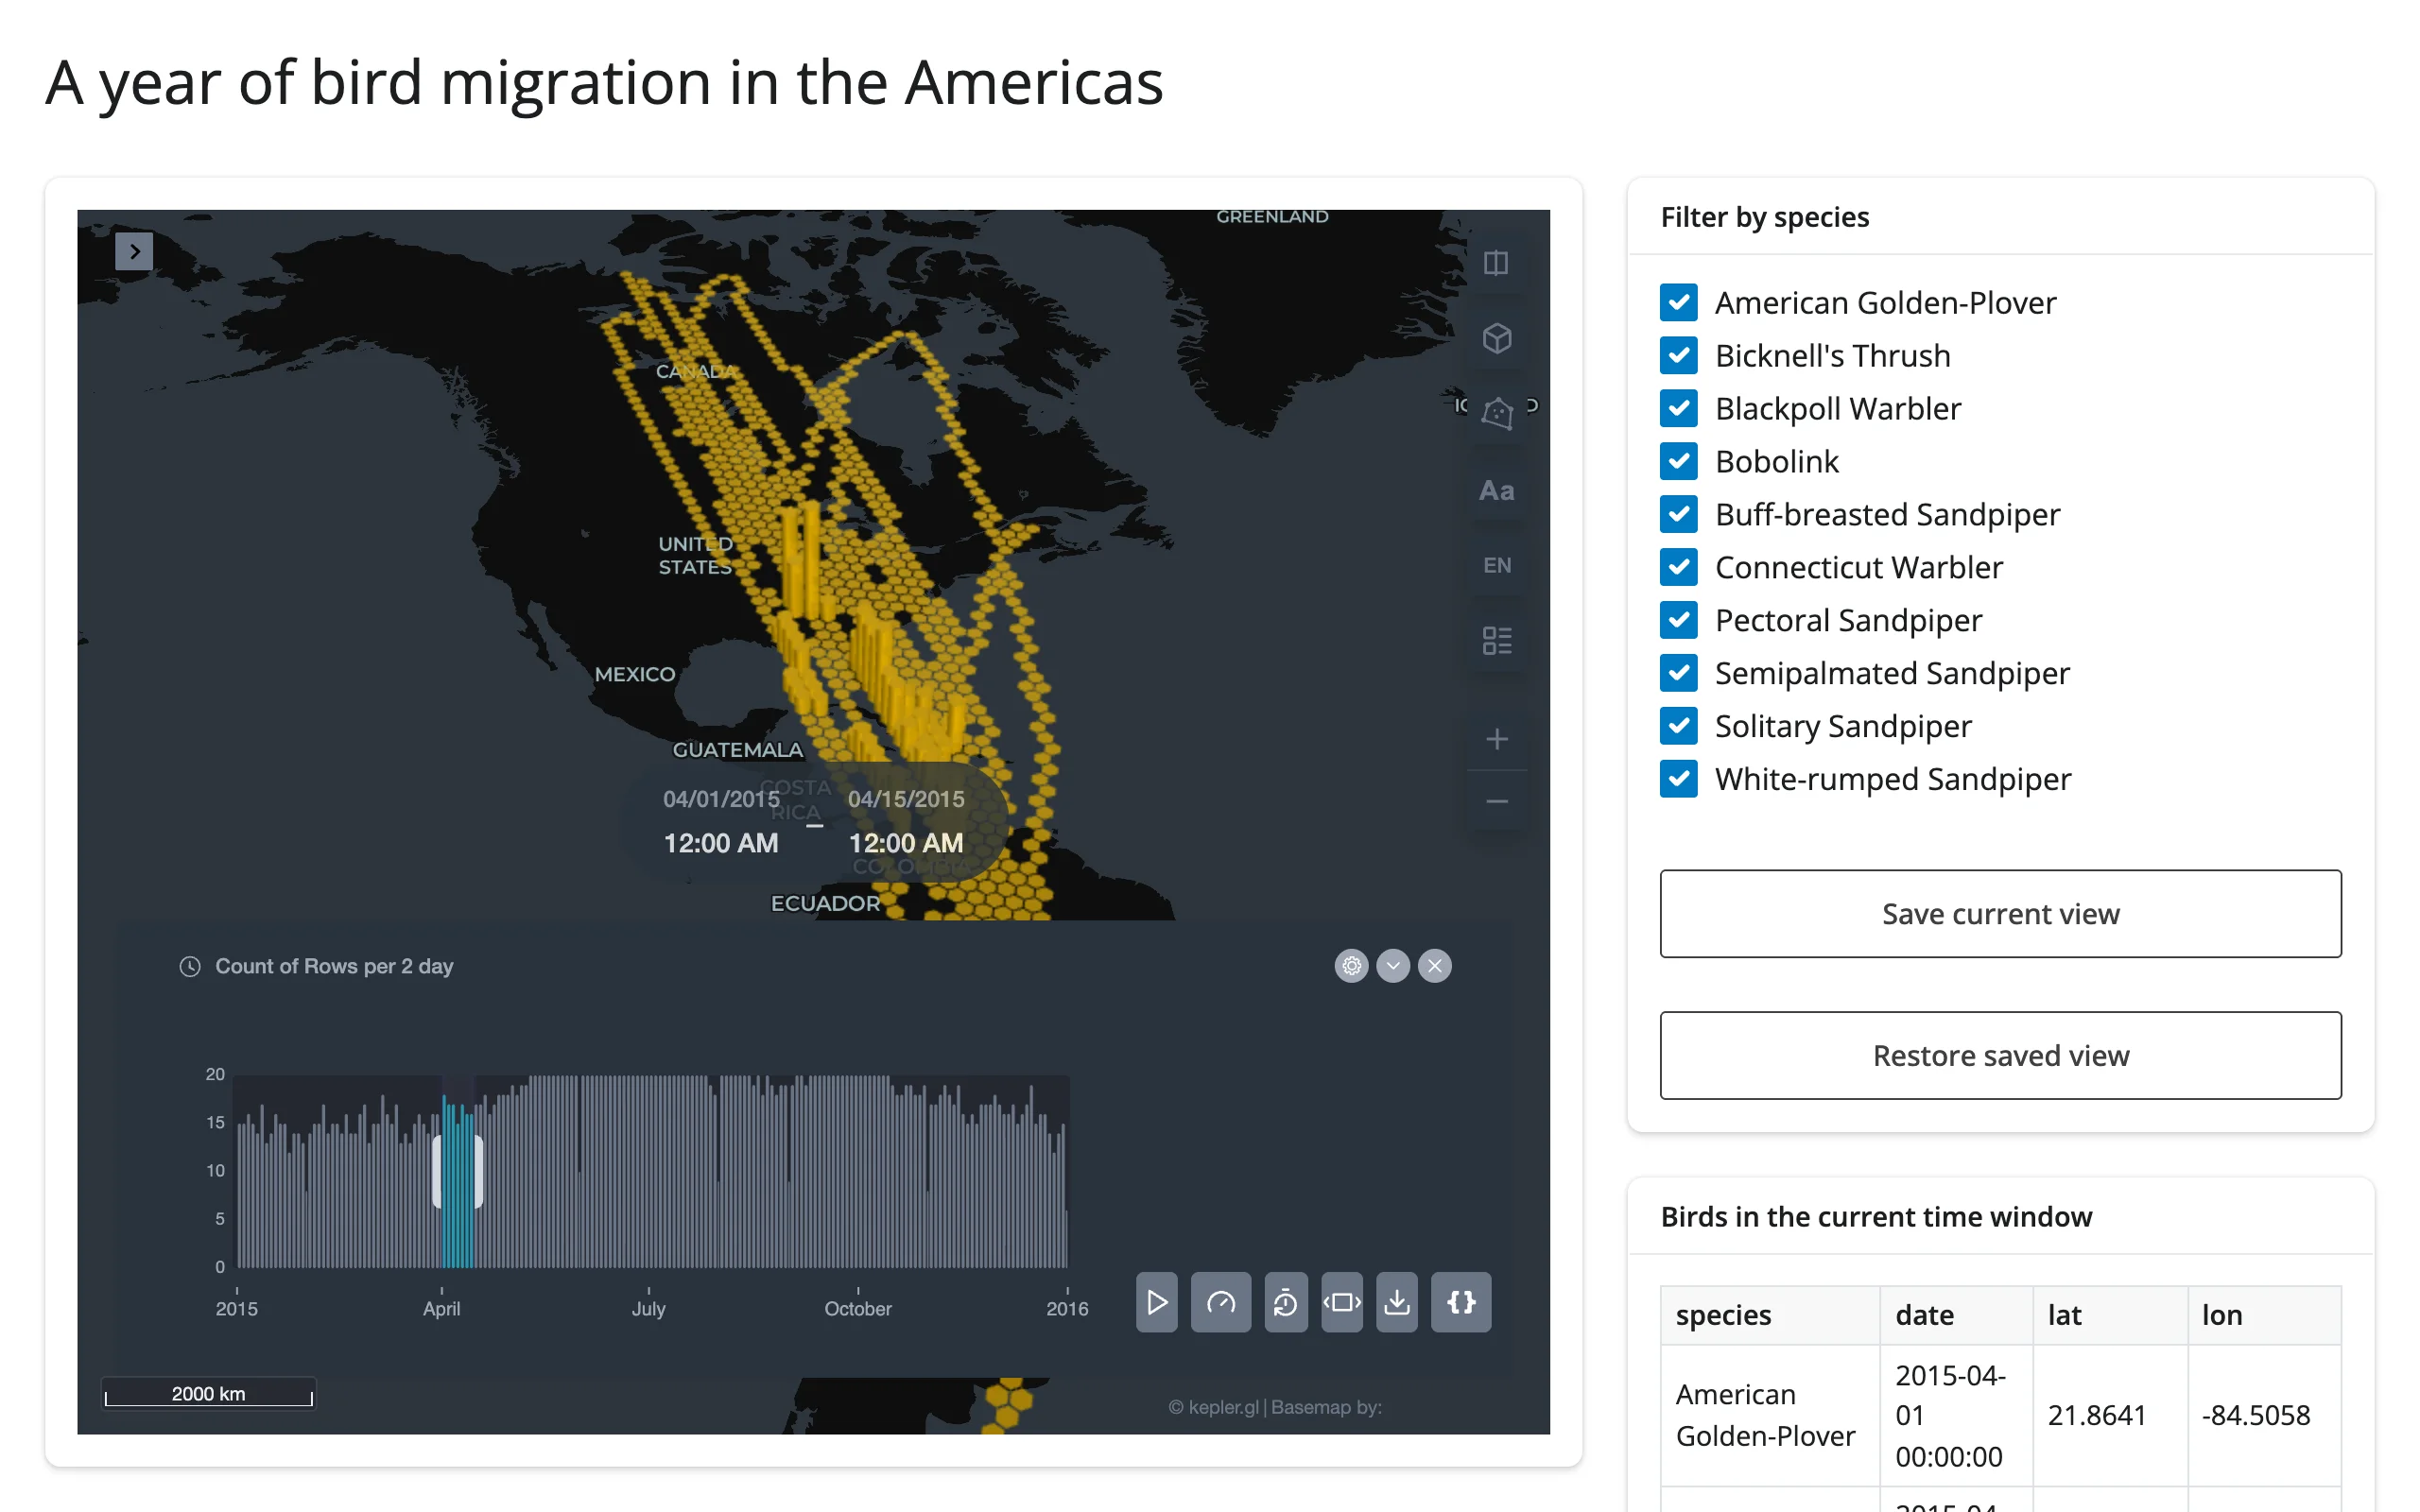
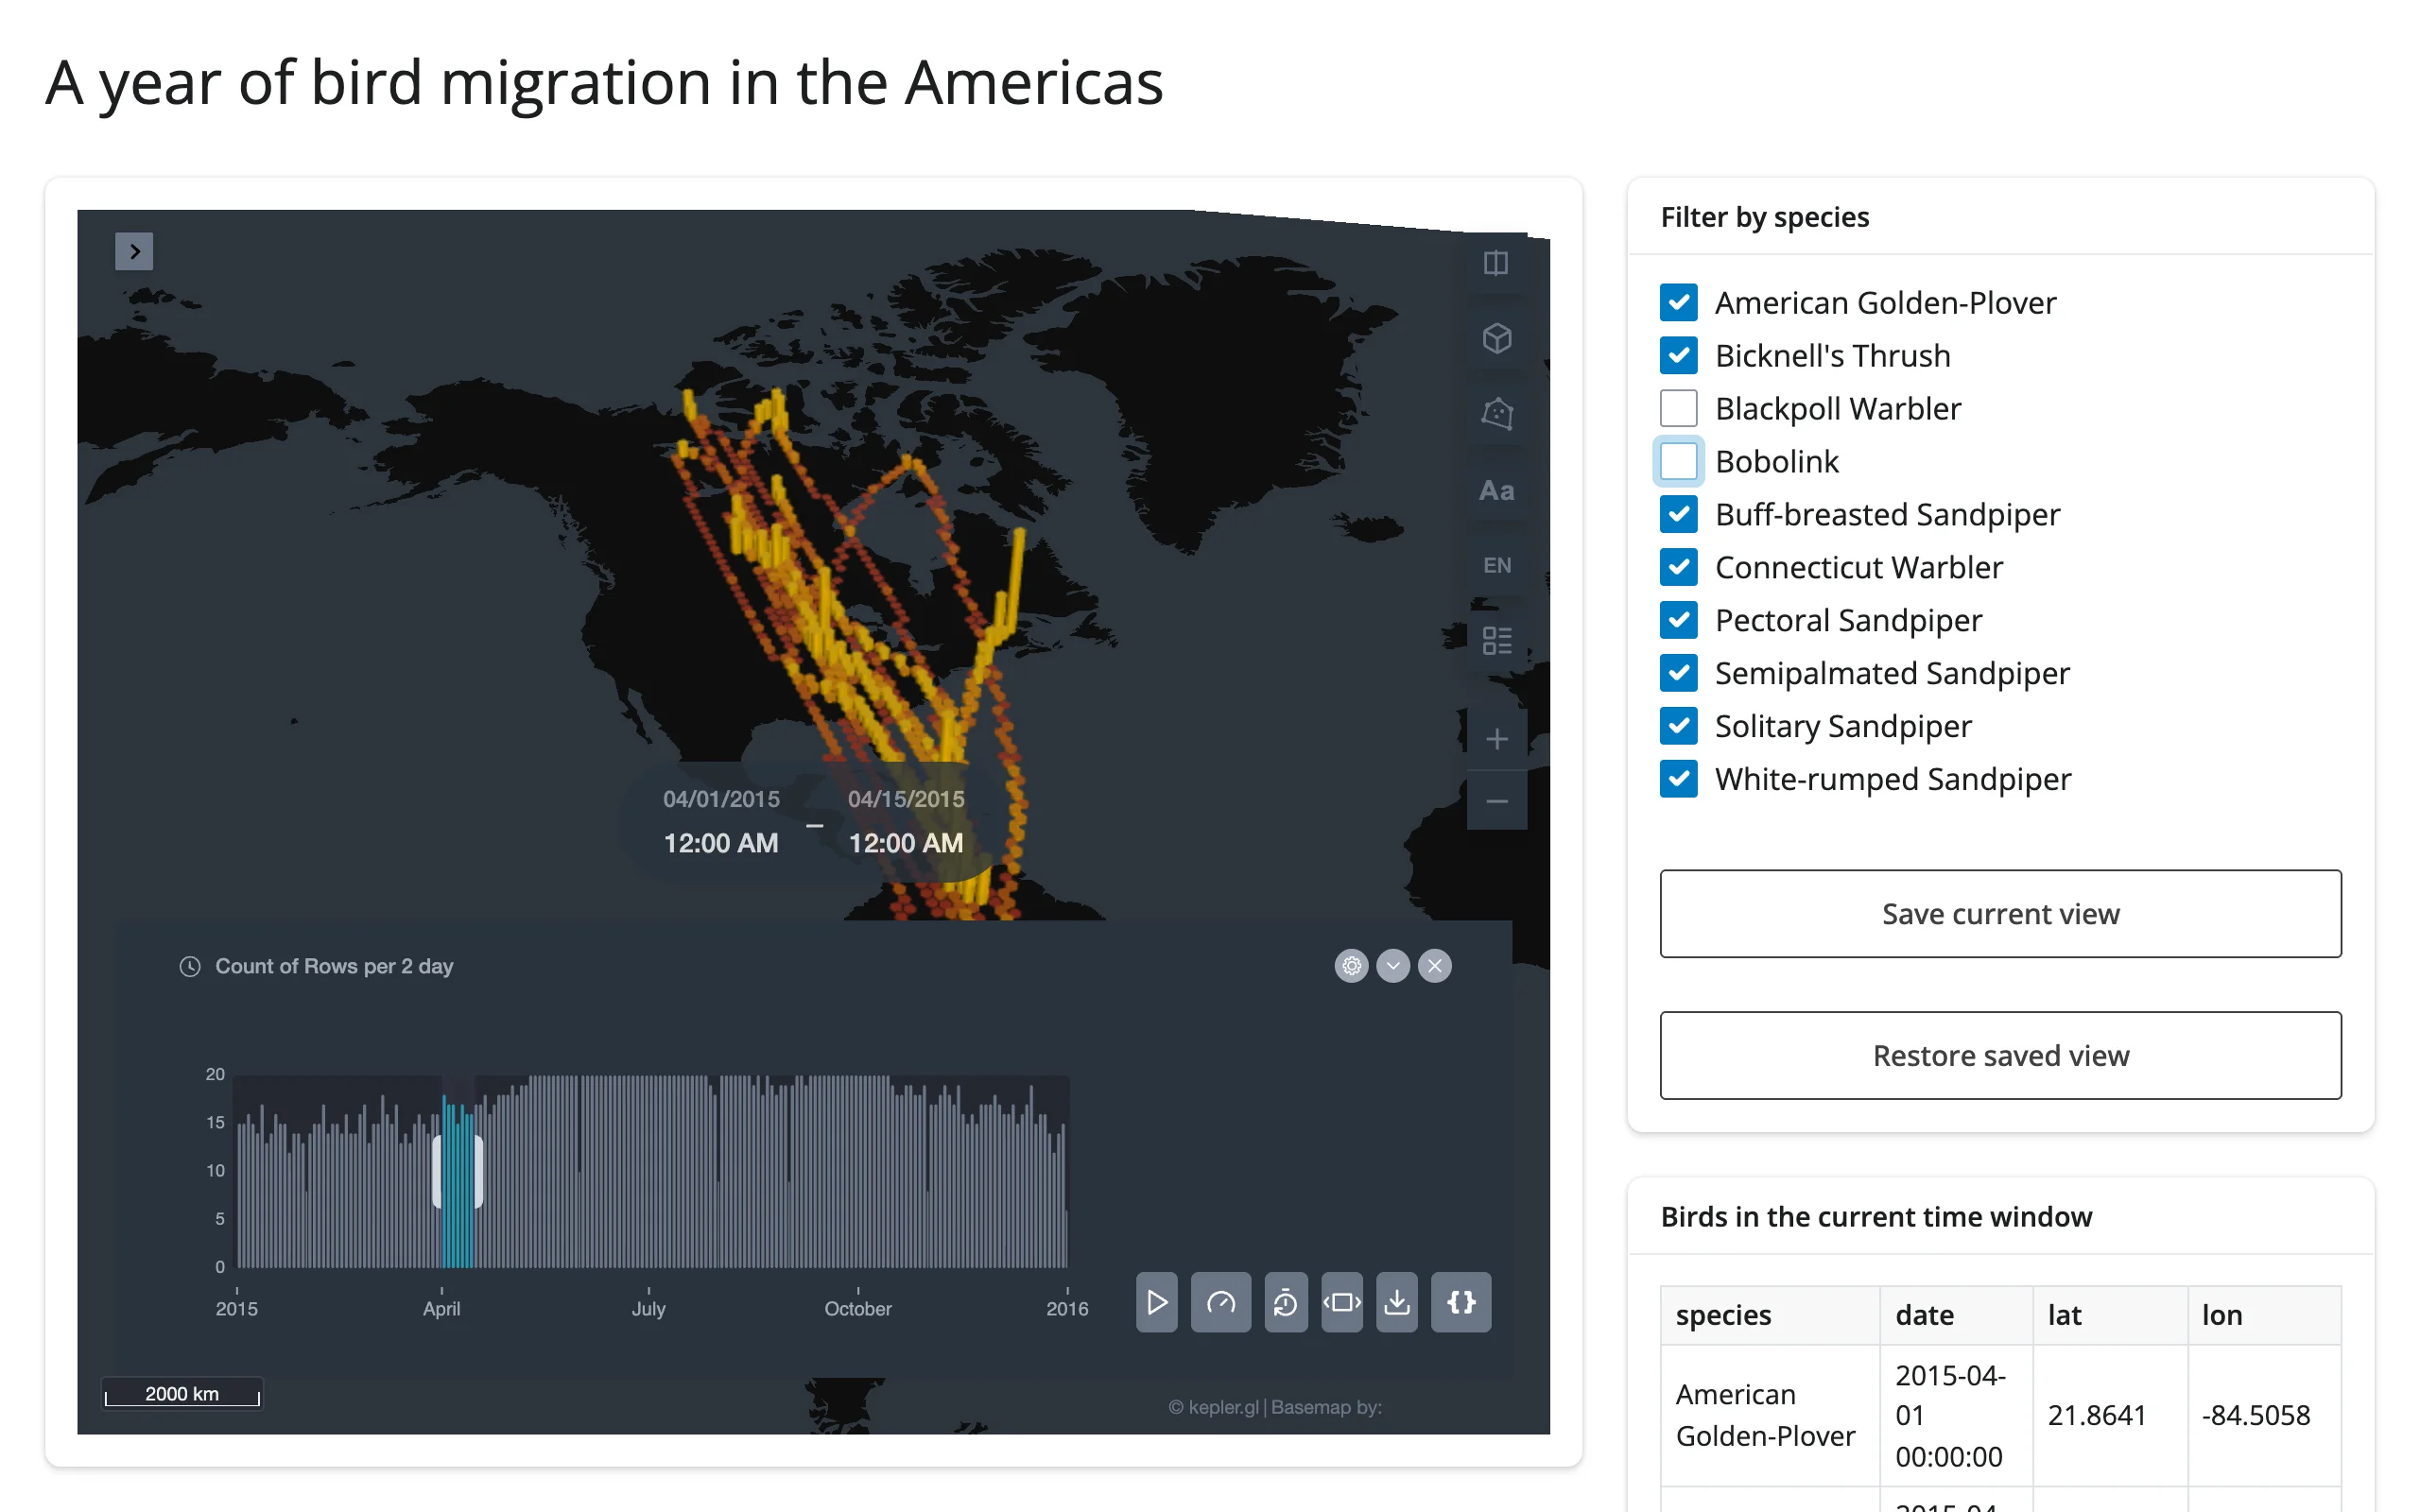
gallery/showcase_bird_migration.py (showcase, ~140 lines): a 3D hexbin density map of a year of bird migration across the Americas, driven by kepler.gl’s own time filter and playback. A checkbox group filters by species (updating the map in place), and a Shiny table tracks exactly what’s inside the current time window, live. “Save current view” / “Restore saved view” buttons save and restore the camera (position, zoom, pitch, bearing) – restoring replaces only mapState, so the current layer styling and time window survive (see the second-to-last gotcha below for why restoring the whole config is not the way to go).
Learn more
- kepler.gl user guide – layers, filters, and the config schema
- kepler.gl on GitHub
- Related guides in this roster: lonboard (GPU-scale, code-driven styling), maplibre (vector-tile basemaps, code-driven restyling), ipyleaflet / leafmap (per-feature click/hover callbacks), plotly (linked chart pattern above)