Embedding Atlas
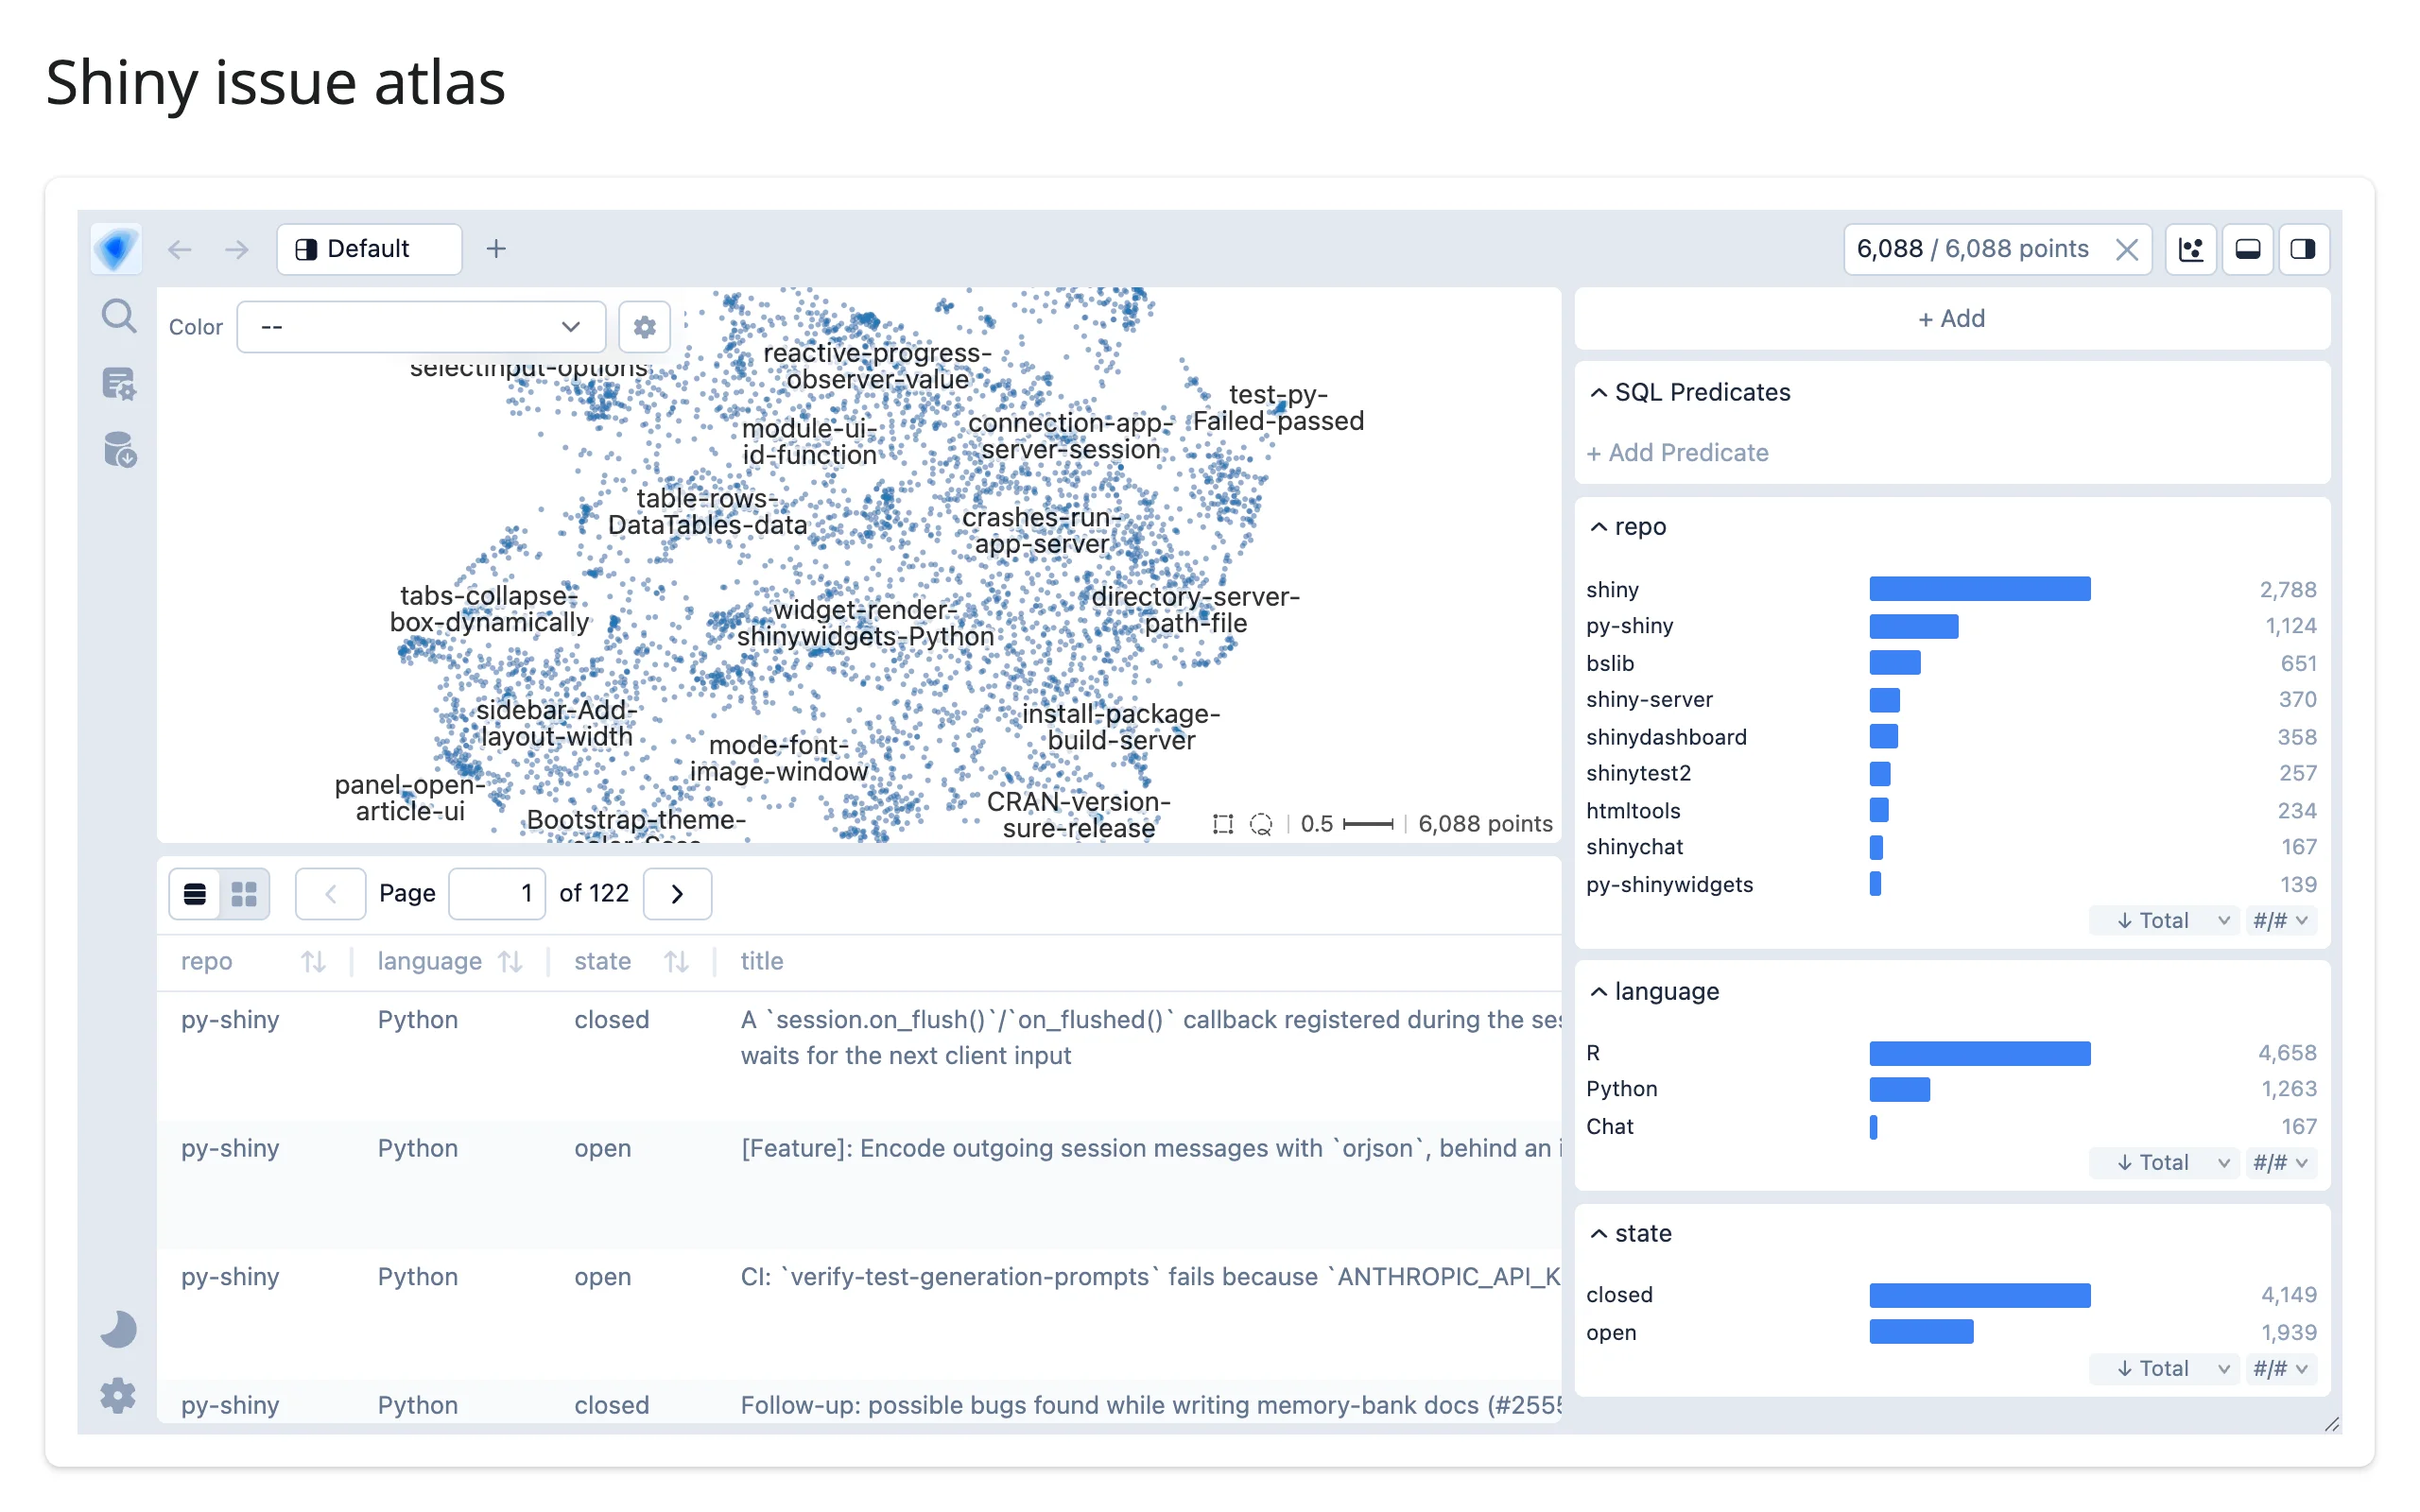
Embedding Atlas is Apple’s tool for exploring large collections of text or image embeddings: drop in a data frame with a 2D projection (or let the library compute one for you with UMAP) and it builds a GPU-rendered scatter map, automatic bar/histogram charts for every other column, a searchable/paginated table, and automatically generated cluster labels – all wired together by a shared, in-process DuckDB cross-filter. It’s built for the same job as tools like Nomic Atlas or TensorFlow Projector: finding structure (clusters, duplicates, outliers) in thousands to millions of embedded documents, images, or rows, without writing a clustering or labeling pipeline yourself.
@render_embedding_atlas takes an embedding_atlas.widget.EmbeddingAtlasWidget that you construct yourself (a bare data frame isn’t enough here, unlike most renderers in this roster, since the widget needs to know which columns hold the projection, text, and so on). The renderer applies shinywidgets’ usual layout defaults (fill its card, or keep the library’s own 650px height when space isn’t fillable) and, critically, locks down the widget’s DuckDB connection before display so that the SQL the browser sends can’t reach your server’s files – see the security gotcha below before deploying this. Two accessors turn the explorer’s cross-filter into reactive values: predicate() gives you the live filter as a SQL WHERE expression, and selected() gives you the matching rows directly, both debounced so a dragging lasso or brush doesn’t flood your server with DuckDB queries.
Choose Embedding Atlas over a sibling in this roster when the point is semantic/cluster exploration of a column of text or images at the center of the app – its auto-charts, auto-labels, and built-in table are the draw. For a bare, fast, million-point GPU scatter without the chart/table/SQL machinery, see jupyter-scatter. For million-row exploration via a Vega-Lite-style grammar instead of a fixed layout, see mosaic. For tabular search and paging without a map, see itables or perspective.
The embedding (scatter) view itself needs a browser with WebGPU and the shader-f16 feature (recent desktop Chrome, Edge, or Firefox). Everywhere else, the map is replaced by a “WebGPU is unavailable” placeholder, but the charts, the table, search, and SQL predicates keep working, and they alone are enough to drive every accessor in this guide. Confirm your deployment target has WebGPU before relying on the map for the finished product – headless Chromium needs channel="chromium" plus --enable-unsafe-webgpu --use-angle=metal and a real http(s):// origin (not about:blank or a data: URL, which aren’t secure contexts) to get it at all, which is how every screenshot in this guide was produced.
Installation
pip install 'shinywidgets[embedding_atlas]'This needs Python 3.11 or newer (embedding-atlas’s own requirement). The package’s full dependency tree is heavy – it pulls in torch, sentence-transformers, litellm, accelerate, and umap-learn for its optional embedding and projection helpers – but EmbeddingAtlasWidget itself needs none of that; only embedding_atlas.projection.compute_projection() (see below) touches umap-learn, and only when you call it.
Quick start
# A minimal Embedding Atlas explorer over a real dataset: 6,088 GitHub issues
# from the Shiny ecosystem (R and Python Shiny, bslib, shinywidgets, ...), with
# a 2D projection already computed offline (see "Computing a projection").
# Data: docs/showcase/issues/embed.py built data/issues.parquet from public
# GitHub issues using embedding_atlas.projection.compute_projection().
from pathlib import Path

import pandas as pd
from embedding_atlas.widget import EmbeddingAtlasWidget
from shiny.express import ui
from shinywidgets import render_embedding_atlas

ISSUES = pd.read_parquet(Path(__file__).parent / "data" / "issues.parquet")
COLUMNS = ["repo", "language", "state", "title", "text", "projection_x", "projection_y"]

ui.page_opts(title="Shiny issue atlas", fillable=True)

with ui.card(full_screen=True):

    @render_embedding_atlas
    def atlas():
        return EmbeddingAtlasWidget(
            ISSUES[COLUMNS], x="projection_x", y="projection_y", text="text"
        )
That’s the whole app: one data frame, four column names, and you get a GPU-rendered map with automatic cluster labels, auto-generated bar charts for repo, language, and state, and a searchable, paginated table – all answered by DuckDB queries your Python process runs. The dataset is real: 6,088 issues from nine repos in the Shiny ecosystem, with a text projection computed once, offline (the next section shows how), and the cluster labels (“reactive-progress-observer-value”, “crashes-run-app-server”, …) are generated automatically from issue text, with no configuration at all (see “Auto-generated cluster labels” below).
What you can build
Computing a projection, or bringing your own
examples/02_compute_projection.py
EmbeddingAtlasWidget only ever plots x/y columns you give it – it doesn’t embed anything itself. Upstream’s embedding_atlas.projection.compute_projection() does that part: it embeds a text, image, or vector column (text and image need sentence-transformers/transformers; a column of precomputed vectors needs nothing but umap-learn) and runs UMAP to lay the result out in 2D. It can’t run inside a Shiny app’s own event loop – it calls asyncio.run() internally, which raises once a loop is already running, the same restriction that keeps it out of Jupyter – so treat it as an offline step: compute once, cache to Parquet, and have your app’s render function only ever read the cached columns. That’s exactly what builds issues.parquet, used throughout this guide (see docs/showcase/issues/embed.py for the real text/sentence-transformers version) (examples/02_compute_projection.py):
# Turn embedding vectors into the x/y columns an atlas needs, with
# embedding_atlas.projection.compute_projection(). A real app embeds raw text
# or images (modality="text"/"image", needs sentence-transformers); here the
# vectors are already computed, so modality="vector" skips straight to UMAP.
#
# compute_projection() can't run inside a Shiny app's own event loop (it
# calls asyncio.run() internally, which raises once a loop is already
# running -- the same reason Jupyter can't call it directly either). Compute
# it once, offline, the way docs/showcase/issues/embed.py does for the real
# GitHub-issues dataset used elsewhere in this guide:
#   uv run --with umap-learn python 02_compute_projection.py
# (UMAP's first call compiles its numba kernels, about a minute; reruns are
# fast.) Then view the cached result with `shiny run 02_compute_projection.py`.
from pathlib import Path

import numpy as np
import pandas as pd
from embedding_atlas.widget import EmbeddingAtlasWidget
from shiny.express import ui
from shinywidgets import render_embedding_atlas

CACHE = Path(__file__).parent / "data" / "projected_topics.parquet"


def build_cache() -> None:
    rng = np.random.default_rng(0)
    topics = {"astronomy": 0, "cooking": 1, "sailing": 2, "chess": 3}
    docs = pd.DataFrame(
        {
            "topic": [t for t in topics for _ in range(60)],
            "text": [f"{t} note {i}" for t in topics for i in range(60)],
        }
    )
    # 16-dim stand-ins for real text embeddings: one Gaussian cluster per topic
    centers = rng.normal(scale=4, size=(len(topics), 16))
    docs["vector"] = [
        (centers[topics[t]] + rng.normal(size=16)).tolist() for t in docs["topic"]
    ]

    # Imported here, not at module level: needs umap-learn, which only the
    # cache-building path below requires -- `shiny run` never hits this branch
    from embedding_atlas.projection import compute_projection

    docs = compute_projection(docs, inputs="vector", modality="vector", neighbors=None)
    docs.drop(columns=["vector"]).to_parquet(CACHE, index=False)


if __name__ == "__main__":
    build_cache()
    print(f"wrote {CACHE}")
else:
    docs = pd.read_parquet(CACHE)

    ui.page_opts(title="Projected from embedding vectors", fillable=True)

    with ui.card(full_screen=True):

        @render_embedding_atlas
        def atlas():
            return EmbeddingAtlasWidget(docs, x="projection_x", y="projection_y", text="text")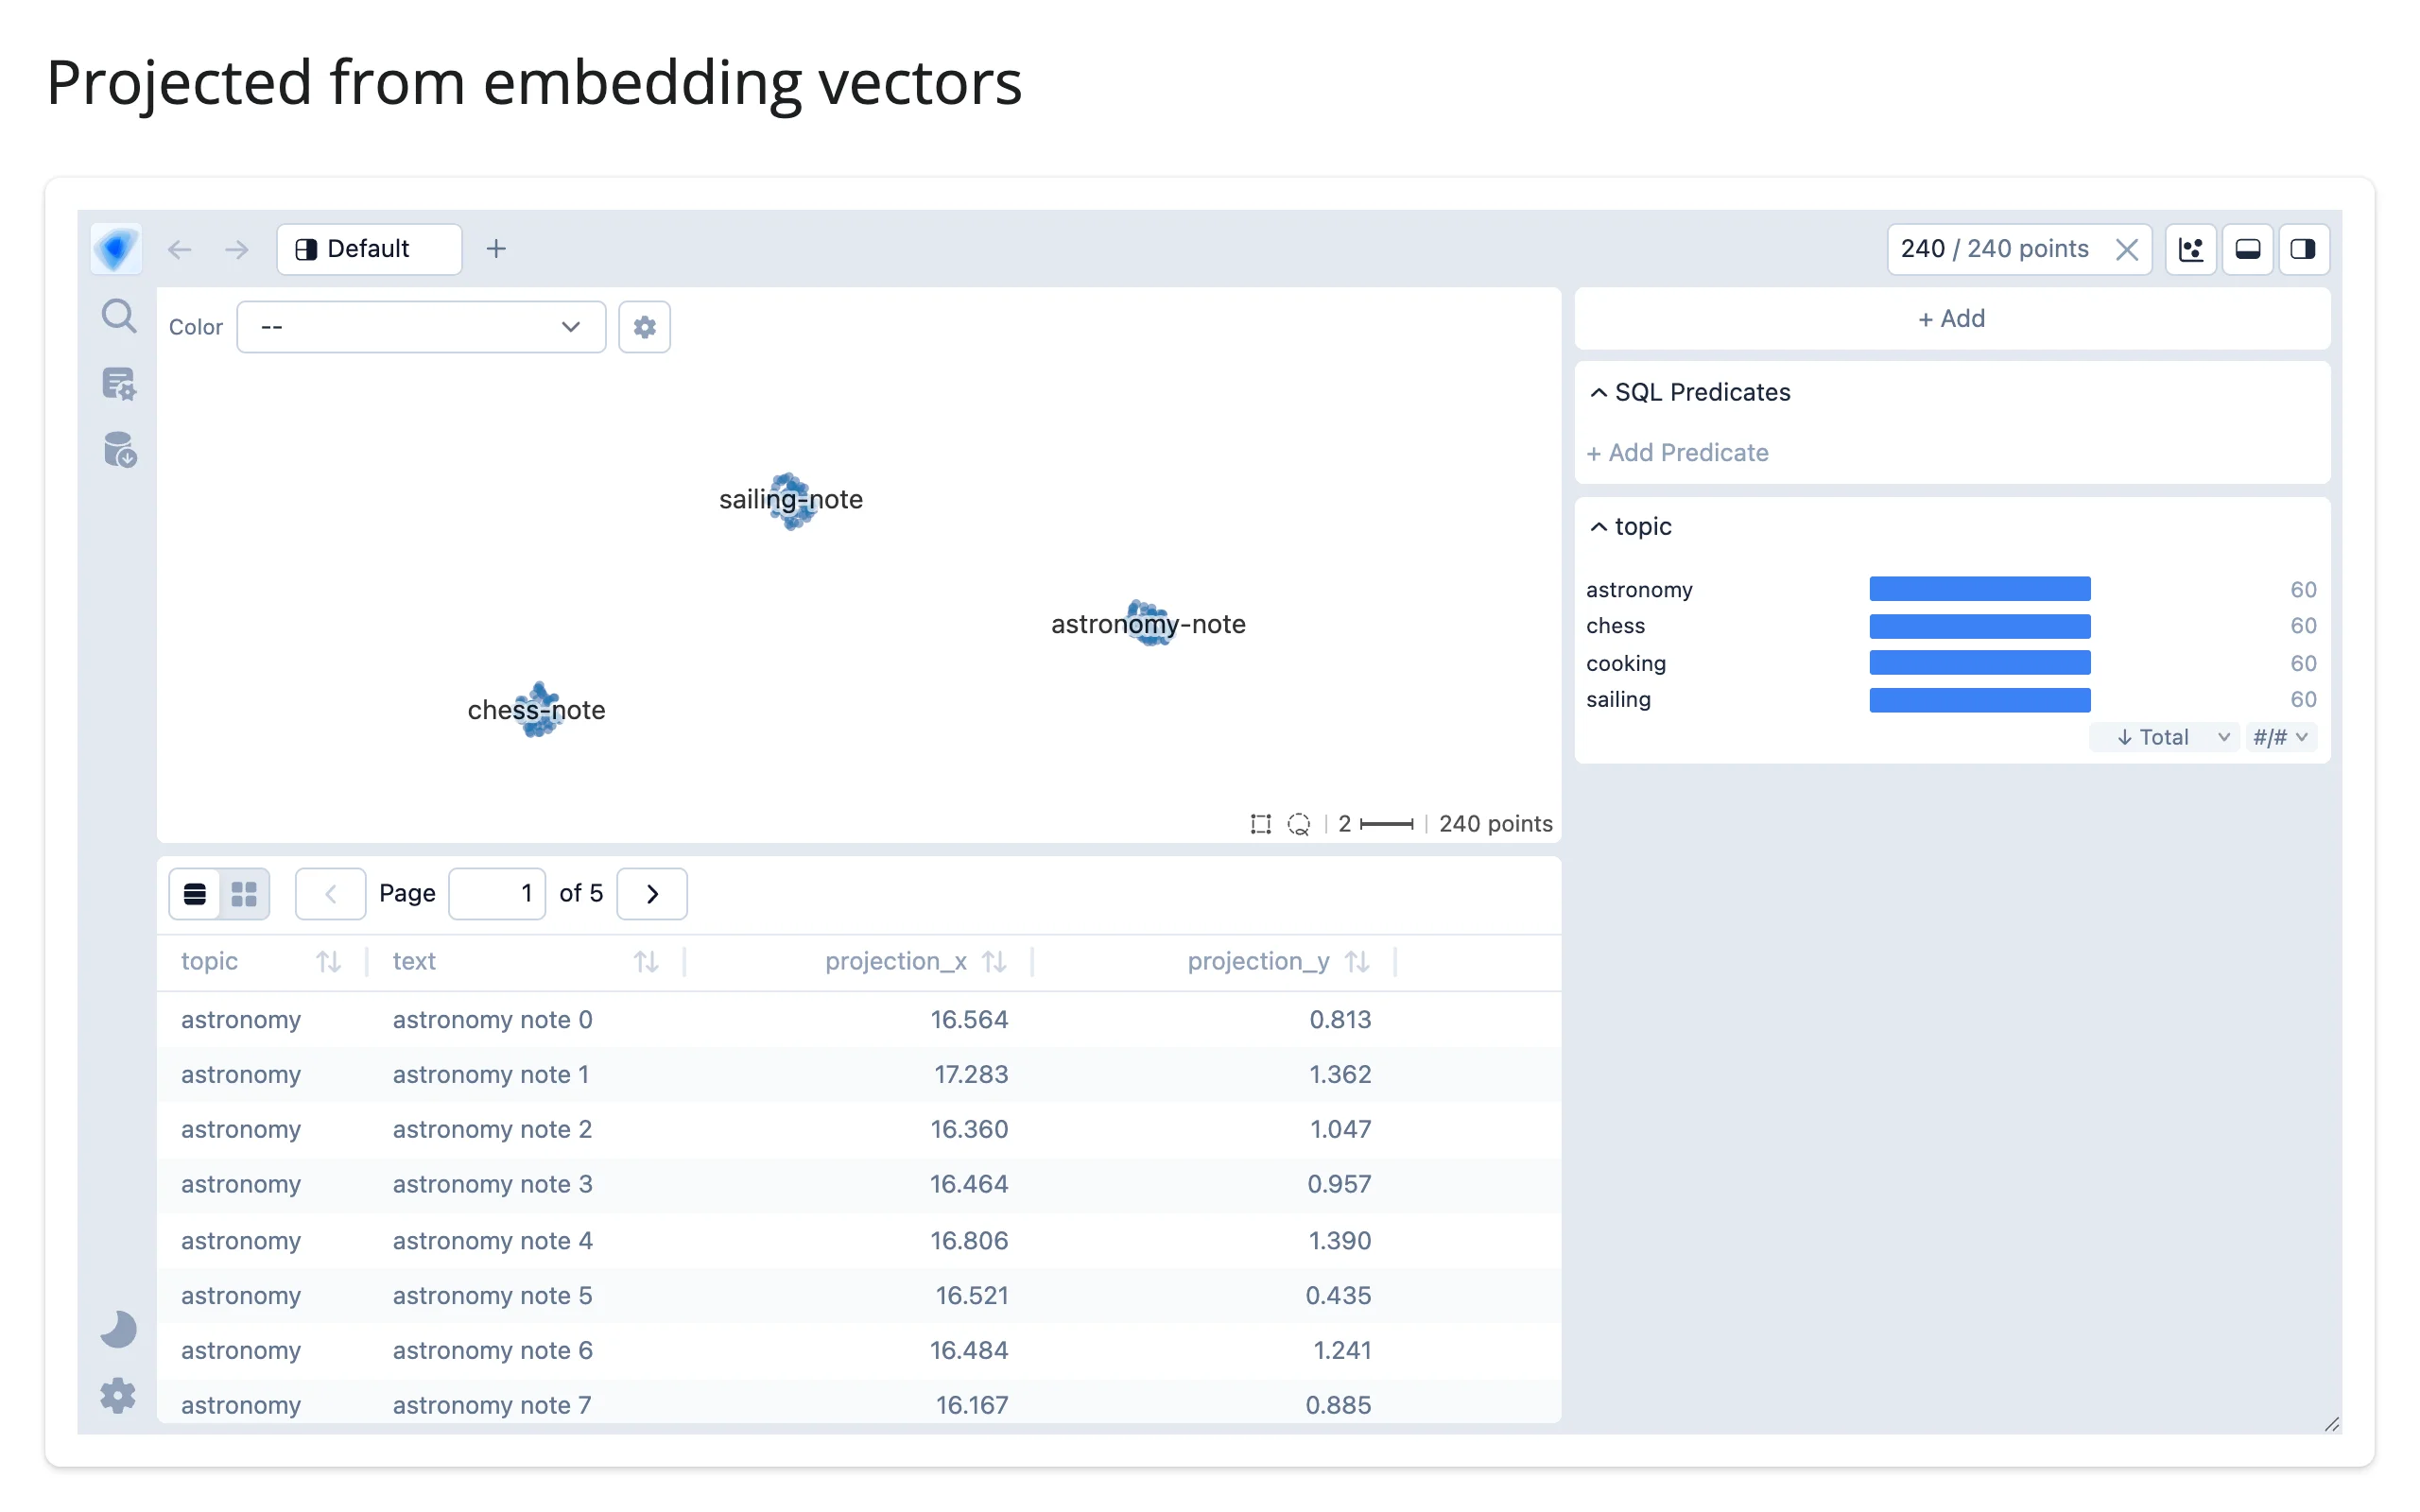
The four synthetic topics (astronomy, cooking, sailing, chess) land in four well-separated regions, confirming UMAP placed semantically similar vectors near each other. Swap modality="vector" for modality="text" and an embedder="sentence-transformers" to embed raw strings instead – the rest of the call is identical.
Auto-generated cluster labels
The cluster labels visible in the hero and quick start screenshots (“reactive-progress-observer-value”, “crashes-run-app-server”, …) aren’t something you configure – they’re on by default whenever you give text=. The map clusters by 2D density and titles each cluster with its own top TF-IDF keywords from that column, so you get a labeled map with no topic-modeling code and no extra argument (examples/03_auto_labels.py):
# Automatic cluster labels are the library's default whenever `text` is
# given -- you don't pass anything to get them (the quick start already has
# them; this is the same data, cropped in on the embedding view itself). The
# `labels=` option is for supplying your own list of label dicts instead, not
# a flag to toggle the automatic ones (see Gotchas: the documented
# "automatic"/"disabled" sentinel strings don't work as described).
from pathlib import Path

import pandas as pd
from embedding_atlas.widget import EmbeddingAtlasWidget
from shiny.express import ui
from shinywidgets import render_embedding_atlas

ISSUES = pd.read_parquet(Path(__file__).parent / "data" / "issues.parquet")
COLUMNS = ["repo", "language", "title", "text", "projection_x", "projection_y"]

ui.page_opts(title="Auto-labeled issue clusters", fillable=True)

with ui.card(full_screen=True):

    @render_embedding_atlas
    def atlas():
        return EmbeddingAtlasWidget(
            ISSUES[COLUMNS], x="projection_x", y="projection_y", text="text"
        )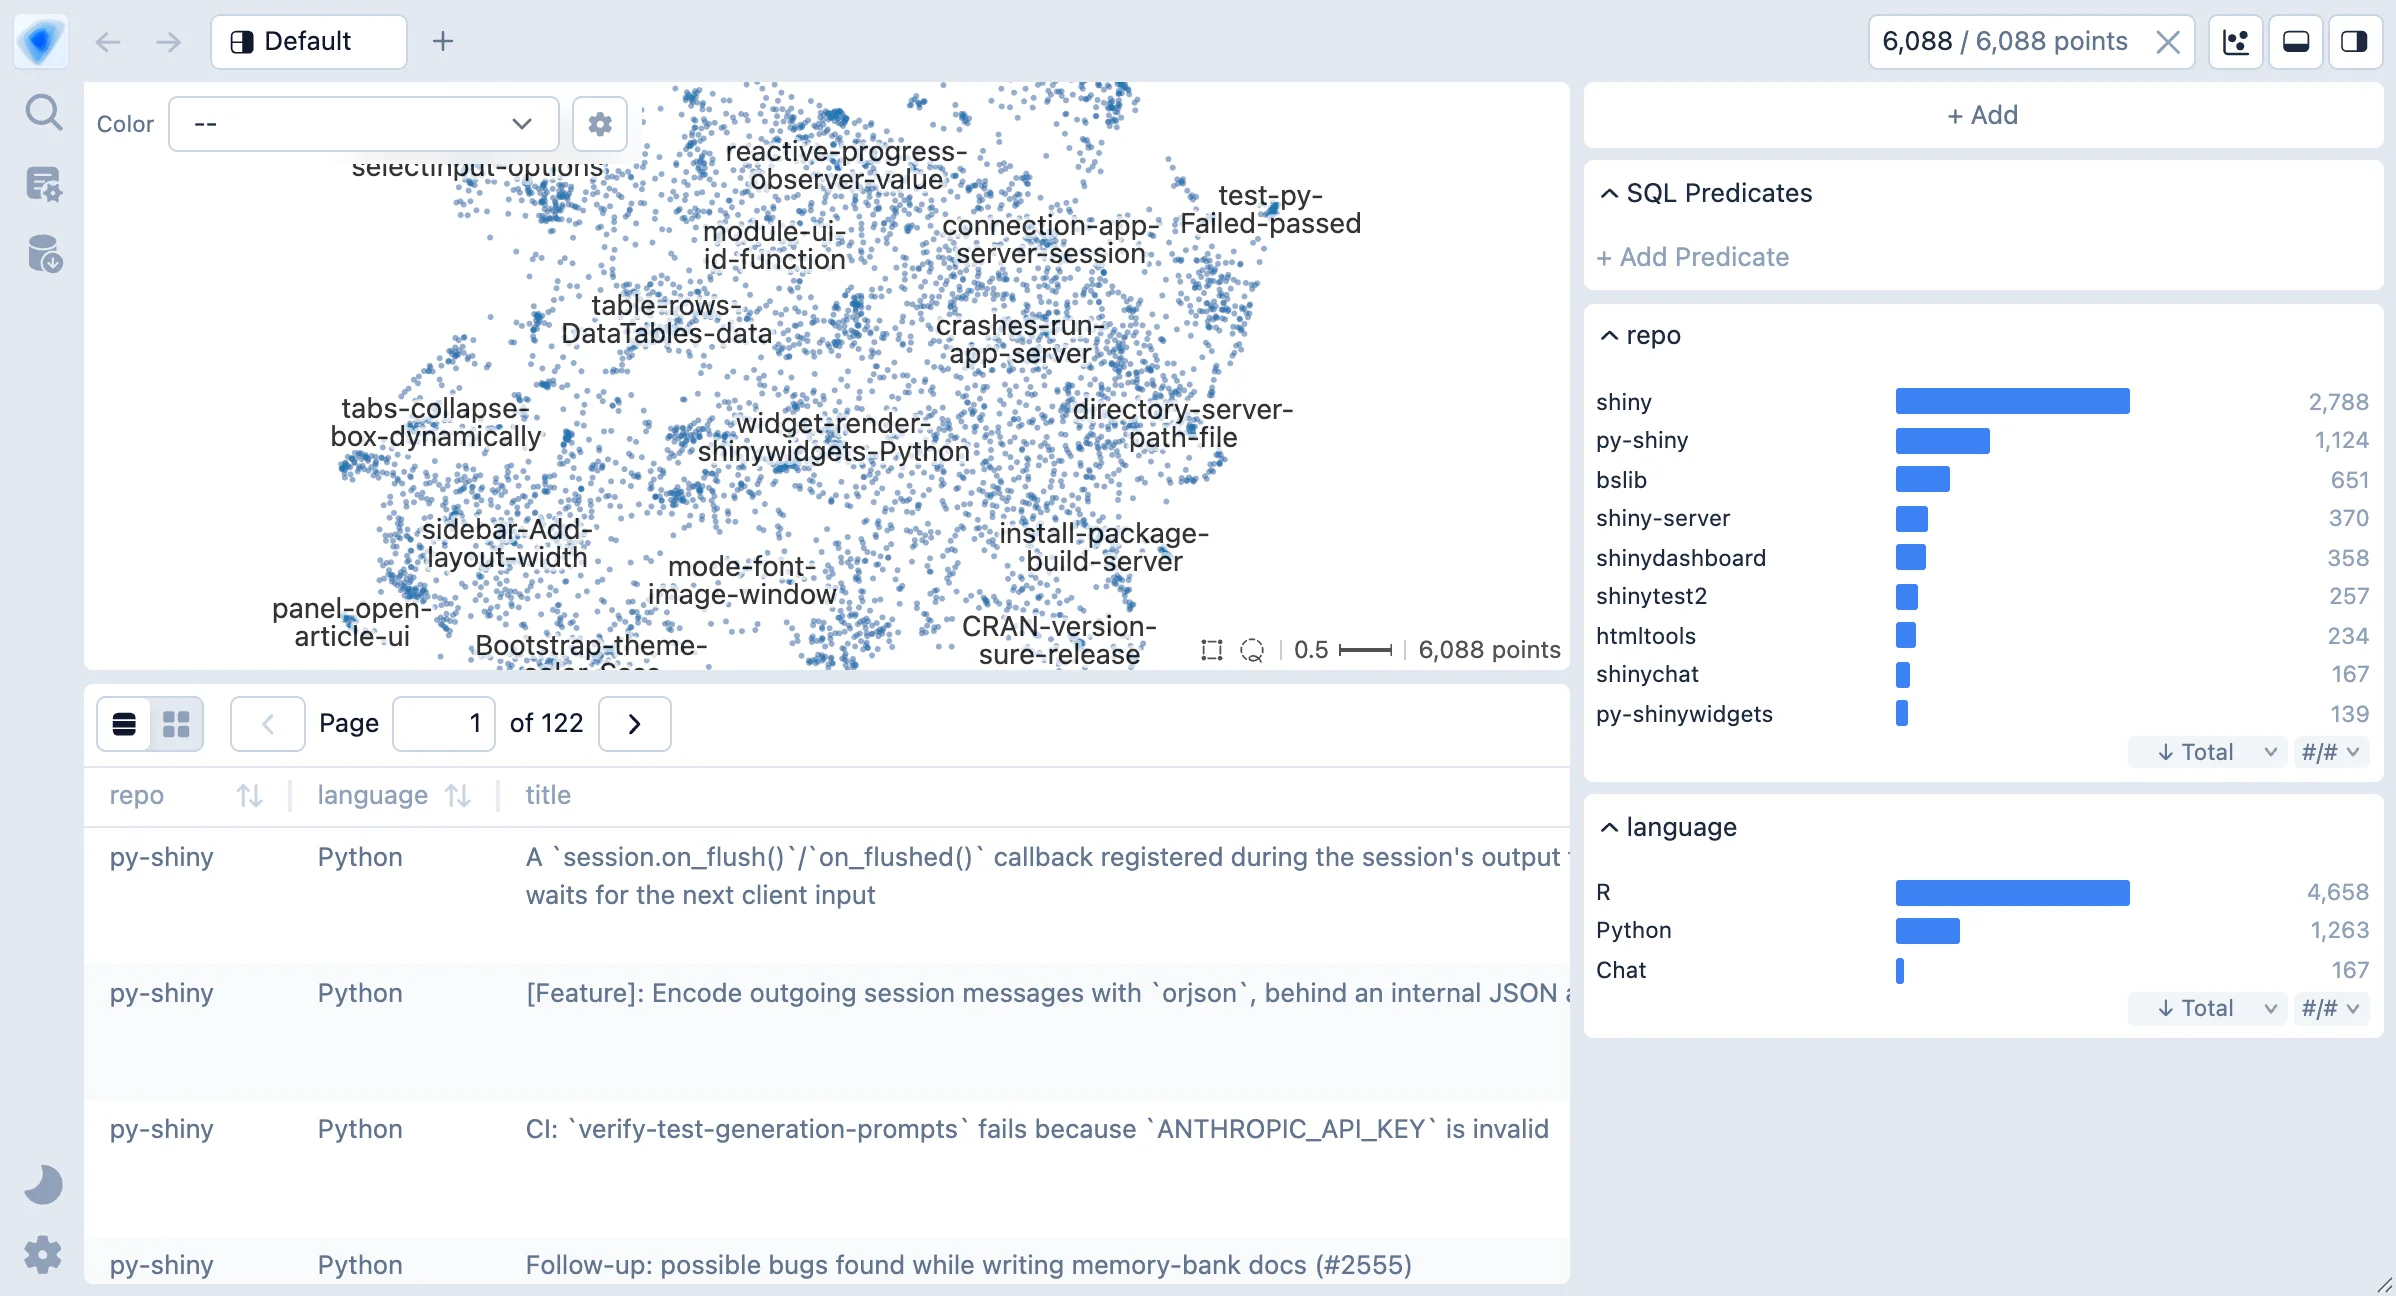
The Python labels= option (documented as taking the strings "automatic" or "disabled", or a list of your own label dicts) doesn’t do what its docstring says – see the Gotchas section below before reaching for it.
Images in the explorer
Put PNG or JPEG bytes (or a data:/http(s) URL) in a column and pass it as image=: the table and hover tooltips show the picture alongside every other column, and it participates in the same cross-filter as everything else. sklearn’s bundled 8x8 handwritten-digit images, blown up to 64x64, make this concrete (examples/04_images.py):
# Put PNG bytes in a column and pass it as `image=`: the explorer shows the
# image in hover tooltips and the detail table, alongside the auto-generated
# charts for every other column. Needs scikit-learn for the bundled digits
# dataset: `uv run --with scikit-learn shiny run 04_images.py`
import io

import numpy as np
import pandas as pd
from embedding_atlas.widget import EmbeddingAtlasWidget
from PIL import Image
from shiny.express import ui
from shinywidgets import render_embedding_atlas
from sklearn.datasets import load_digits
from sklearn.decomposition import PCA

digits = load_digits()
rng = np.random.default_rng(0)
idx = rng.choice(len(digits.images), size=600, replace=False)


def to_png(pixels: "np.ndarray") -> bytes:
    img = Image.fromarray((pixels / 16 * 255).astype("uint8")).resize((64, 64))
    buf = io.BytesIO()
    img.save(buf, format="PNG")
    return buf.getvalue()


xy = PCA(n_components=2).fit_transform(digits.data[idx])
docs = pd.DataFrame(
    {
        "digit": digits.target[idx].astype(str),
        "image": [to_png(p) for p in digits.images[idx]],
        "x": xy[:, 0],
        "y": xy[:, 1],
    }
)

ui.page_opts(title="Handwritten digits with image previews", fillable=True)

with ui.card(full_screen=True):

    @render_embedding_atlas
    def atlas():
        return EmbeddingAtlasWidget(docs, x="x", y="y", image="image")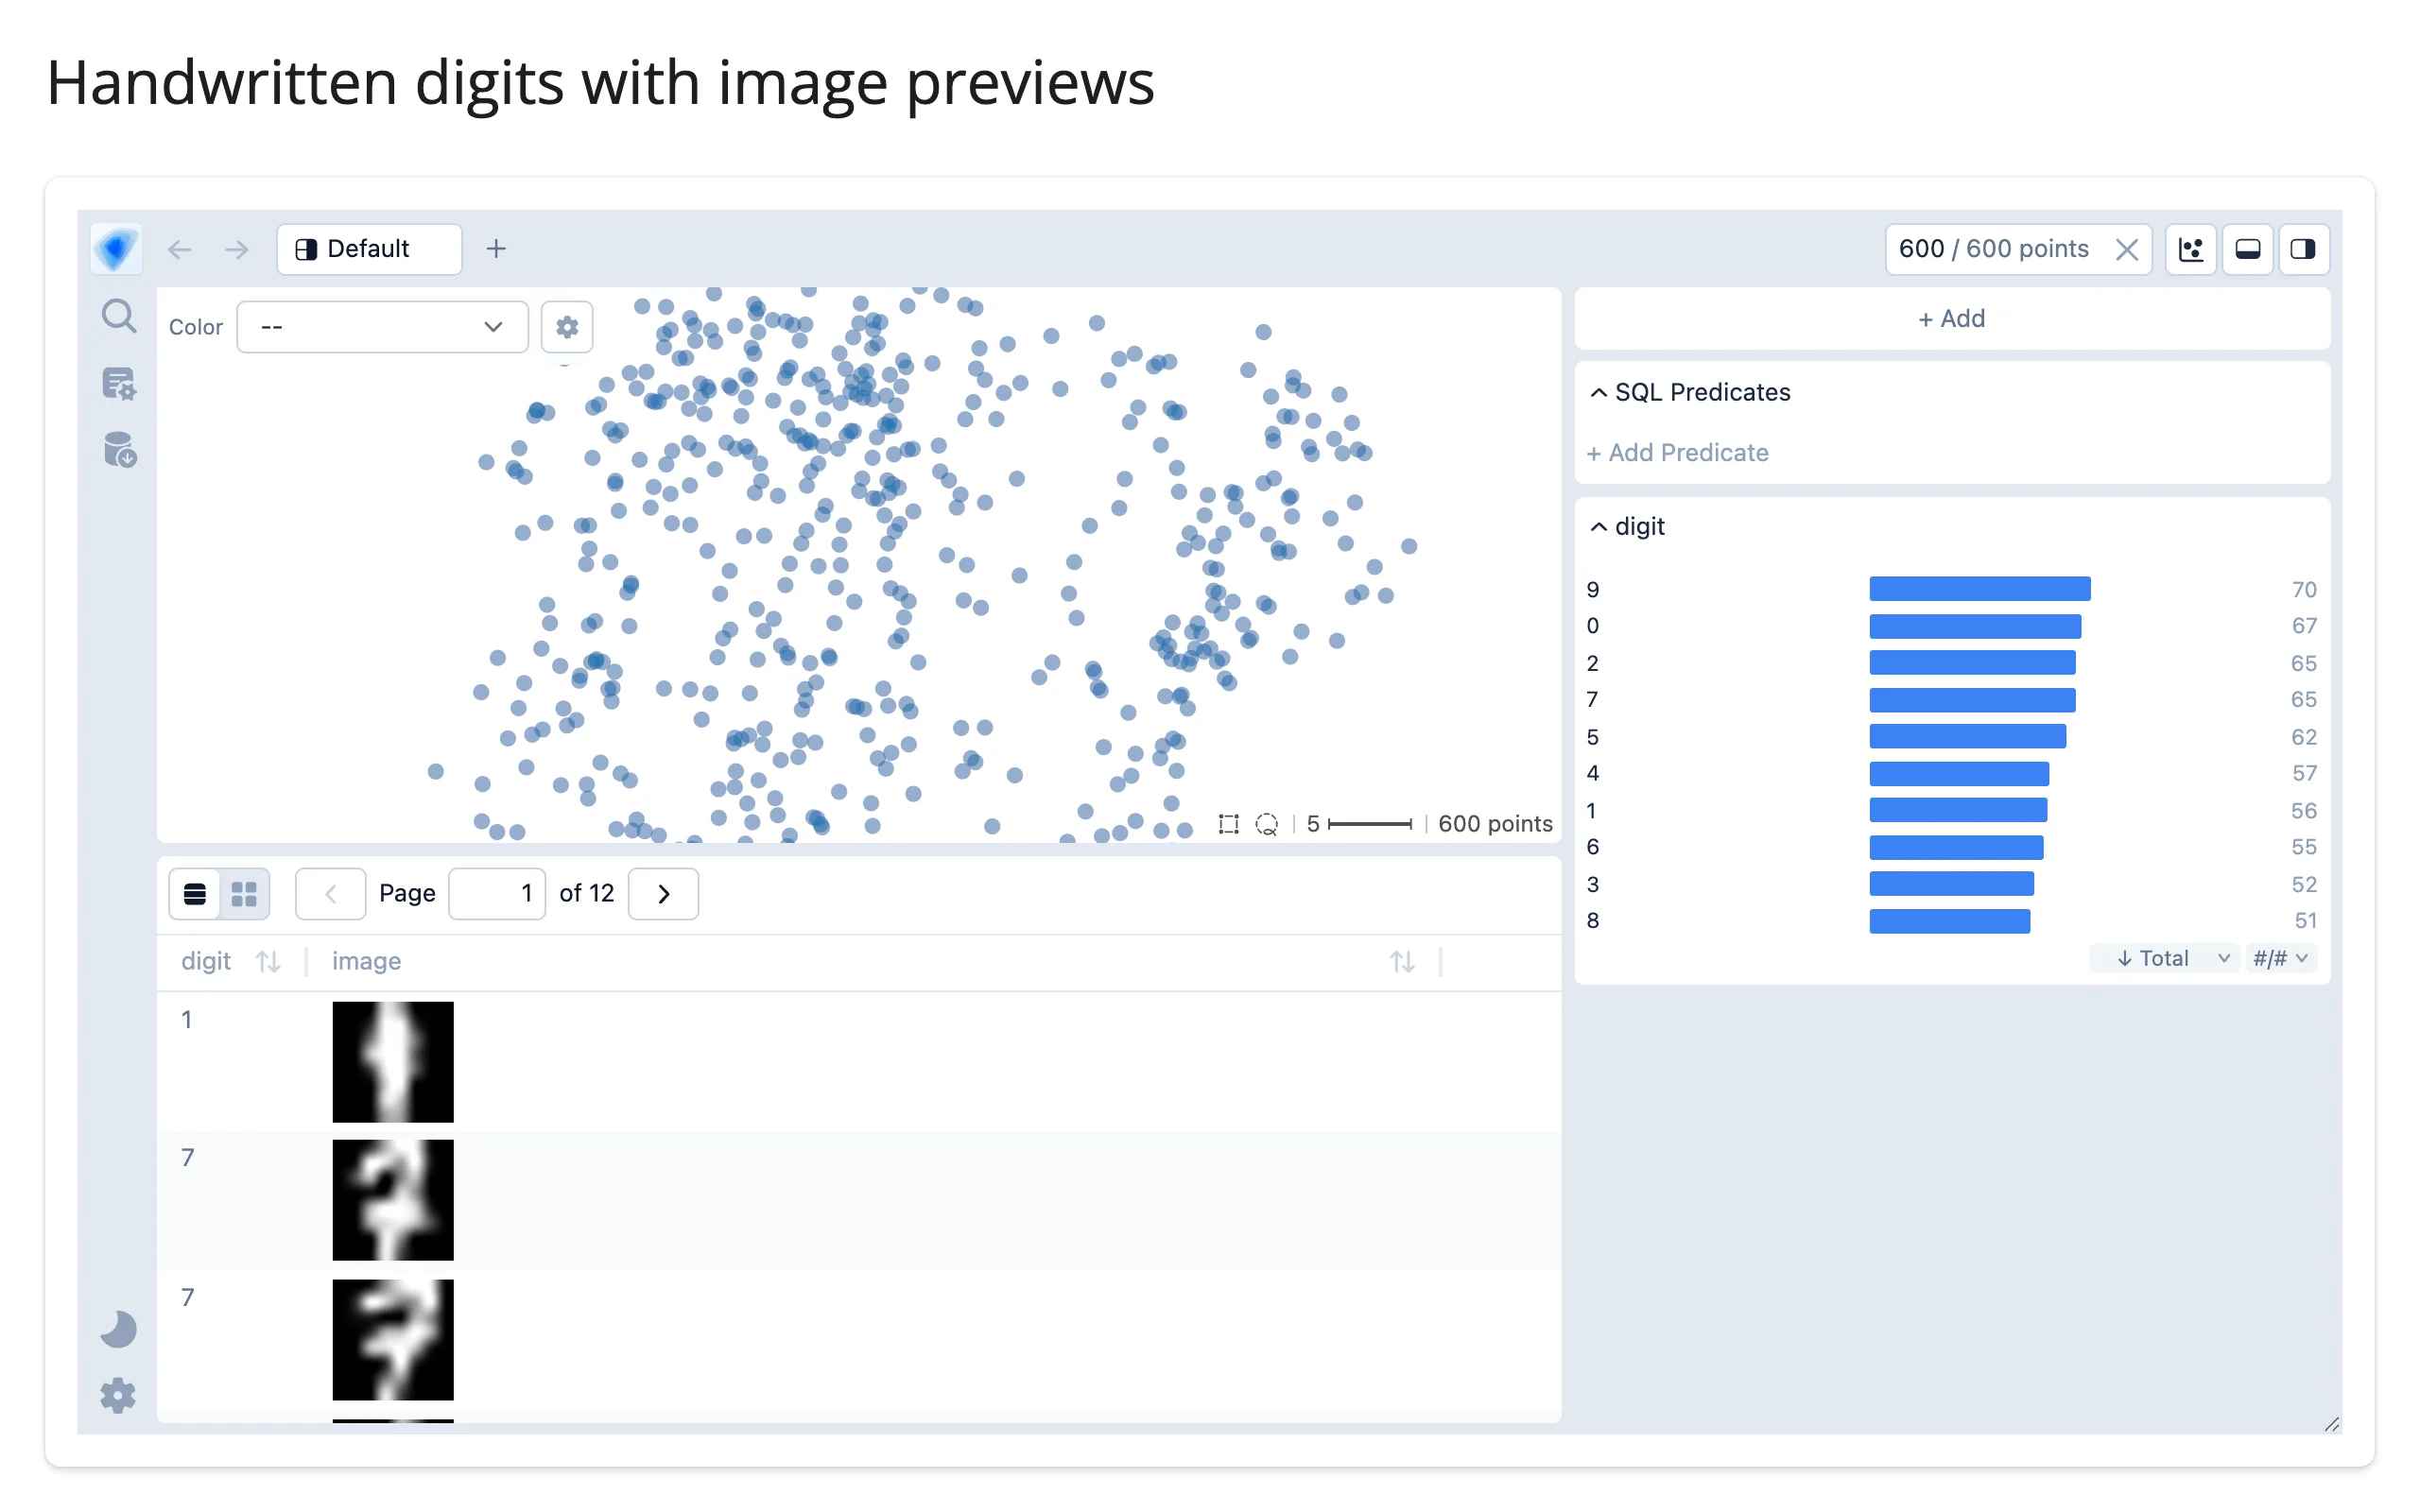
The digit thumbnails appear right in the table rows, resized and legible, with no client-side image-loading code of your own.
Reacting to user interaction
Every chart click, shift-drag box, lasso, and typed SQL predicate the user builds in the explorer funnels into one place: the widget’s (upstream-internal) _predicate trait, a DuckDB WHERE expression. predicate() exposes that expression directly; selected() re-runs it against the widget’s own DuckDB connection and hands you the matching rows. Both read from the same debounced, published value, so they always describe the same filter – even mid-debounce, before the widget’s own live trait has settled.
Accessor reference
| accessor | returns | before any interaction | across re-render | default rate policy |
|---|---|---|---|---|
predicate() |
str \| None (a DuckDB boolean expression) |
seeded None: nothing is filtered |
re-seeded from the new explorer | debounce, 250 ms |
selected() |
the same frame type (pandas/polars/pyarrow) the widget was built from, plus a __row_index__ column |
seeded; all rows while nothing is filtered (library semantics) | re-seeded, following predicate() |
debounce, 250 ms (shares predicate()’s window) |
Both accessors raise RuntimeError with a specific message if you try to read them inside their own render function (see Gotchas) and otherwise behave like reactive_read()-backed values: reading one before the explorer has ever rendered cancels the current reactive context (req(False)), the way .widget does. Both describe the explorer’s current cross-filter, not a memory of past interaction, so a re-render always re-seeds them from the new explorer’s own (unfiltered) state – there’s nothing carried over from before the re-render to reset or preserve.
predicate(): push the filter into a query of your own
examples/05_predicate_query.py
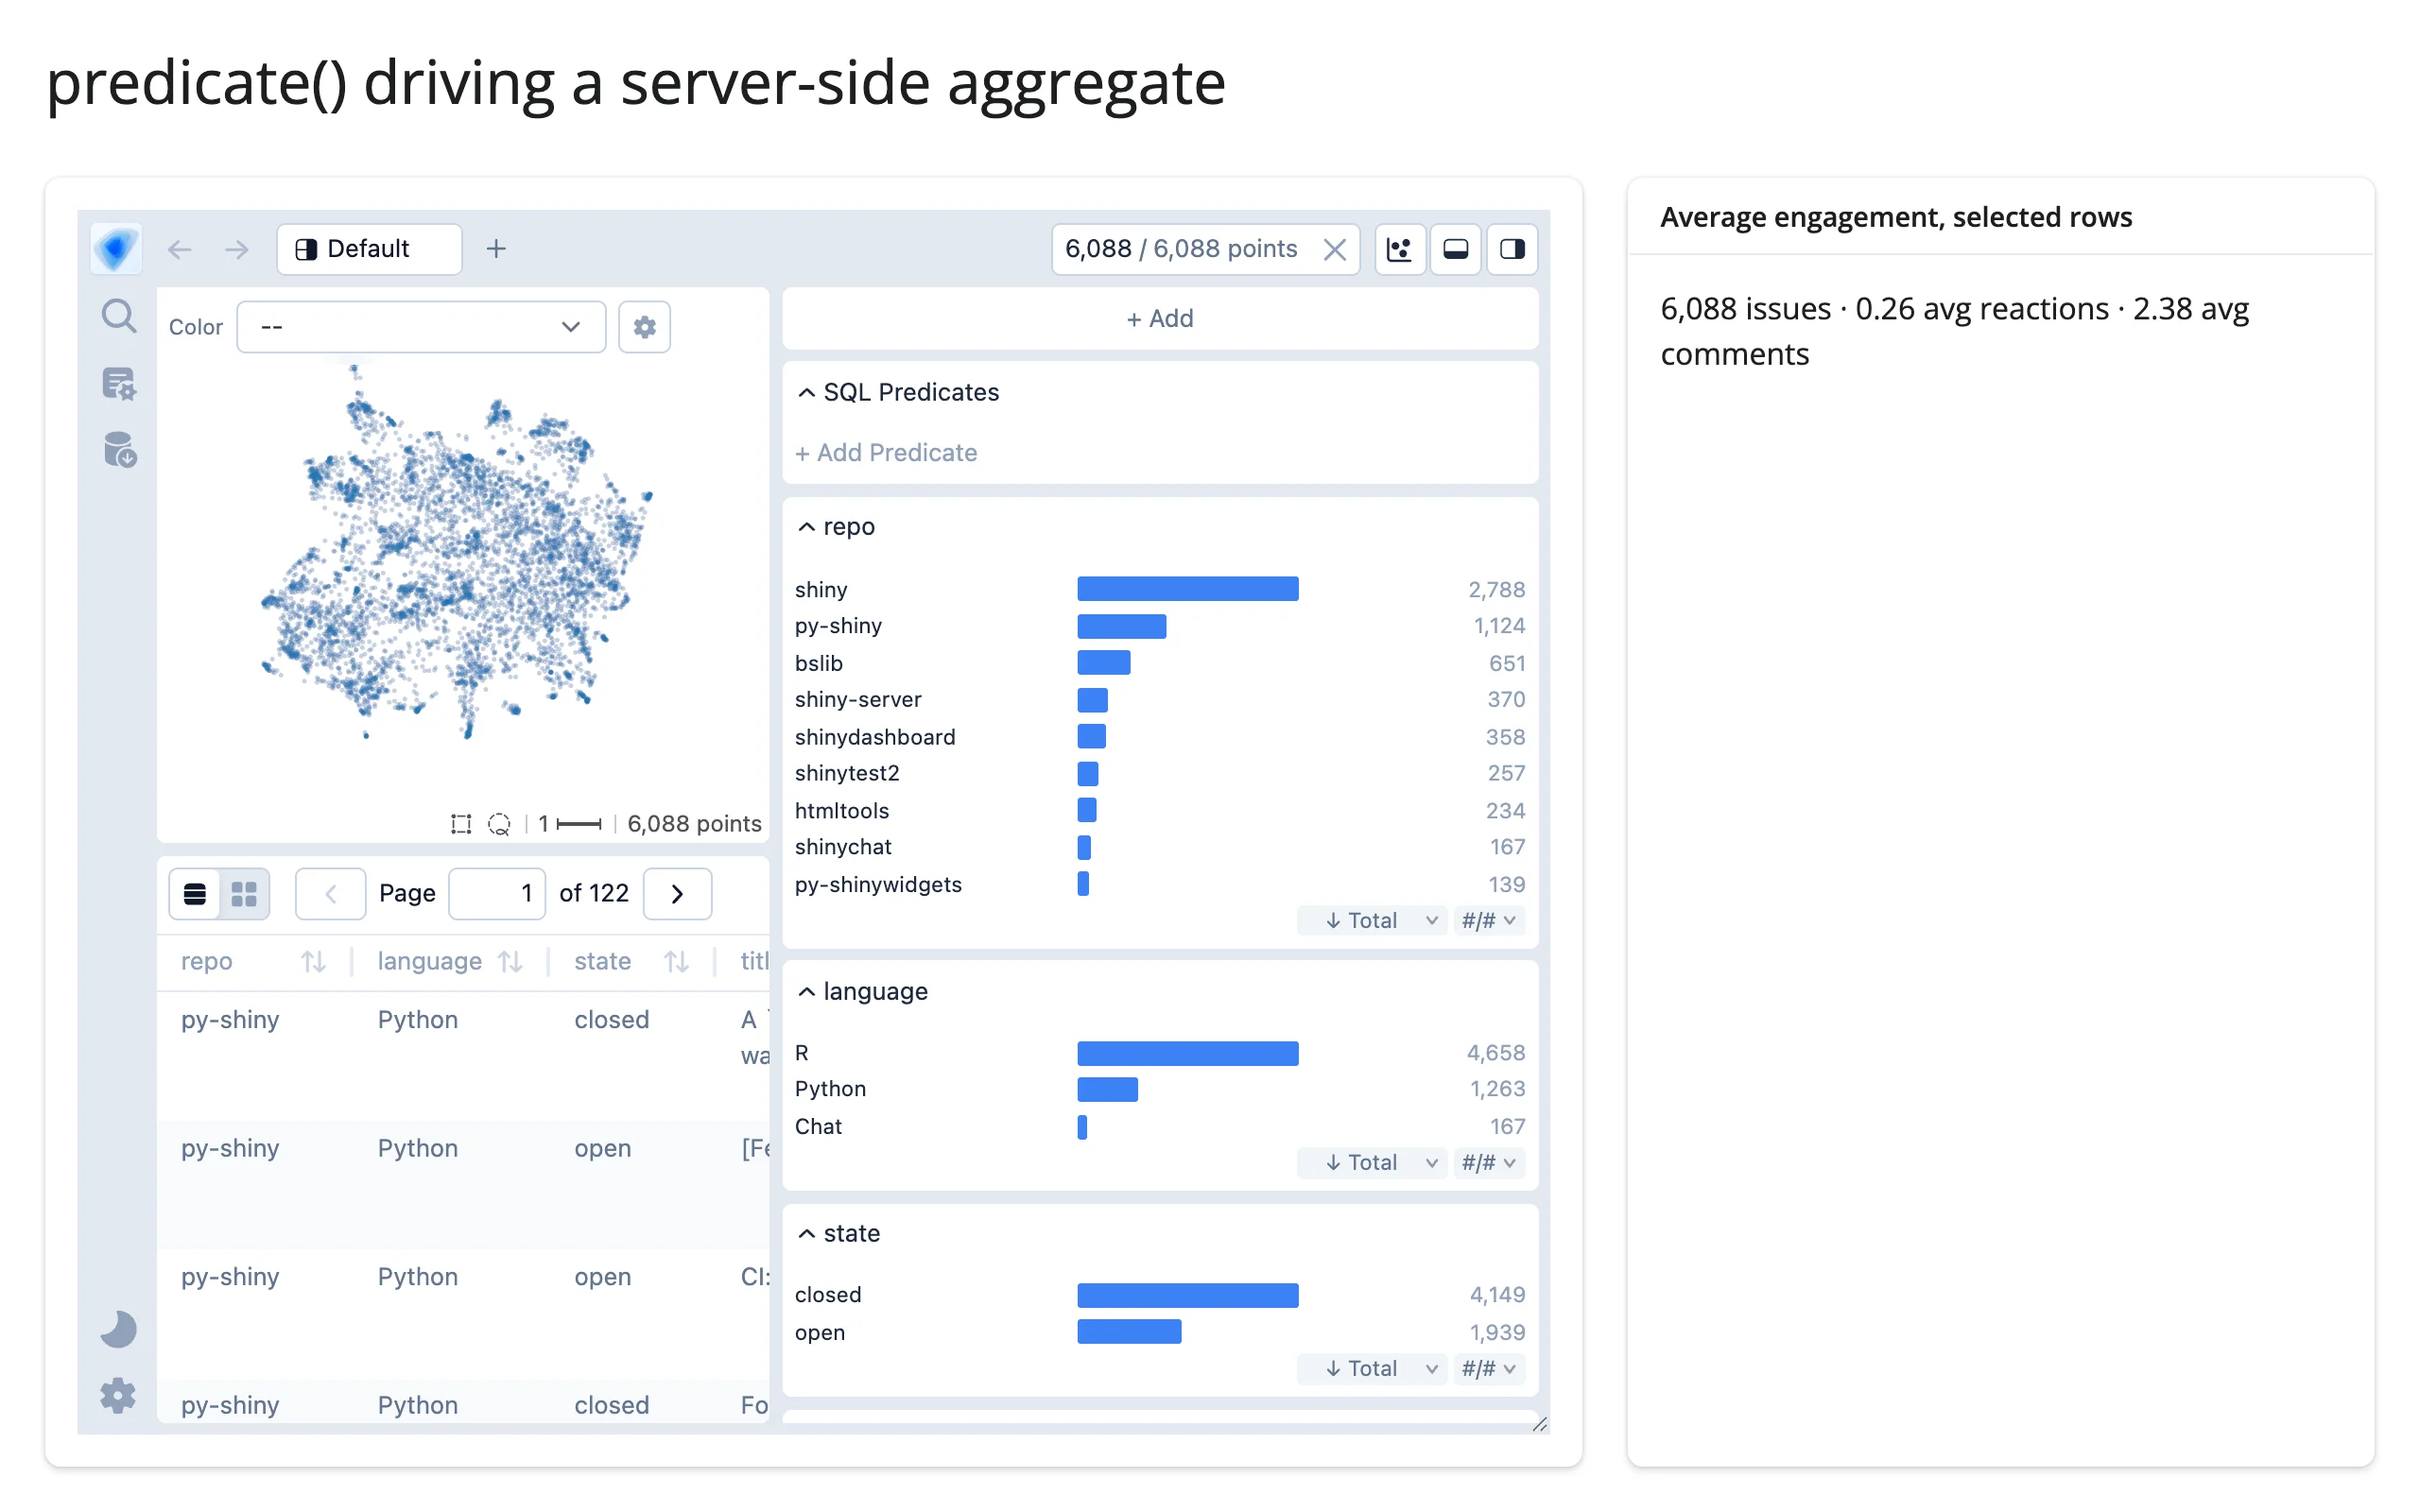
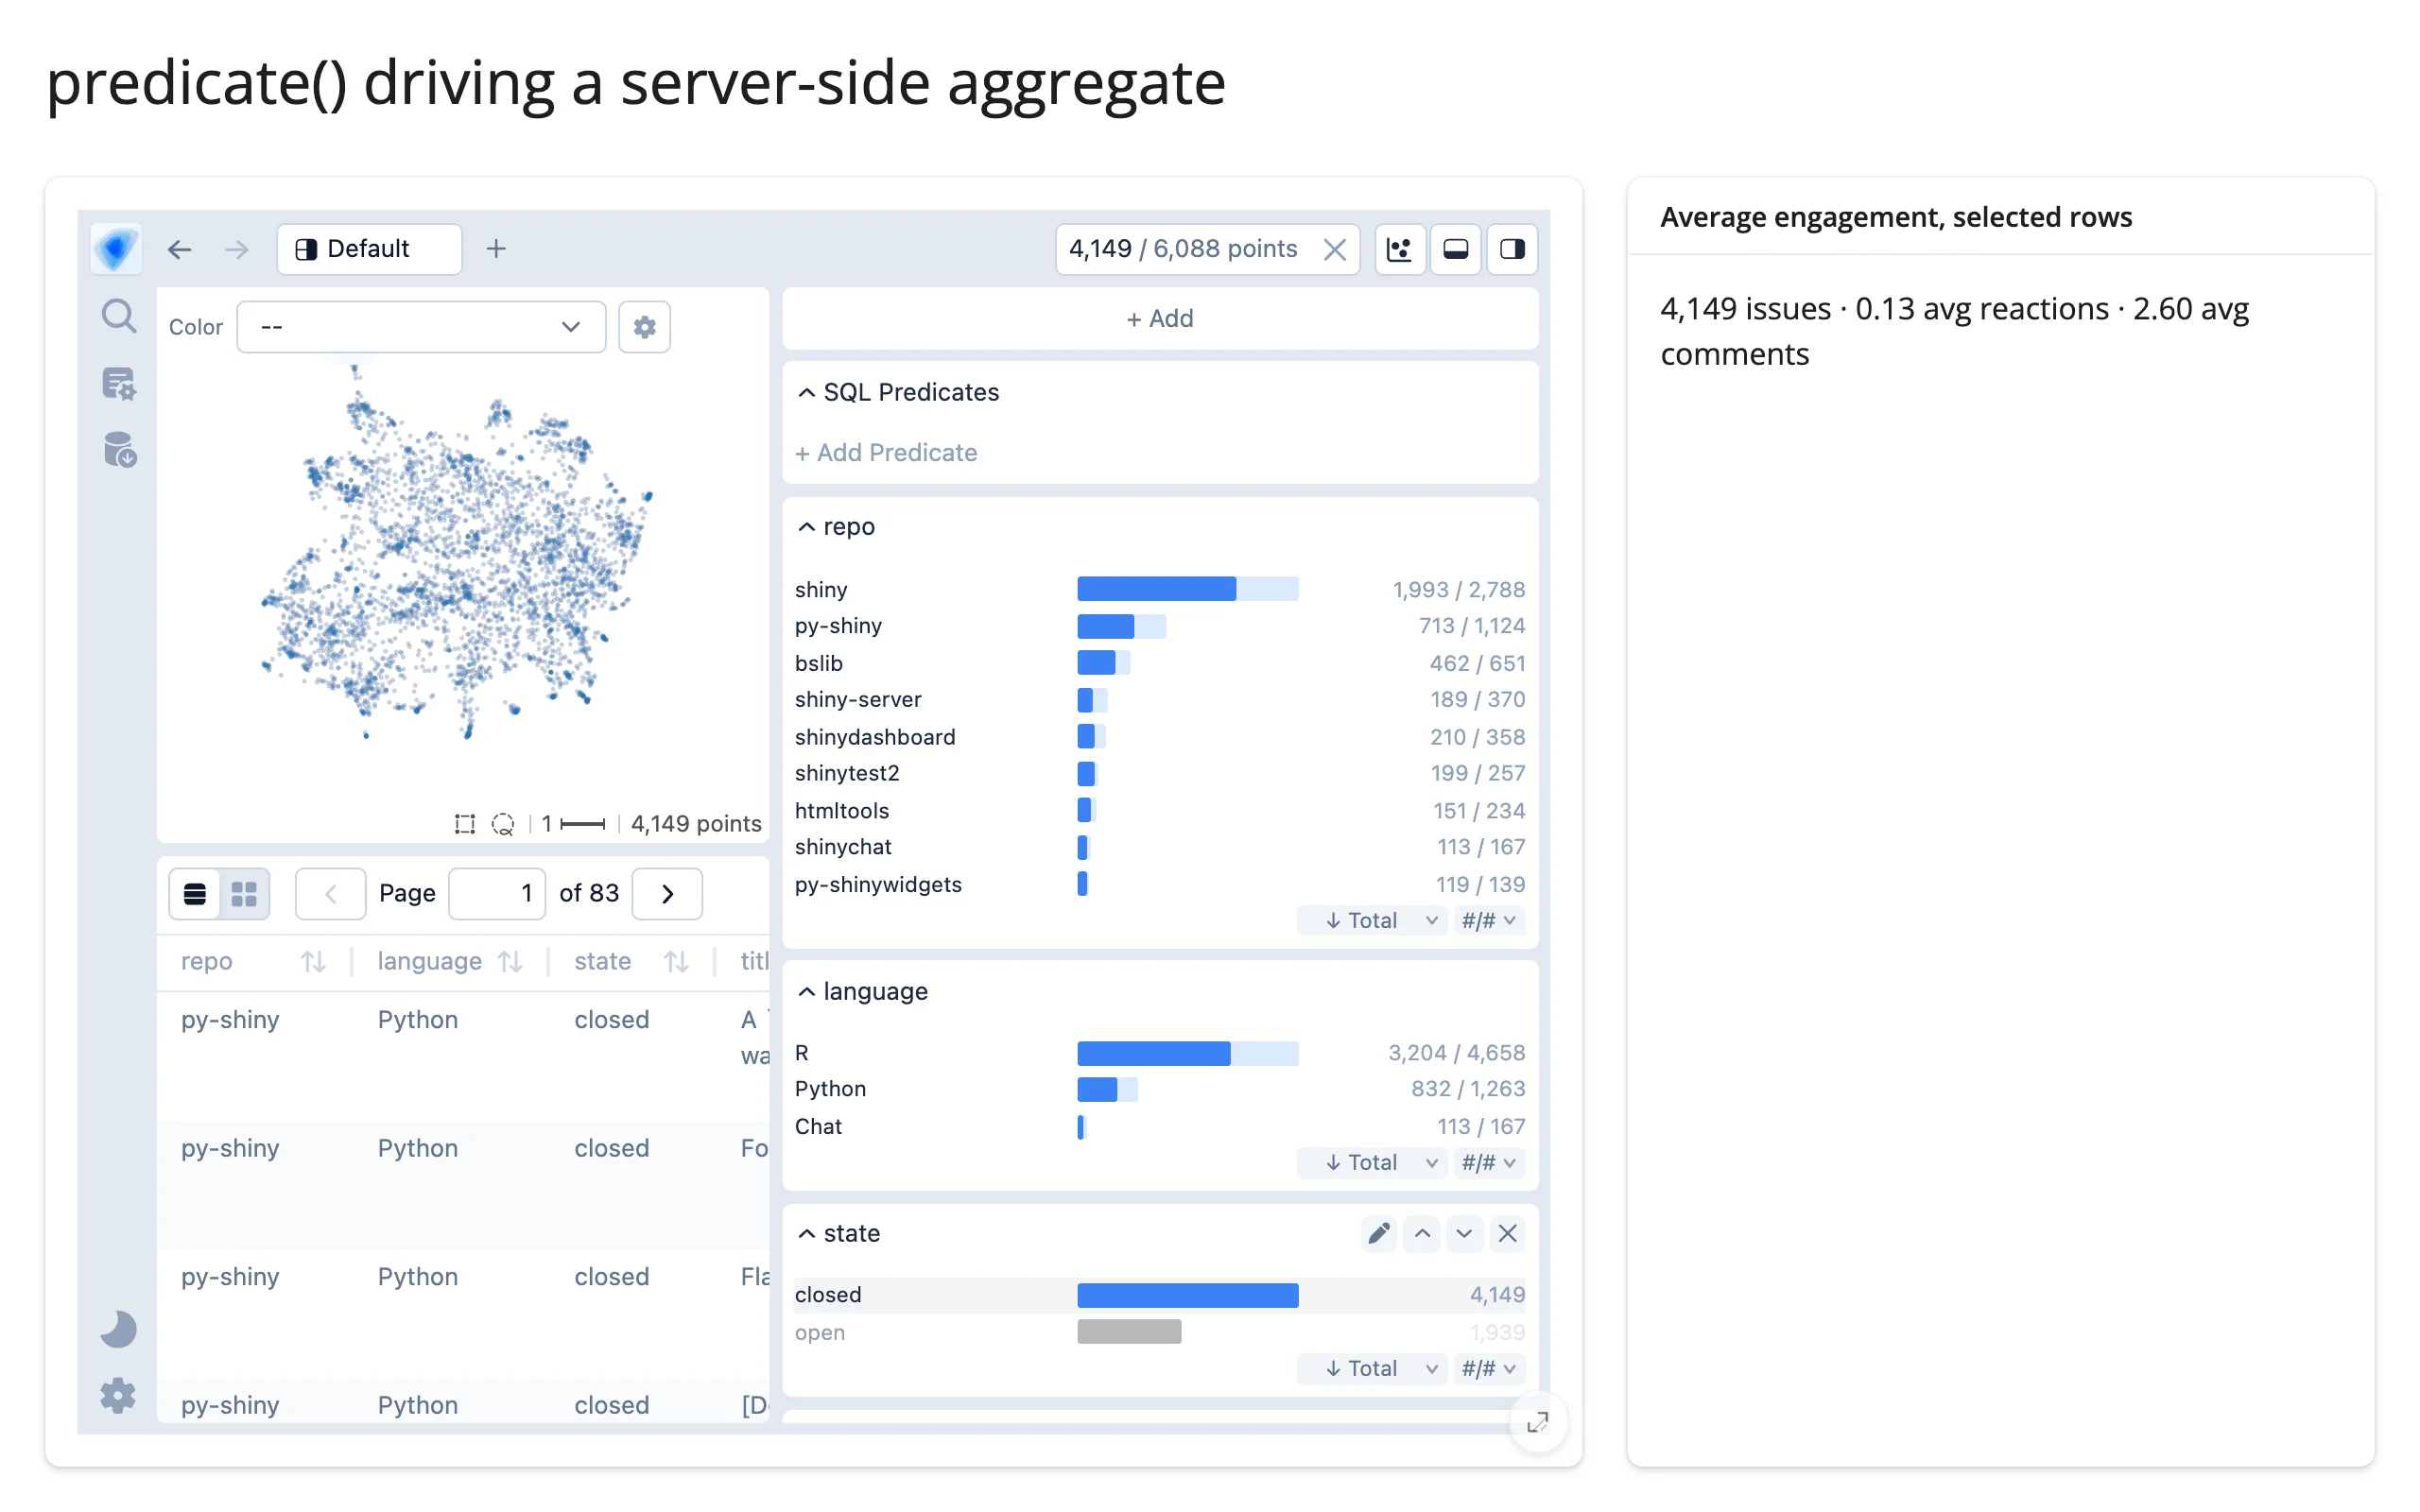
predicate() is a SQL fragment over the exact column names the widget was built from, so you can run your own aggregate against it – useful when you want a number, not the rows themselves, and would rather not materialize them in Python first. This example applies it against a second DuckDB connection over the same data frame, kept separate from the widget’s own locked-down connection (examples/05_predicate_query.py):
# predicate() is the cross-filter as a DuckDB WHERE expression, so you can
# push it into a query of your own instead of pulling the rows into Python
# first. Here it drives a server-side aggregate (average reactions) over a
# duckdb connection that's separate from the widget's own.
from pathlib import Path

import duckdb
import pandas as pd
from embedding_atlas.widget import EmbeddingAtlasWidget
from shiny.express import render, ui
from shinywidgets import render_embedding_atlas

ISSUES = pd.read_parquet(Path(__file__).parent / "data" / "issues.parquet")
COLUMNS = ["repo", "language", "state", "title", "text", "comments", "reactions", "projection_x", "projection_y"]  # fmt: skip

# `.register()` returns the connection; keep that as an assignment, not a
# bare statement -- shiny.express would otherwise treat its non-None result
# as a UI child, like it would a bare module-level docstring
con = duckdb.connect().register("issues", ISSUES)

ui.page_opts(title="predicate() driving a server-side aggregate", fillable=True)

with ui.layout_columns(col_widths=[8, 4]):
    with ui.card(full_screen=True):

        @render_embedding_atlas
        def atlas():
            return EmbeddingAtlasWidget(
                ISSUES[COLUMNS], x="projection_x", y="projection_y", text="text"
            )

    with ui.card():
        ui.card_header("Average engagement, selected rows")

        @render.text
        def stat():
            where = atlas.predicate()
            clause = f"WHERE {where}" if where else ""
            n, reactions, comments = con.sql(
                f"SELECT count(*), avg(reactions), avg(comments) FROM issues {clause}"
            ).fetchone()
            return f"{n:,} issues · {reactions:.2f} avg reactions · {comments:.2f} avg comments"
Before any filter, and after clicking the “closed” bar in the state chart:
selected(): the filtered rows, as a detail table
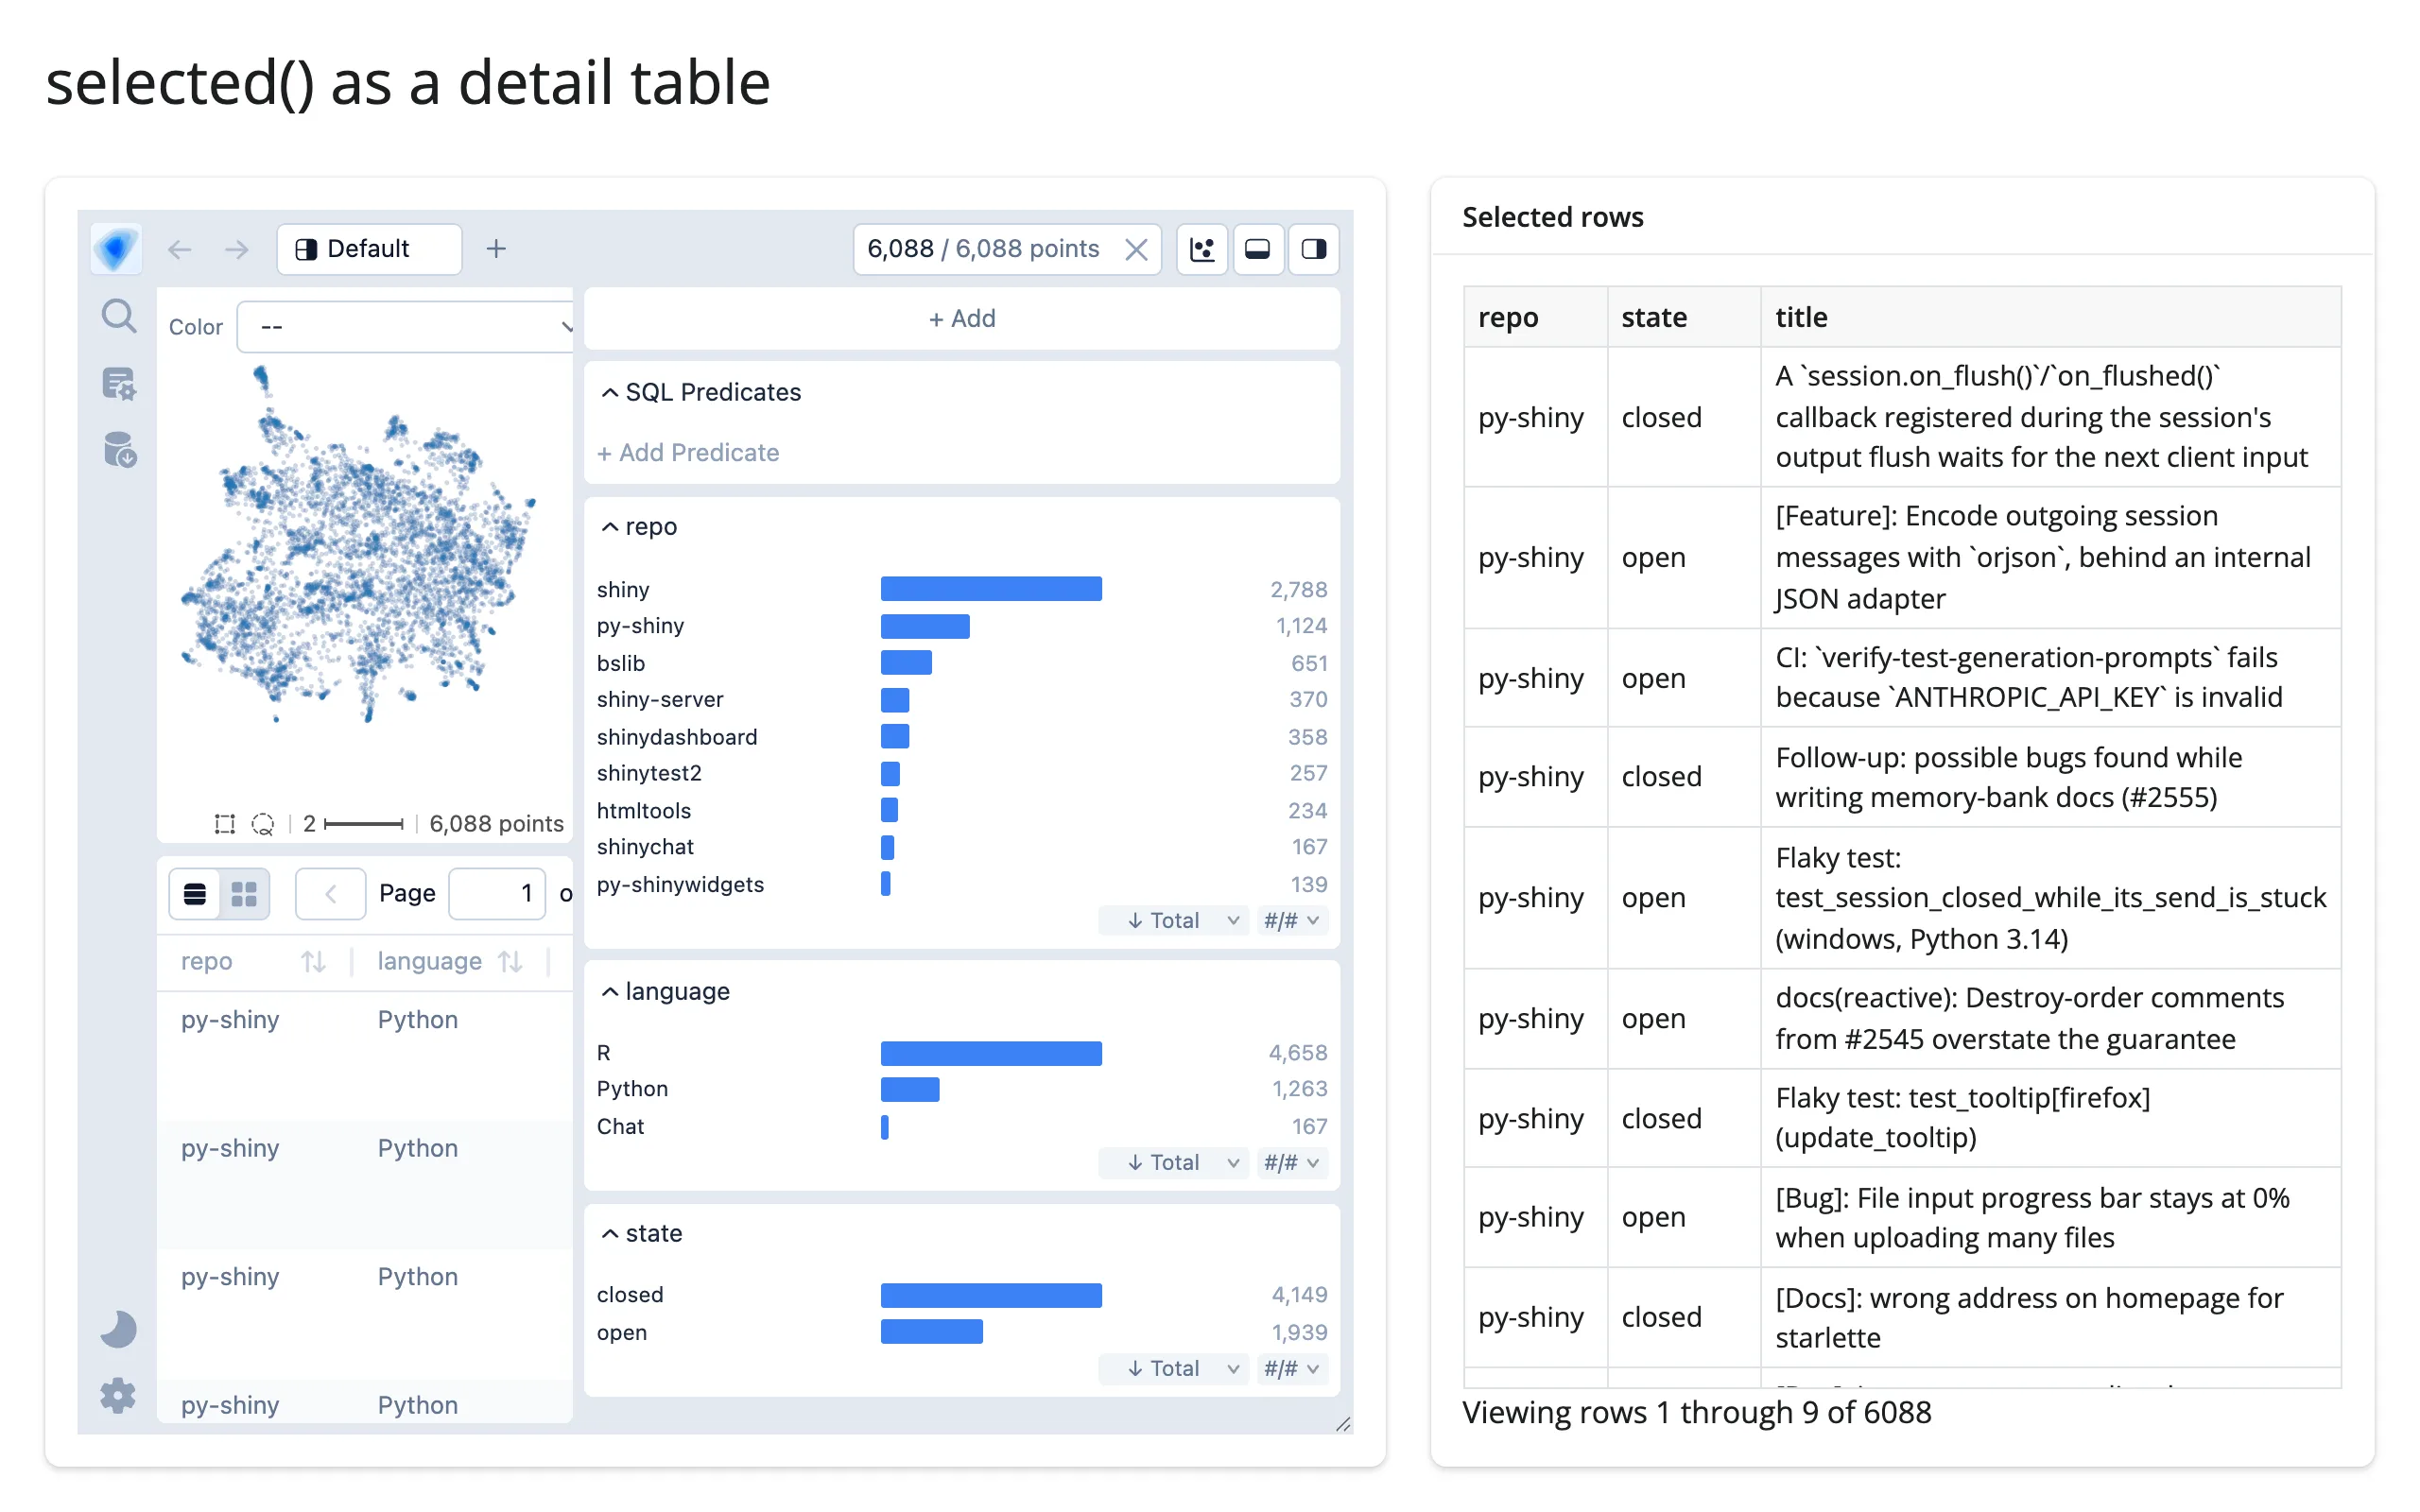
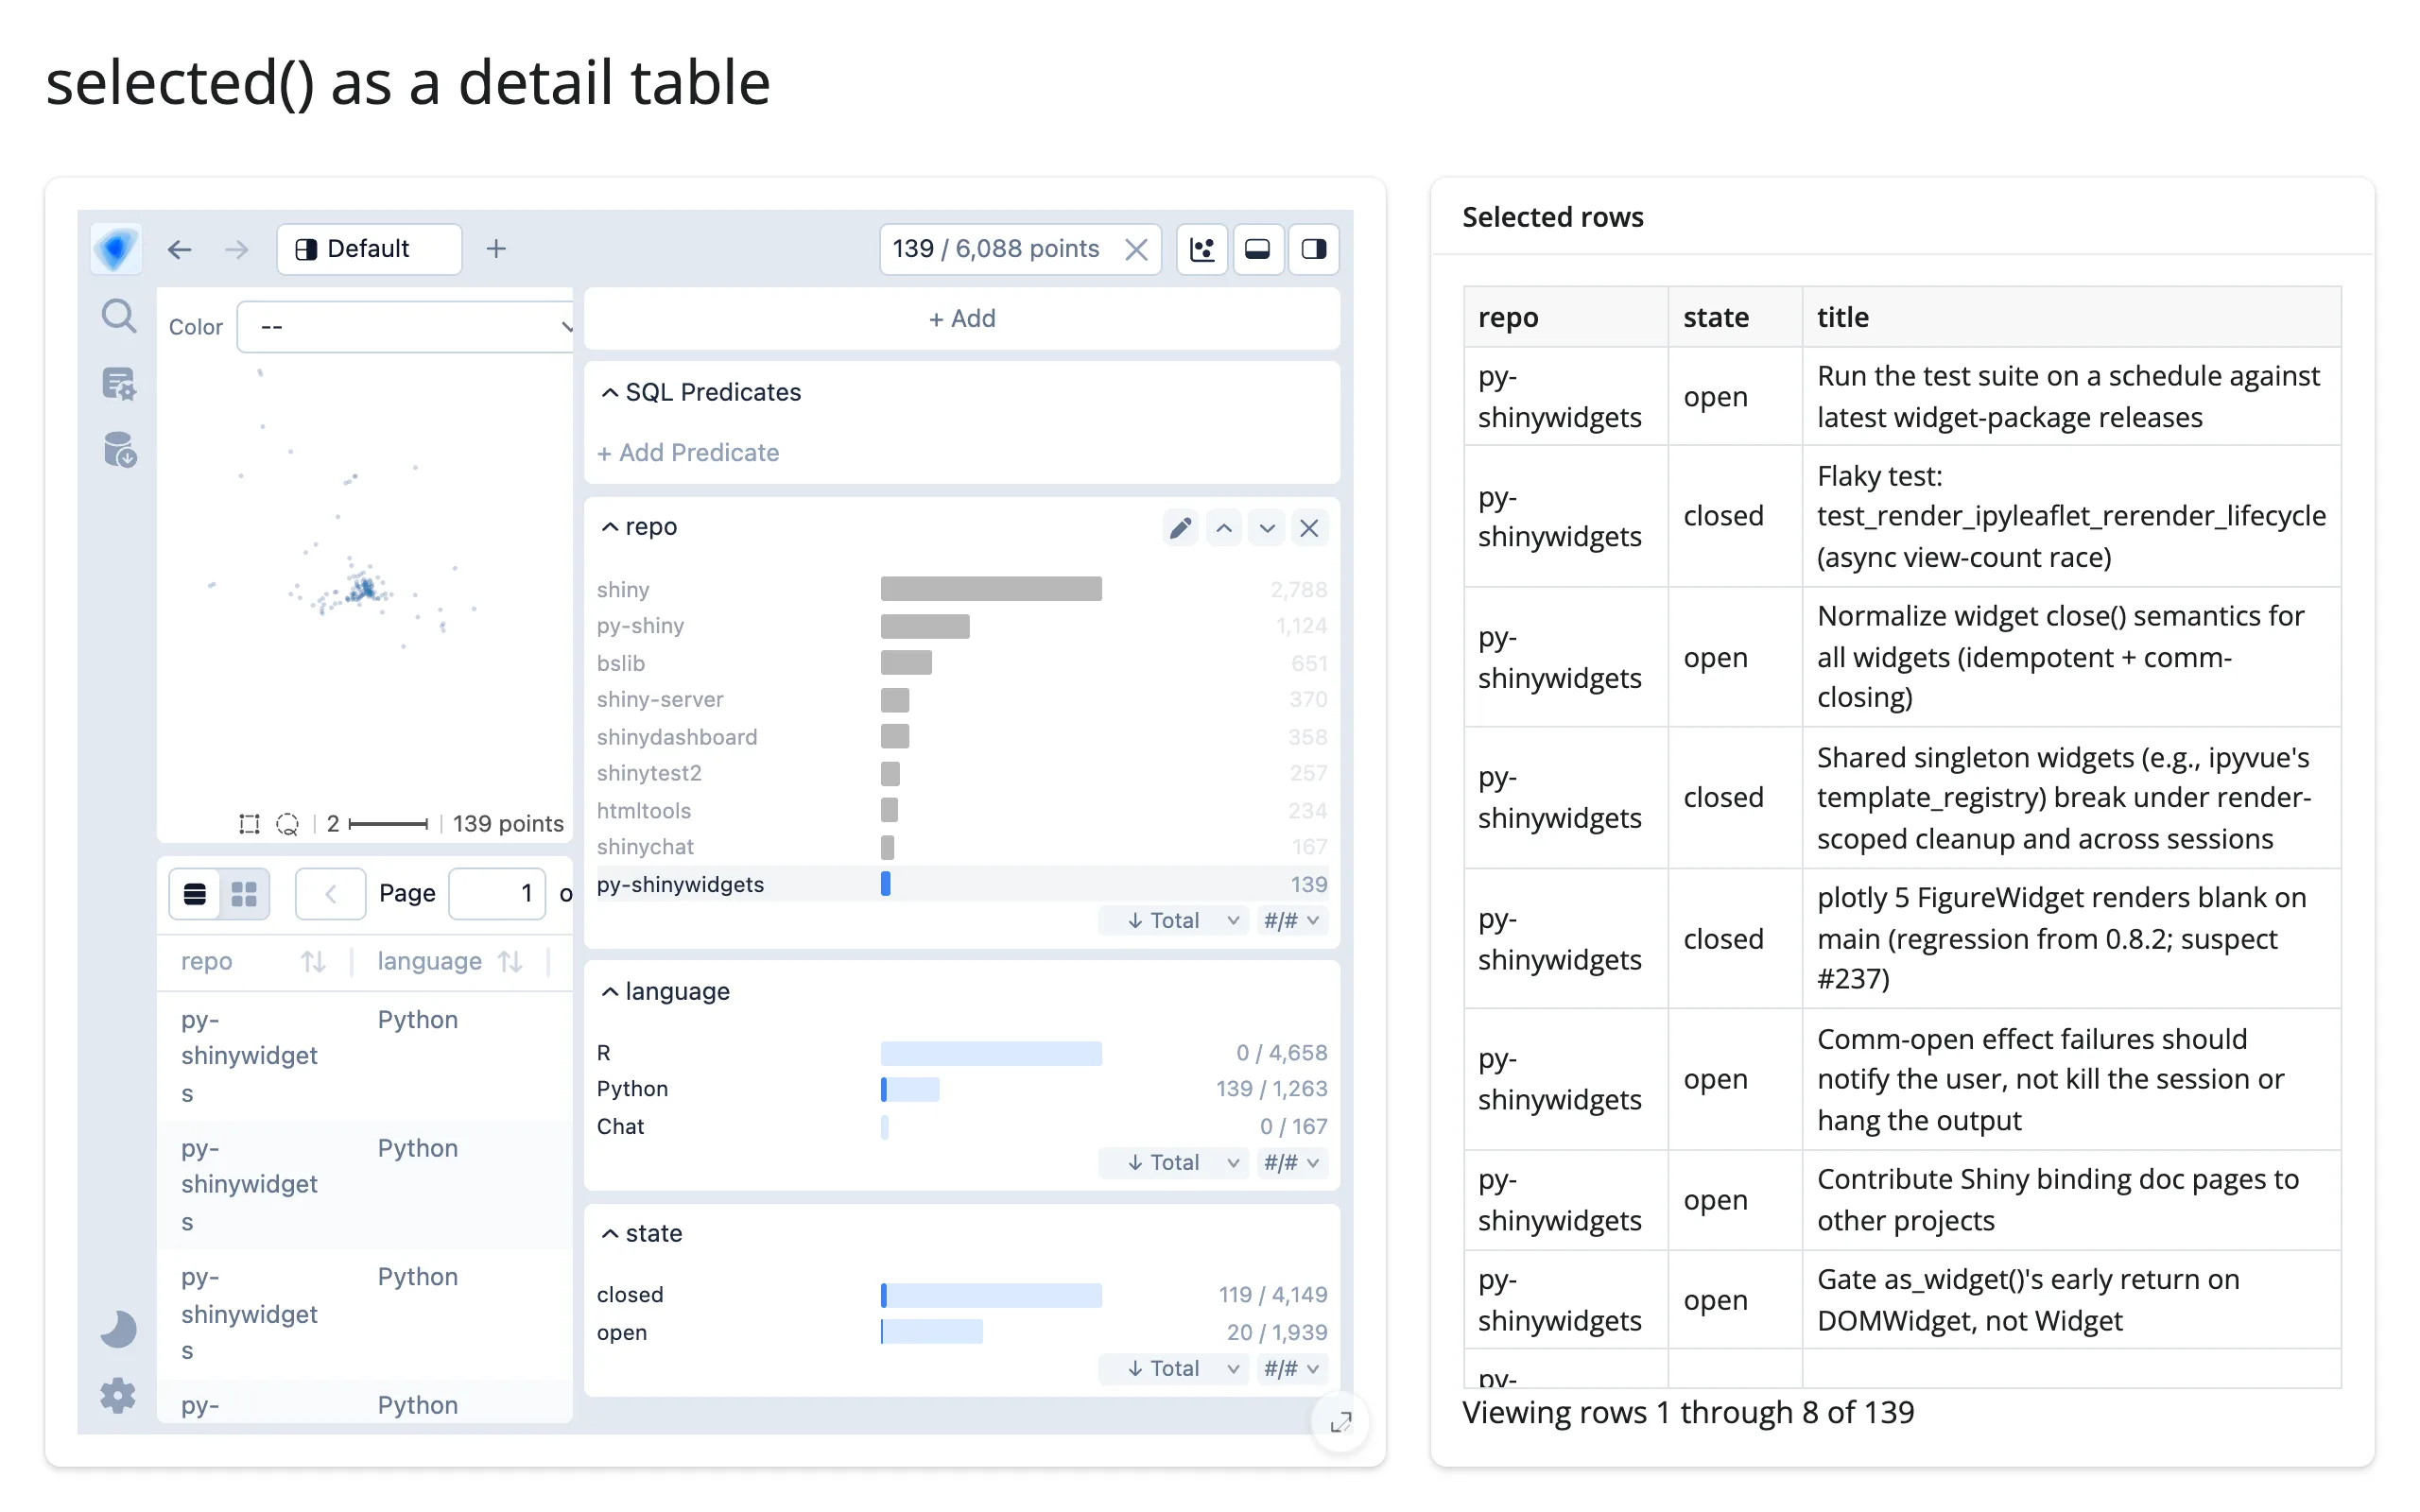
# selected() returns the rows passing the current cross-filter, as the same
# frame type (here pandas) the widget was built from -- a detail table for
# exactly what the user selected, with no SQL of your own to write.
from pathlib import Path

import pandas as pd
from embedding_atlas.widget import EmbeddingAtlasWidget
from shiny.express import render, ui
from shinywidgets import render_embedding_atlas

ISSUES = pd.read_parquet(Path(__file__).parent / "data" / "issues.parquet")
COLUMNS = ["repo", "language", "state", "title", "text", "projection_x", "projection_y"]  # fmt: skip

ui.page_opts(title="selected() as a detail table", fillable=True)

with ui.layout_columns(col_widths=[7, 5]):
    with ui.card(full_screen=True):

        @render_embedding_atlas
        def atlas():
            return EmbeddingAtlasWidget(
                ISSUES[COLUMNS], x="projection_x", y="projection_y", text="text"
            )

    with ui.card(full_screen=True):
        ui.card_header("Selected rows")

        @render.data_frame
        def table():
            sel = atlas.selected()
            return sel[["repo", "state", "title"]].reset_index(drop=True)
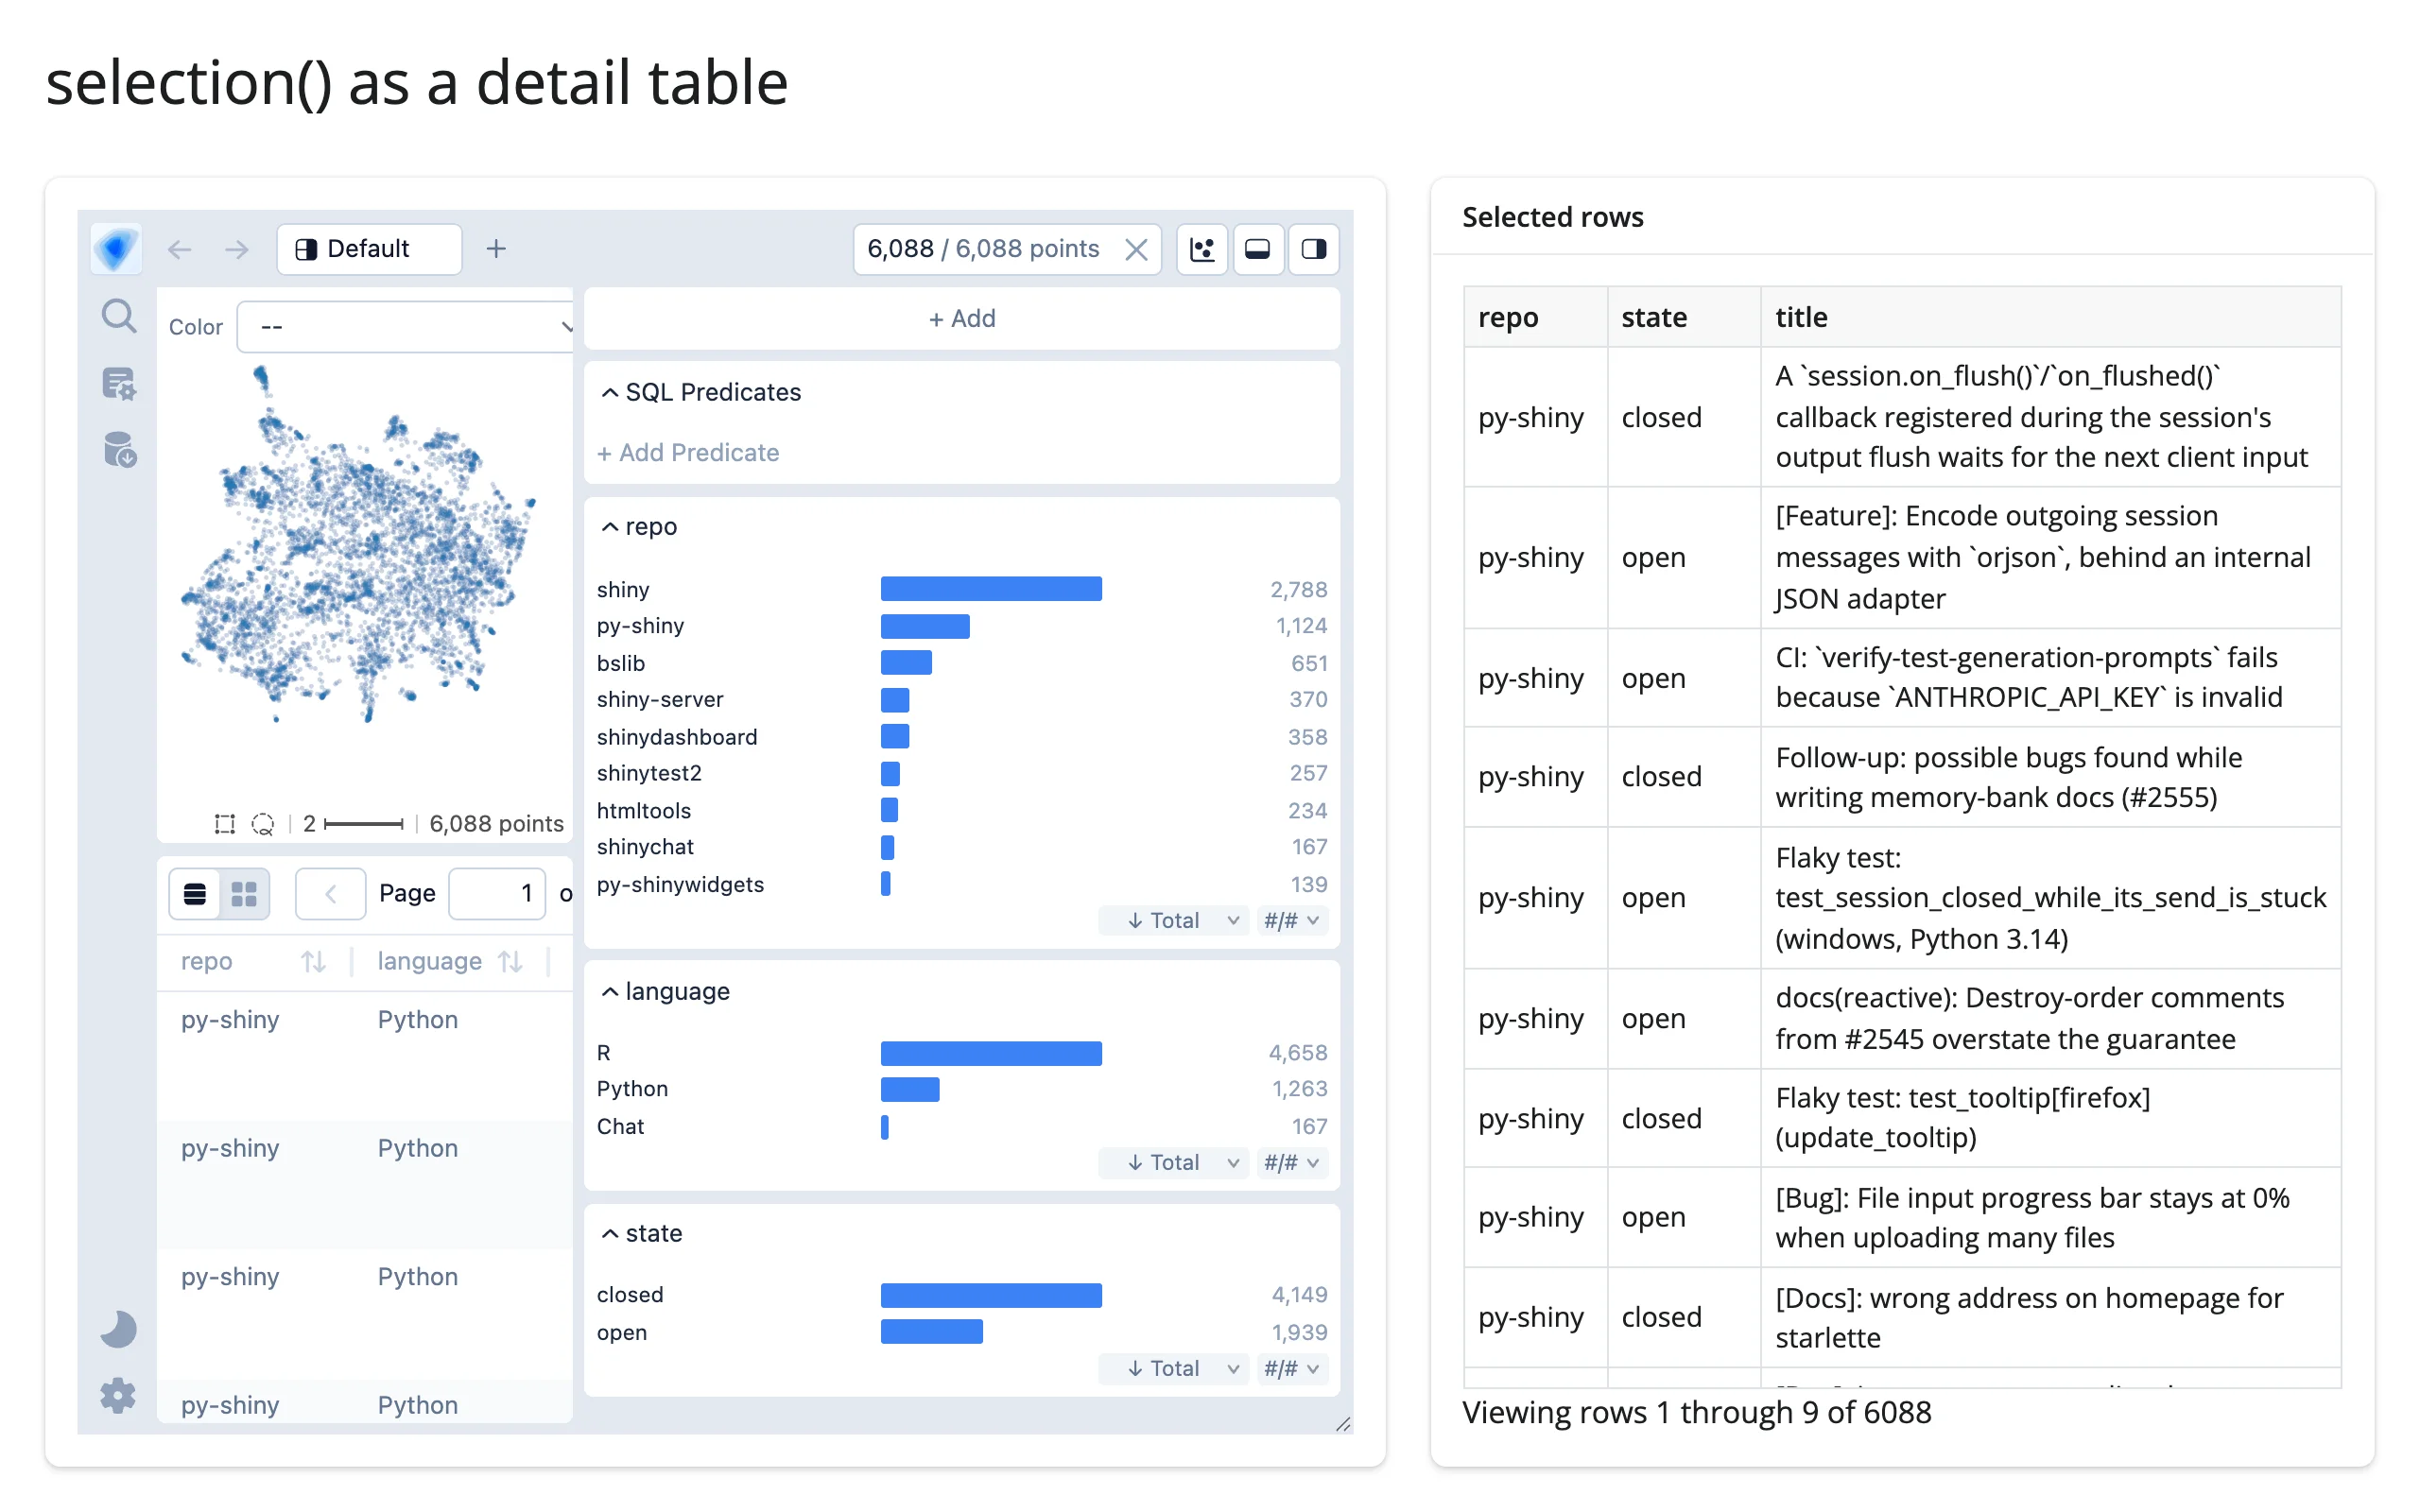
Before any filter (all 6,088 rows), and after clicking the “py-shinywidgets” bar in the repo chart (139 rows):
selected() runs a DuckDB query every time it’s read, so read it once into a @reactive.calc if several outputs need the same selection (as the gallery template does), rather than calling it from each one.
Driving it from the map itself
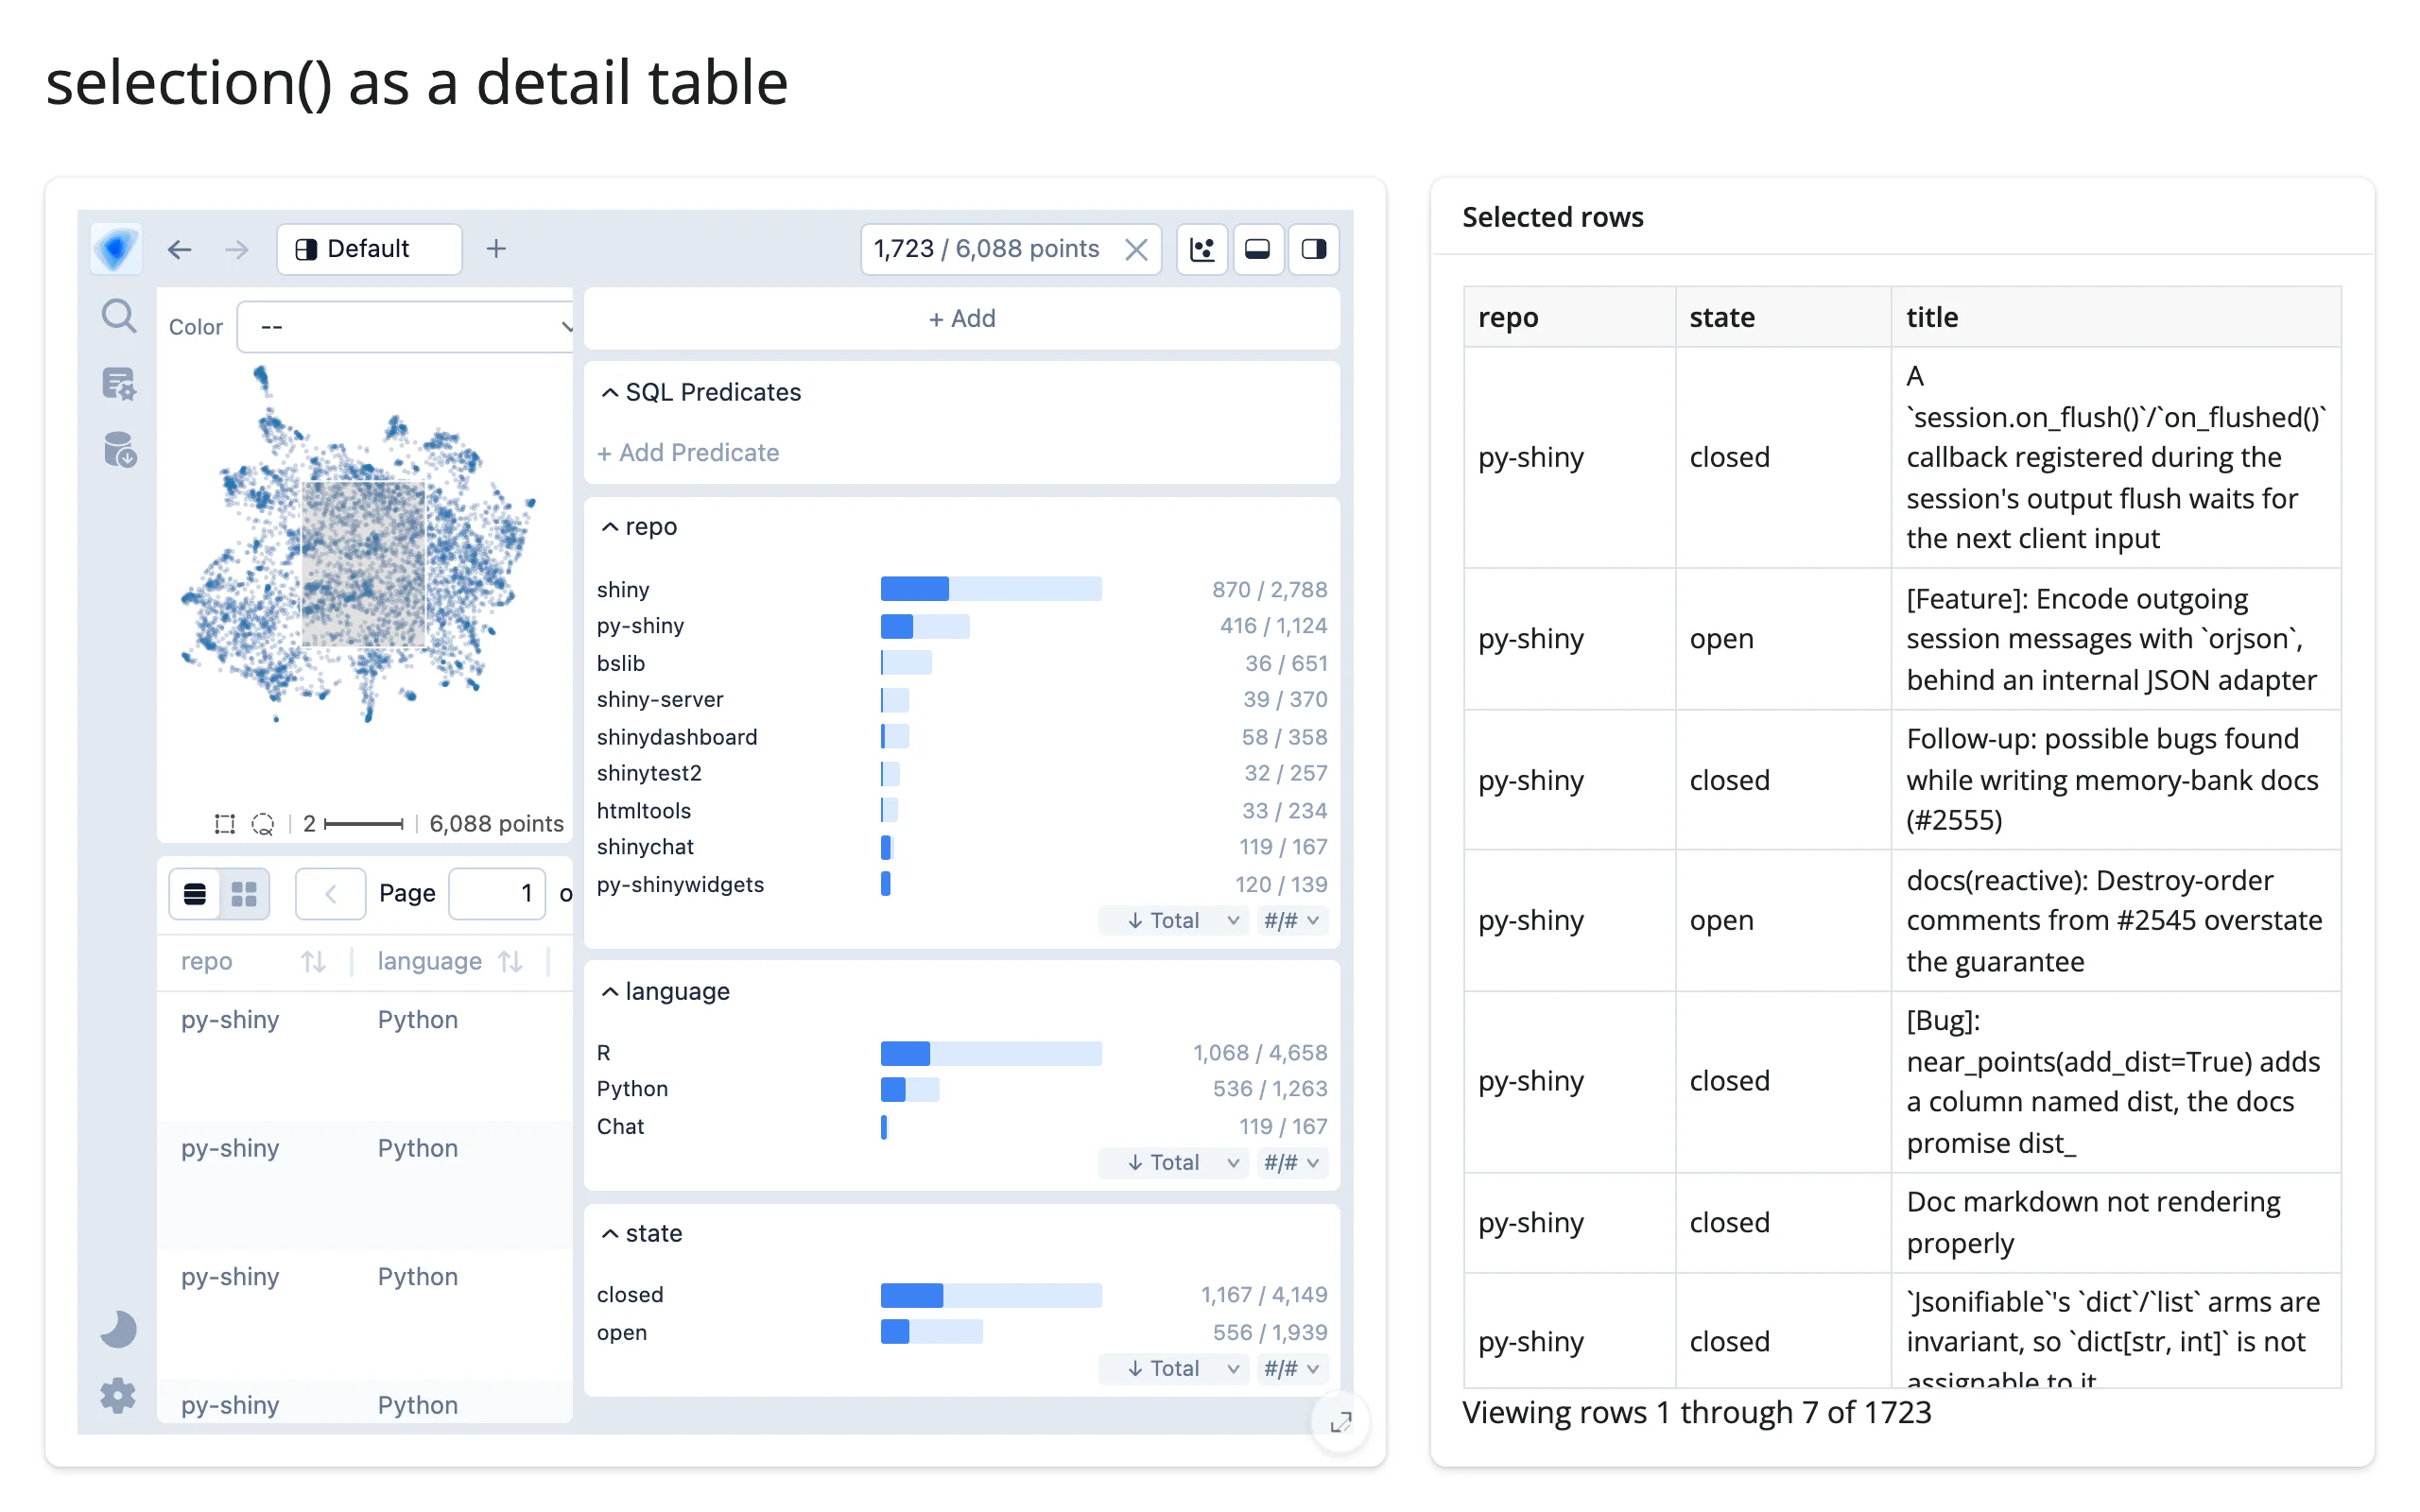
Every example so far clicks a chart bar, since that’s the gesture a browser without WebGPU can still make. The same two accessors answer to the embedding canvas’s own gestures too – shift-drag for a box, shift+⌘-drag (Ctrl on non-Mac) for a lasso – because both update the same _predicate trait. Shift-dragging a box over the dense center of examples/06_selection_table.py’s map narrows it from 6,088 to 1,723 points, and the linked table updates exactly as it does for a bar click:
Beyond the accessors: atlas.read("_state")
The only other trait worth reading directly is _state – the explorer’s full UI state (coloring, active charts, viewport, and the current filter) as a JSON string, synced from the browser the same way _predicate is. It’s not wrapped in an accessor because on its own it’s not something you’d react to; its job is letting you carry the view across a re-render (atlas.read("_state"), which falls through to reactive_read() on the rendered widget – prefer it over calling reactive_read(atlas.widget, "_state") directly), covered next.
Rate limiting
Both accessors debounce at 250 ms by default, because a dragging box or lasso streams many intermediate filter values, and each one costs a DuckDB query if you’re reading selected(). Pass rate_policy="throttle" to @render_embedding_atlas(...) for a steady trickle of updates during a long drag instead of one at the end, or rate_delay=0 to react to every intermediate value (only worth it for cheap downstream work). Both keyword arguments also apply to atlas.read()/reactive_read() on the widget’s own traits, including _state.
Updating the widget from Python
The explorer ignores trait changes made from Python: setting atlas.widget._predicate or atlas.widget._props from a @reactive.effect has no visible effect, because the frontend only listens for browser-driven changes to sync outward, not for Python-driven changes to apply inward (verified: after setting _predicate directly, the point count stays unchanged – “6,088 / 6,088 points” either way). Re-rendering is the only way to change what the explorer shows.
A plain re-render throws away the user’s pan, zoom, coloring, and filter, though. _state round-trips that whole view as JSON, so capturing it in a reactive.value and passing it back as initial_state on the next render carries it forward:
# The explorer ignores trait changes made from Python (setting
# `atlas.widget._predicate` or `._props` has no visible effect; there's no
# `change:_props` listener wired up for it on the frontend), so the only way
# to change what it shows is a re-render. A plain re-render would reset the
# user's pan/zoom/filter/coloring, though -- `_state` round-trips that view as
# JSON, so capturing it and passing it back as `initial_state` carries it
# across the data change below.
import json
from pathlib import Path

import pandas as pd
from embedding_atlas.widget import EmbeddingAtlasWidget
from shiny import reactive
from shiny.express import input, render, ui
from shinywidgets import render_embedding_atlas

ISSUES = pd.read_parquet(Path(__file__).parent / "data" / "issues.parquet")
COLUMNS = ["repo", "language", "state", "title", "text", "projection_x", "projection_y"]  # fmt: skip
REPOS = ["All repos", *sorted(ISSUES["repo"].unique())]

ui.page_opts(title="Re-render while carrying the view forward", fillable=True)
ui.input_select("repo", "Repo", REPOS)

last_state = reactive.value(None)


@reactive.effect
def _capture_state():
    s = atlas.read("_state")
    if s is not None:
        last_state.set(s)


@reactive.calc
def filtered():
    repo = input.repo()
    return ISSUES if repo == "All repos" else ISSUES[ISSUES["repo"] == repo]


with ui.card(full_screen=True):

    @render_embedding_atlas
    def atlas():
        df = filtered()
        with reactive.isolate():
            # NOT atlas.widget here: reading a renderer's own accessor/widget
            # inside its own render function cancels the render (see the
            # Gotchas section)
            prev = last_state.get()
        opts = {"initial_state": json.loads(prev)} if prev else {}
        return EmbeddingAtlasWidget(
            df[COLUMNS], x="projection_x", y="projection_y", text="text", **opts
        )

    @render.text
    def note():
        return f"{len(filtered()):,} rows loaded"
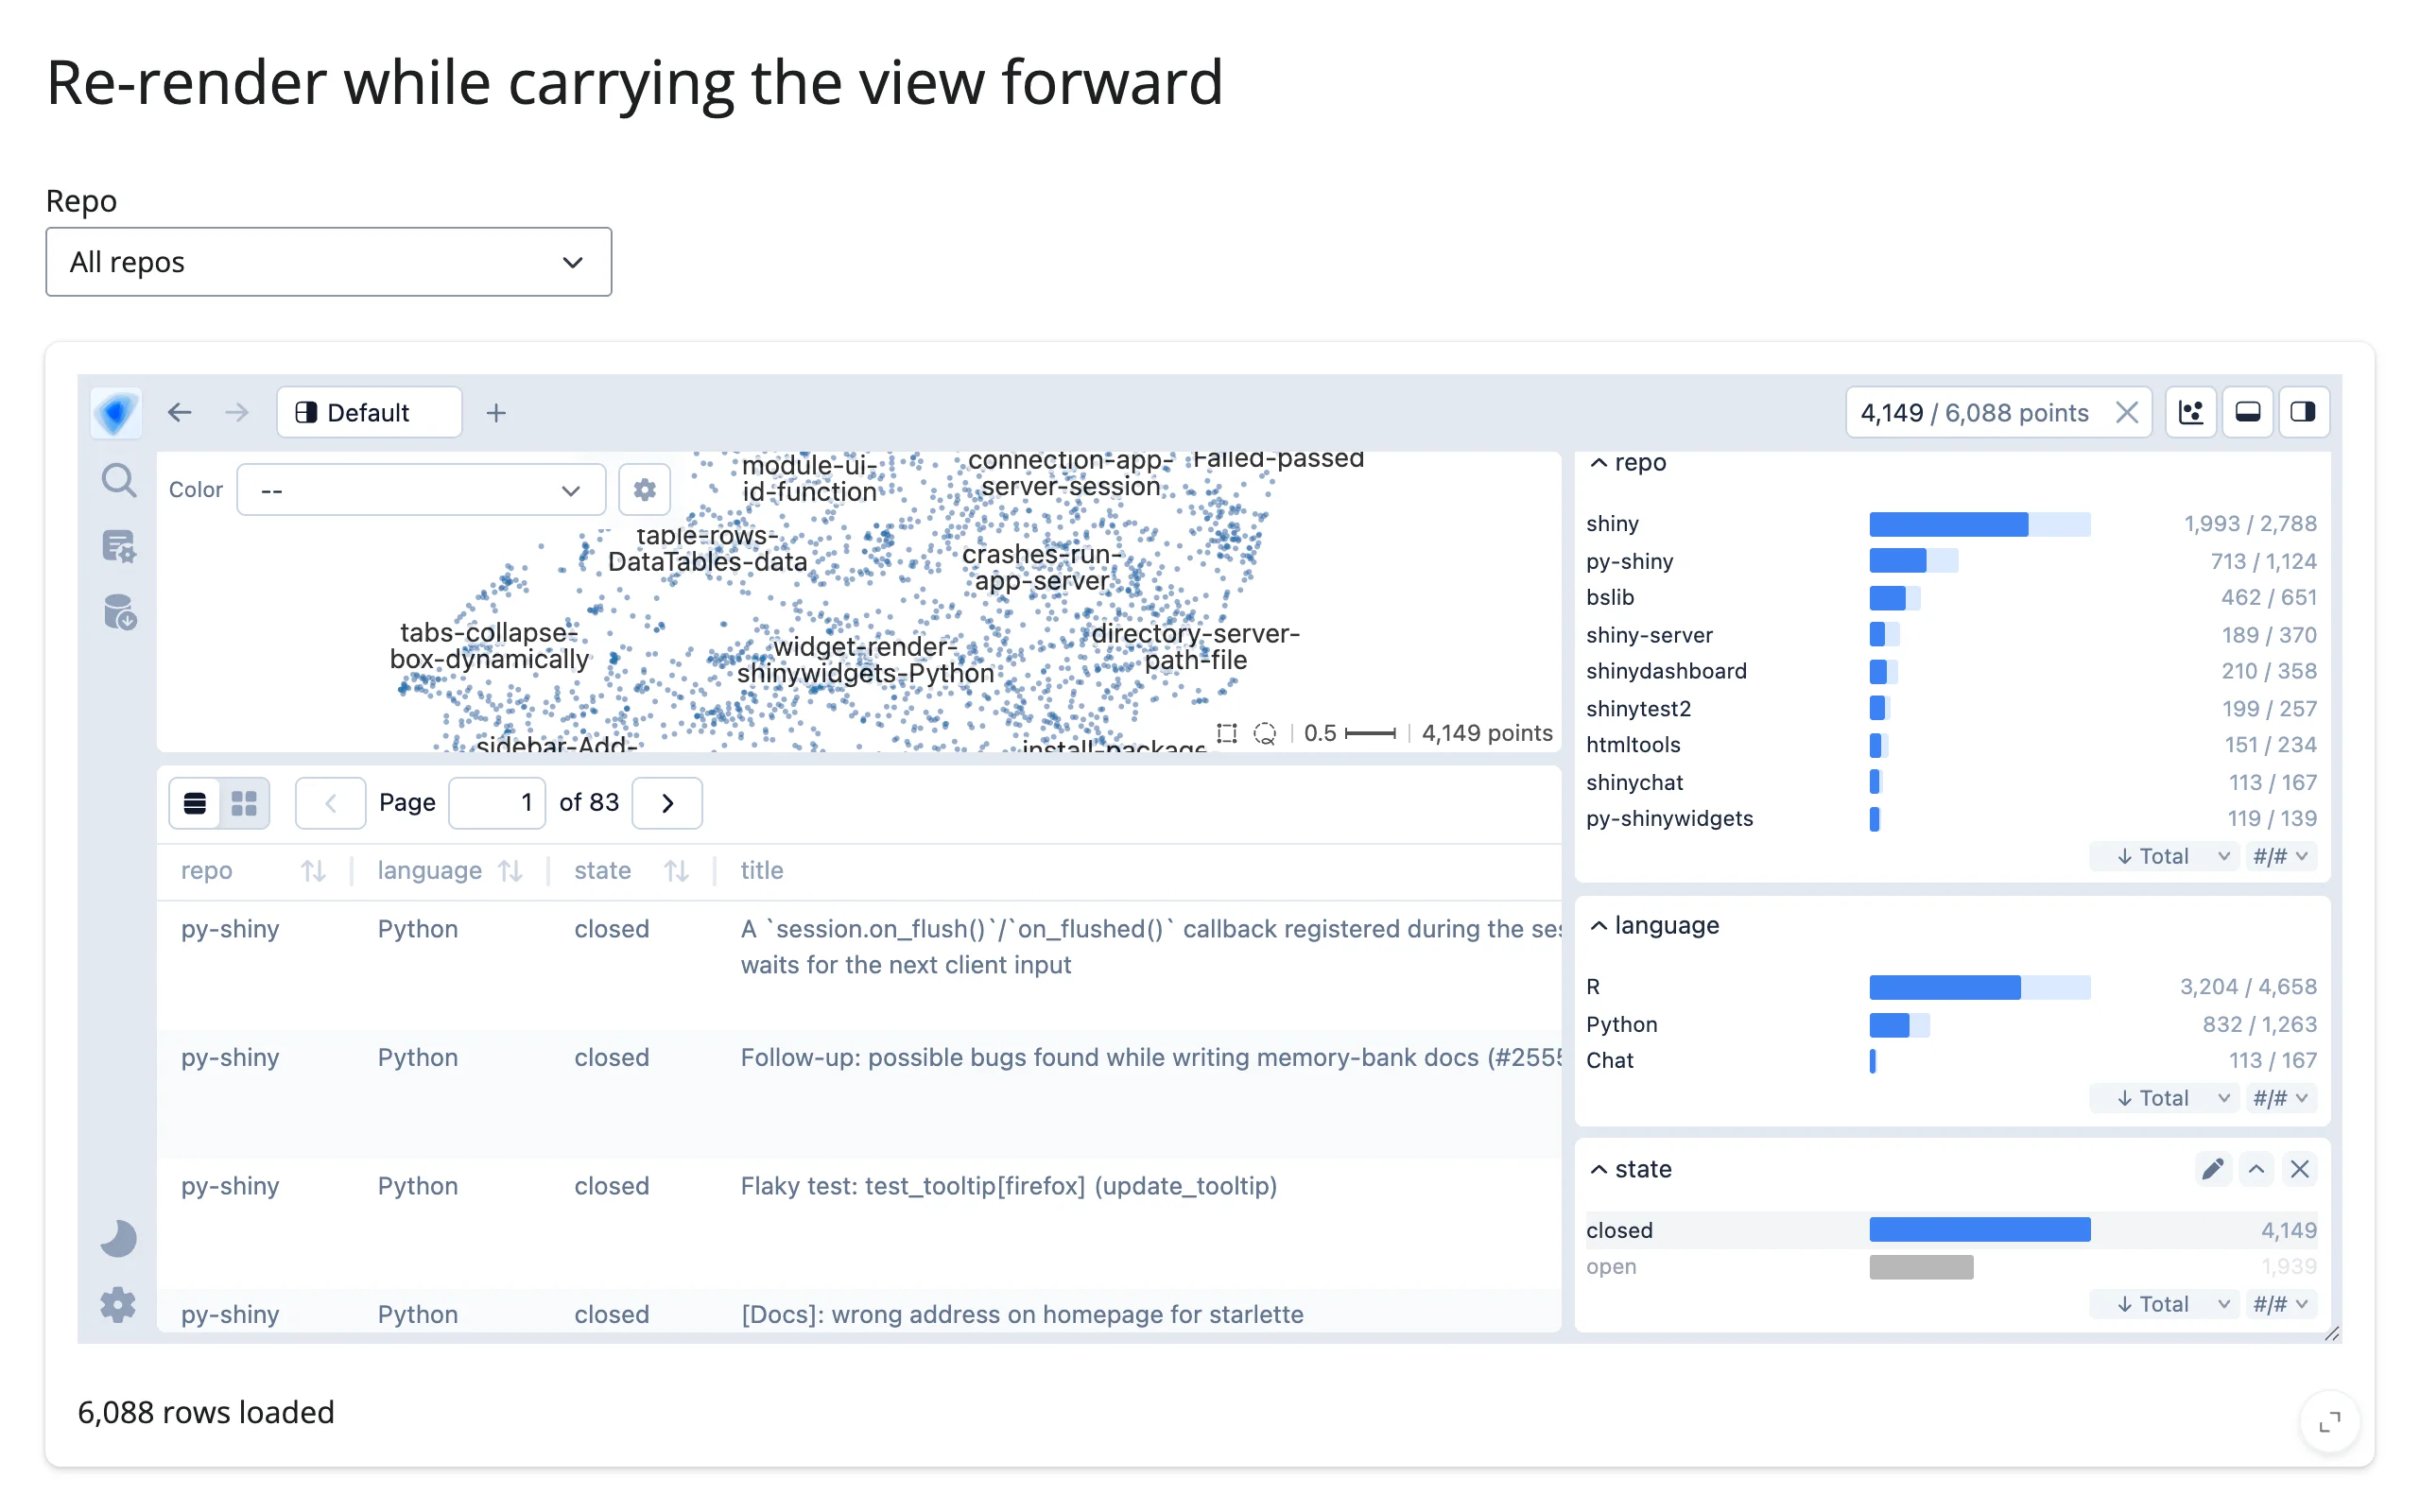
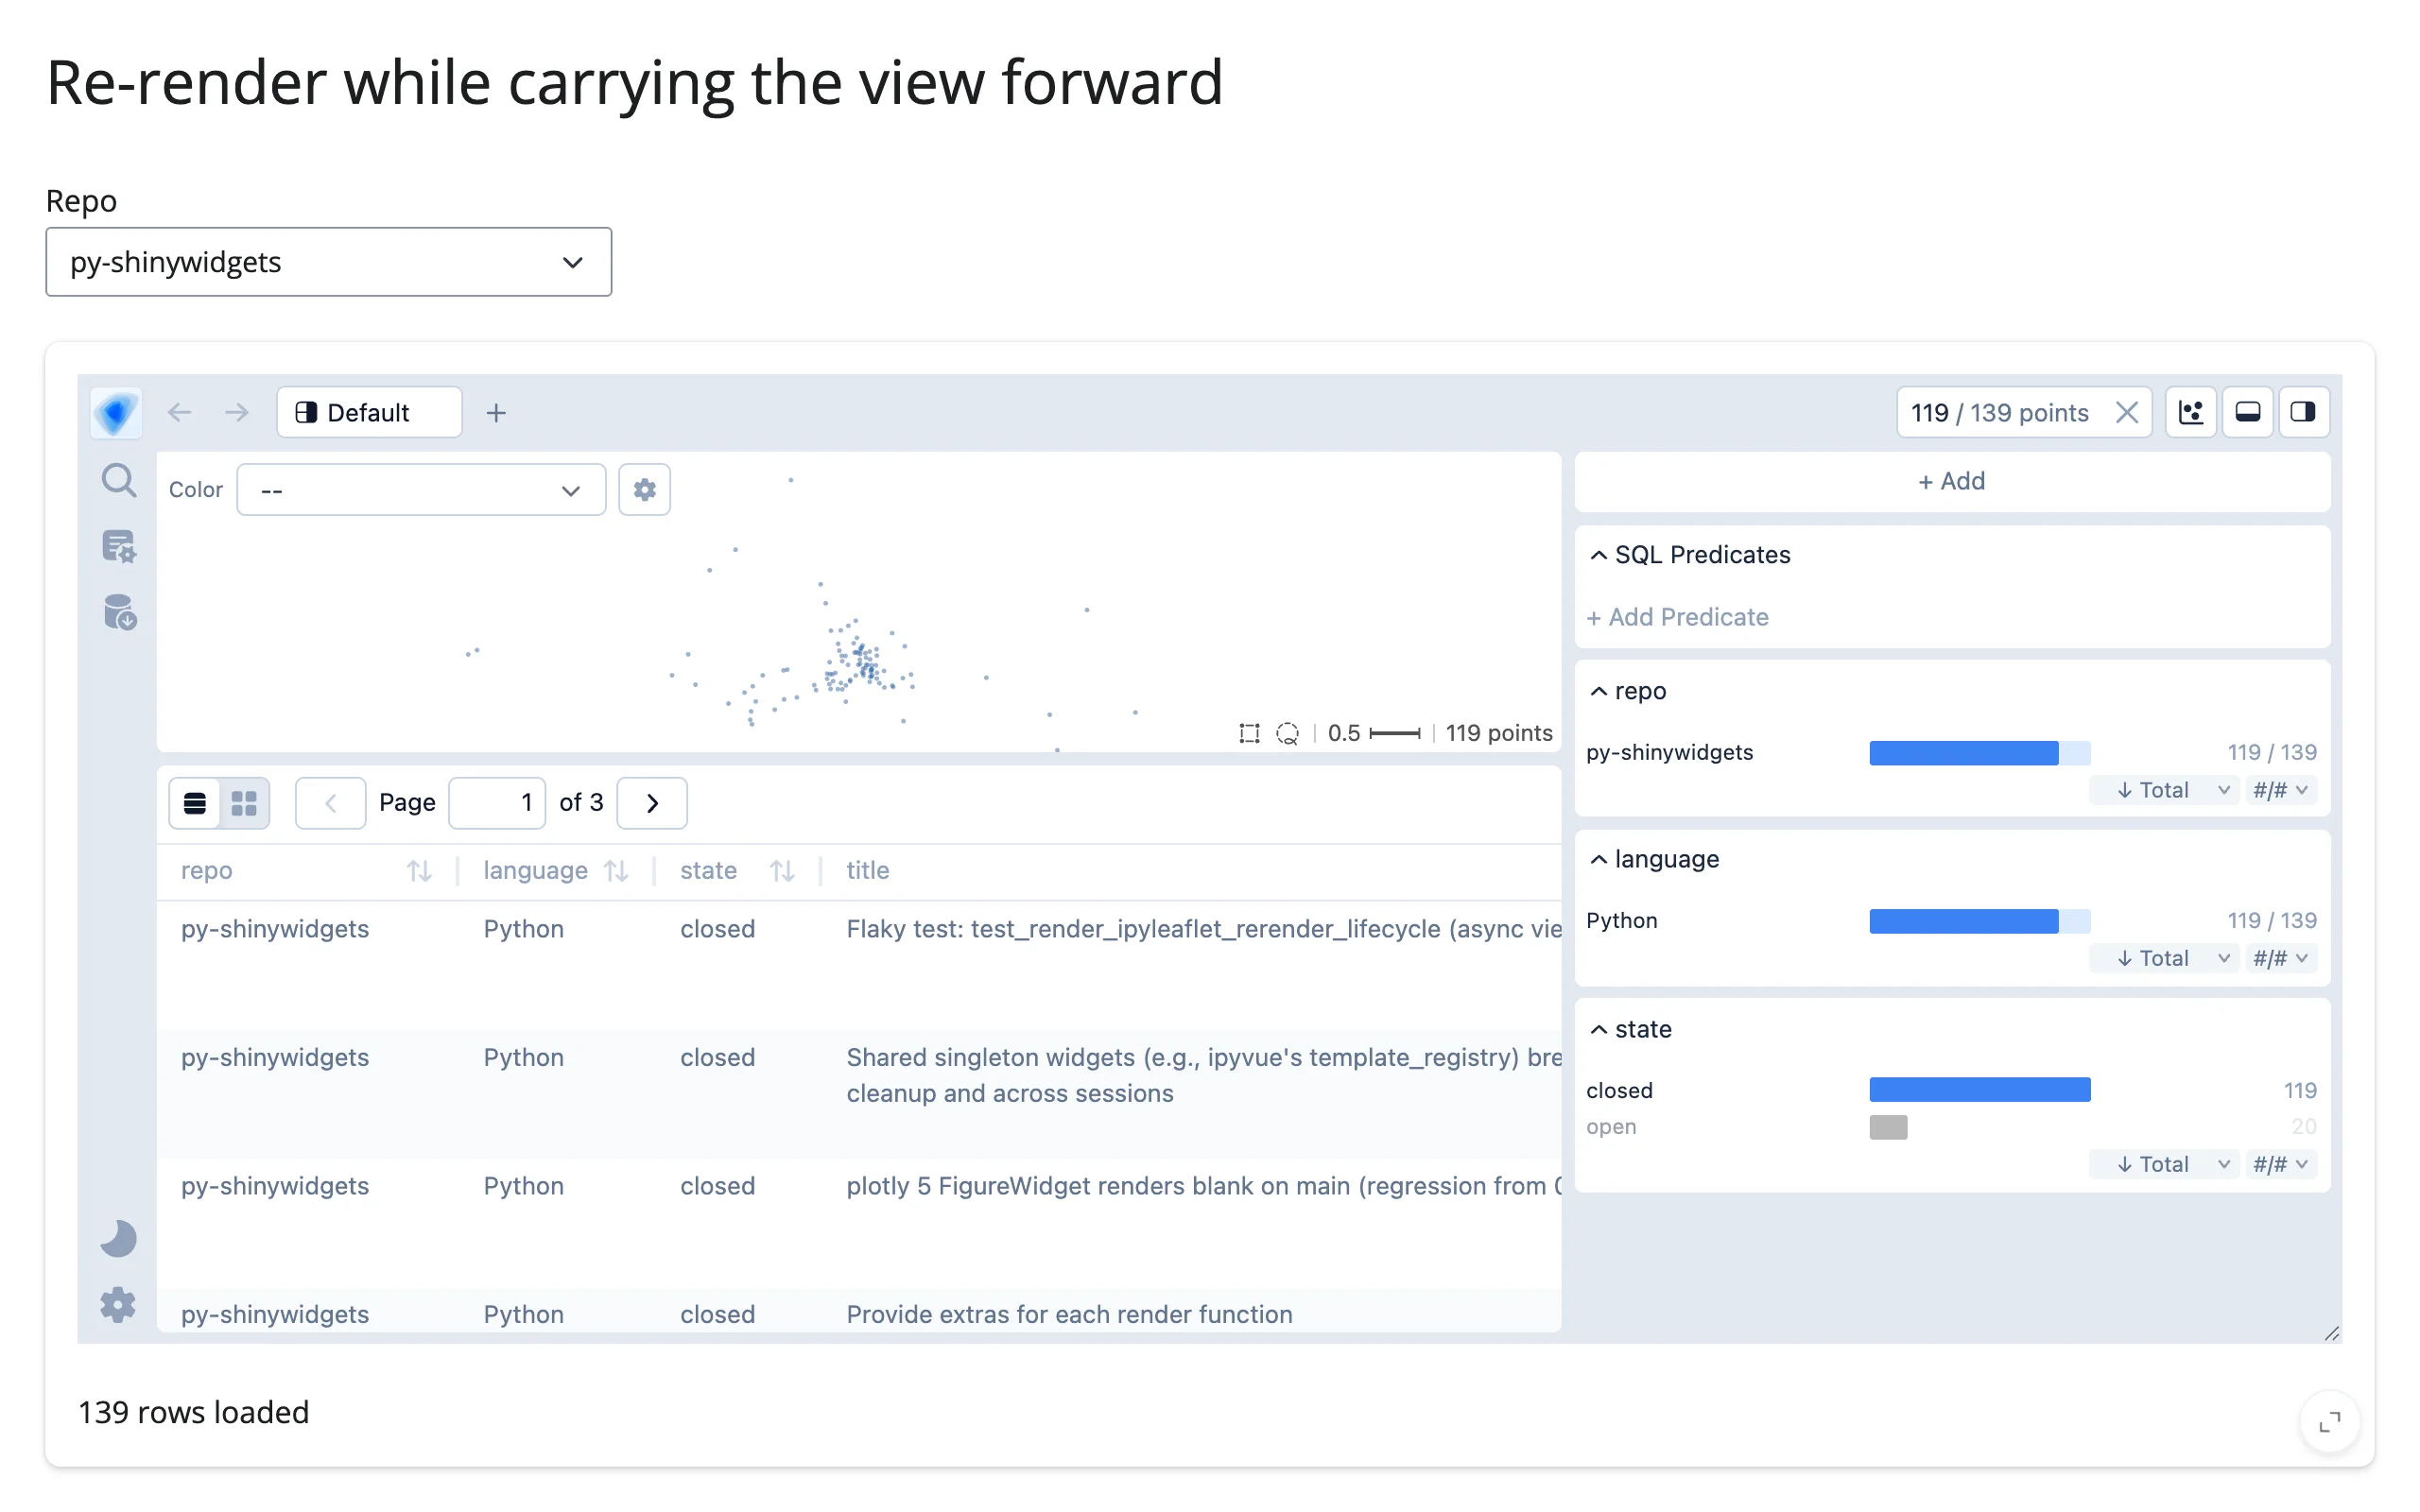
Before: filtered to “closed” issues (4,149 of 6,088). After switching the repo dropdown to “py-shinywidgets” (a brand new, much smaller data frame, so a real re-render): the “closed” filter is still active, now against the new 139-row dataset (119 of 139) – the user never had to redo it.
Note the comment in atlas(): fetch the previous state from the reactive.value, not from atlas.widget itself – see Gotchas for why that specific read is dangerous here.
Coordinating multiple views
Because the explorer can only be changed by a re-render (previous section), every pattern below flows data out of the atlas into something else; there’s no way to drive the atlas’s own filter or viewport from another widget’s selection in place.
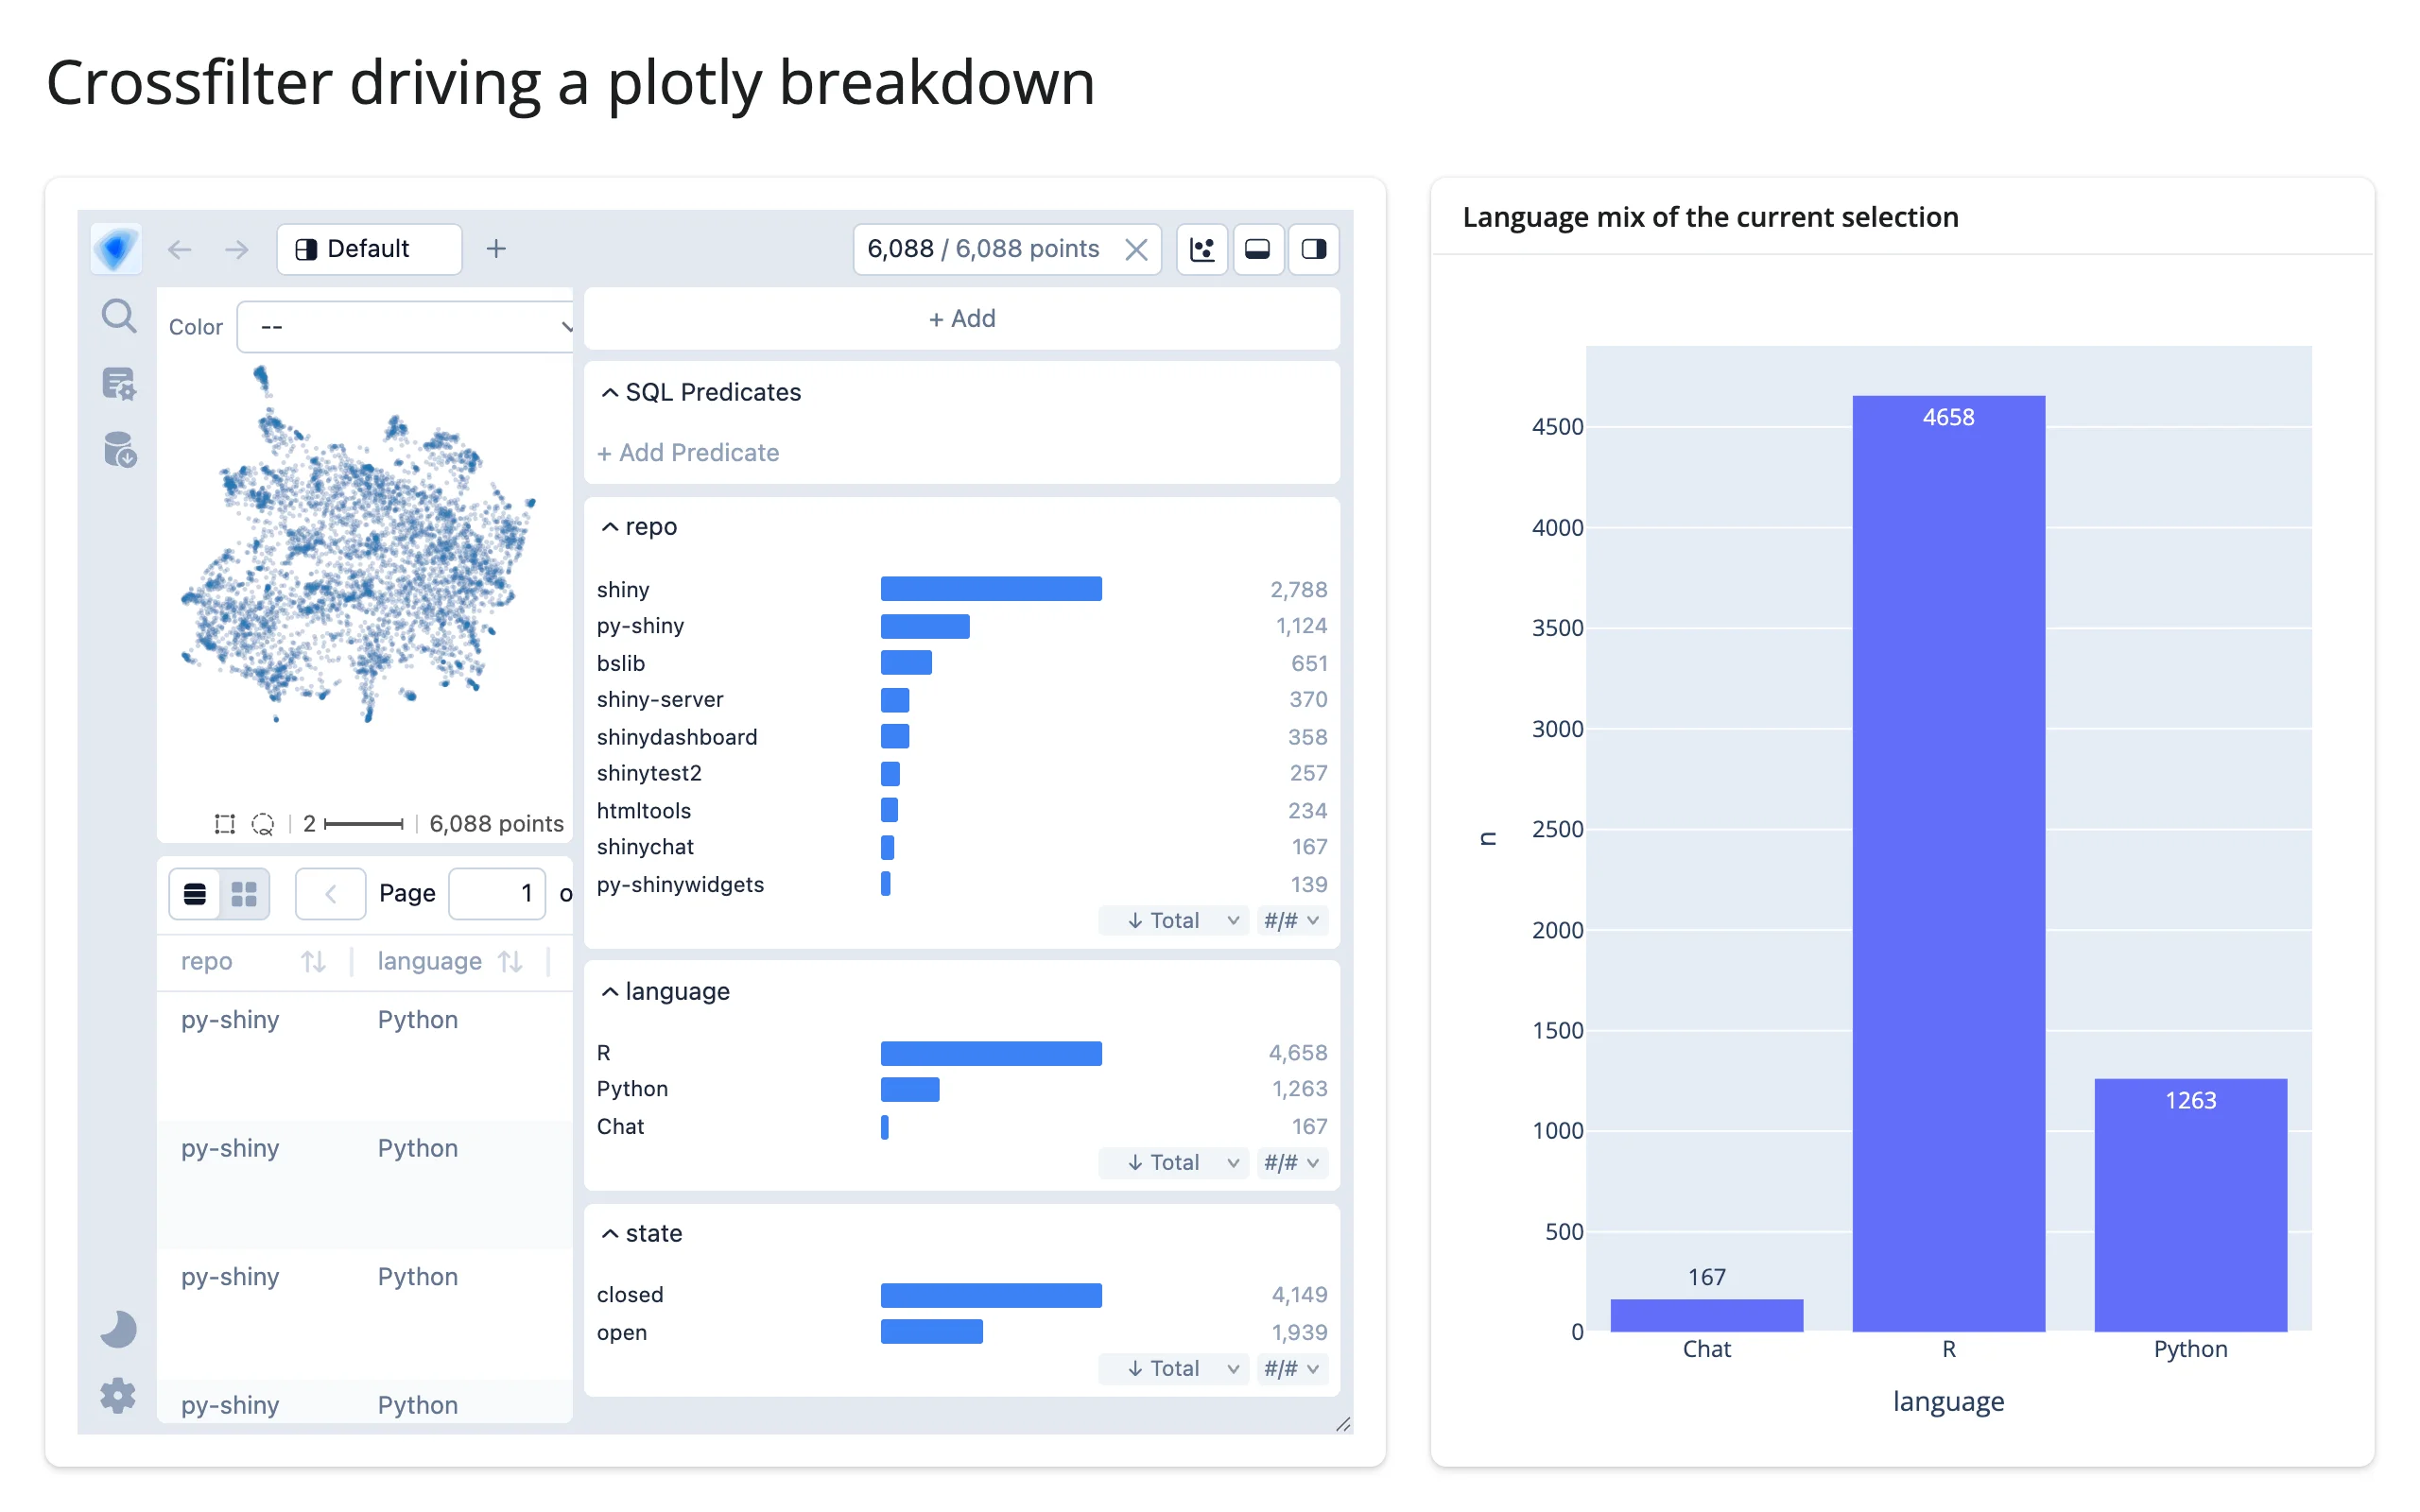
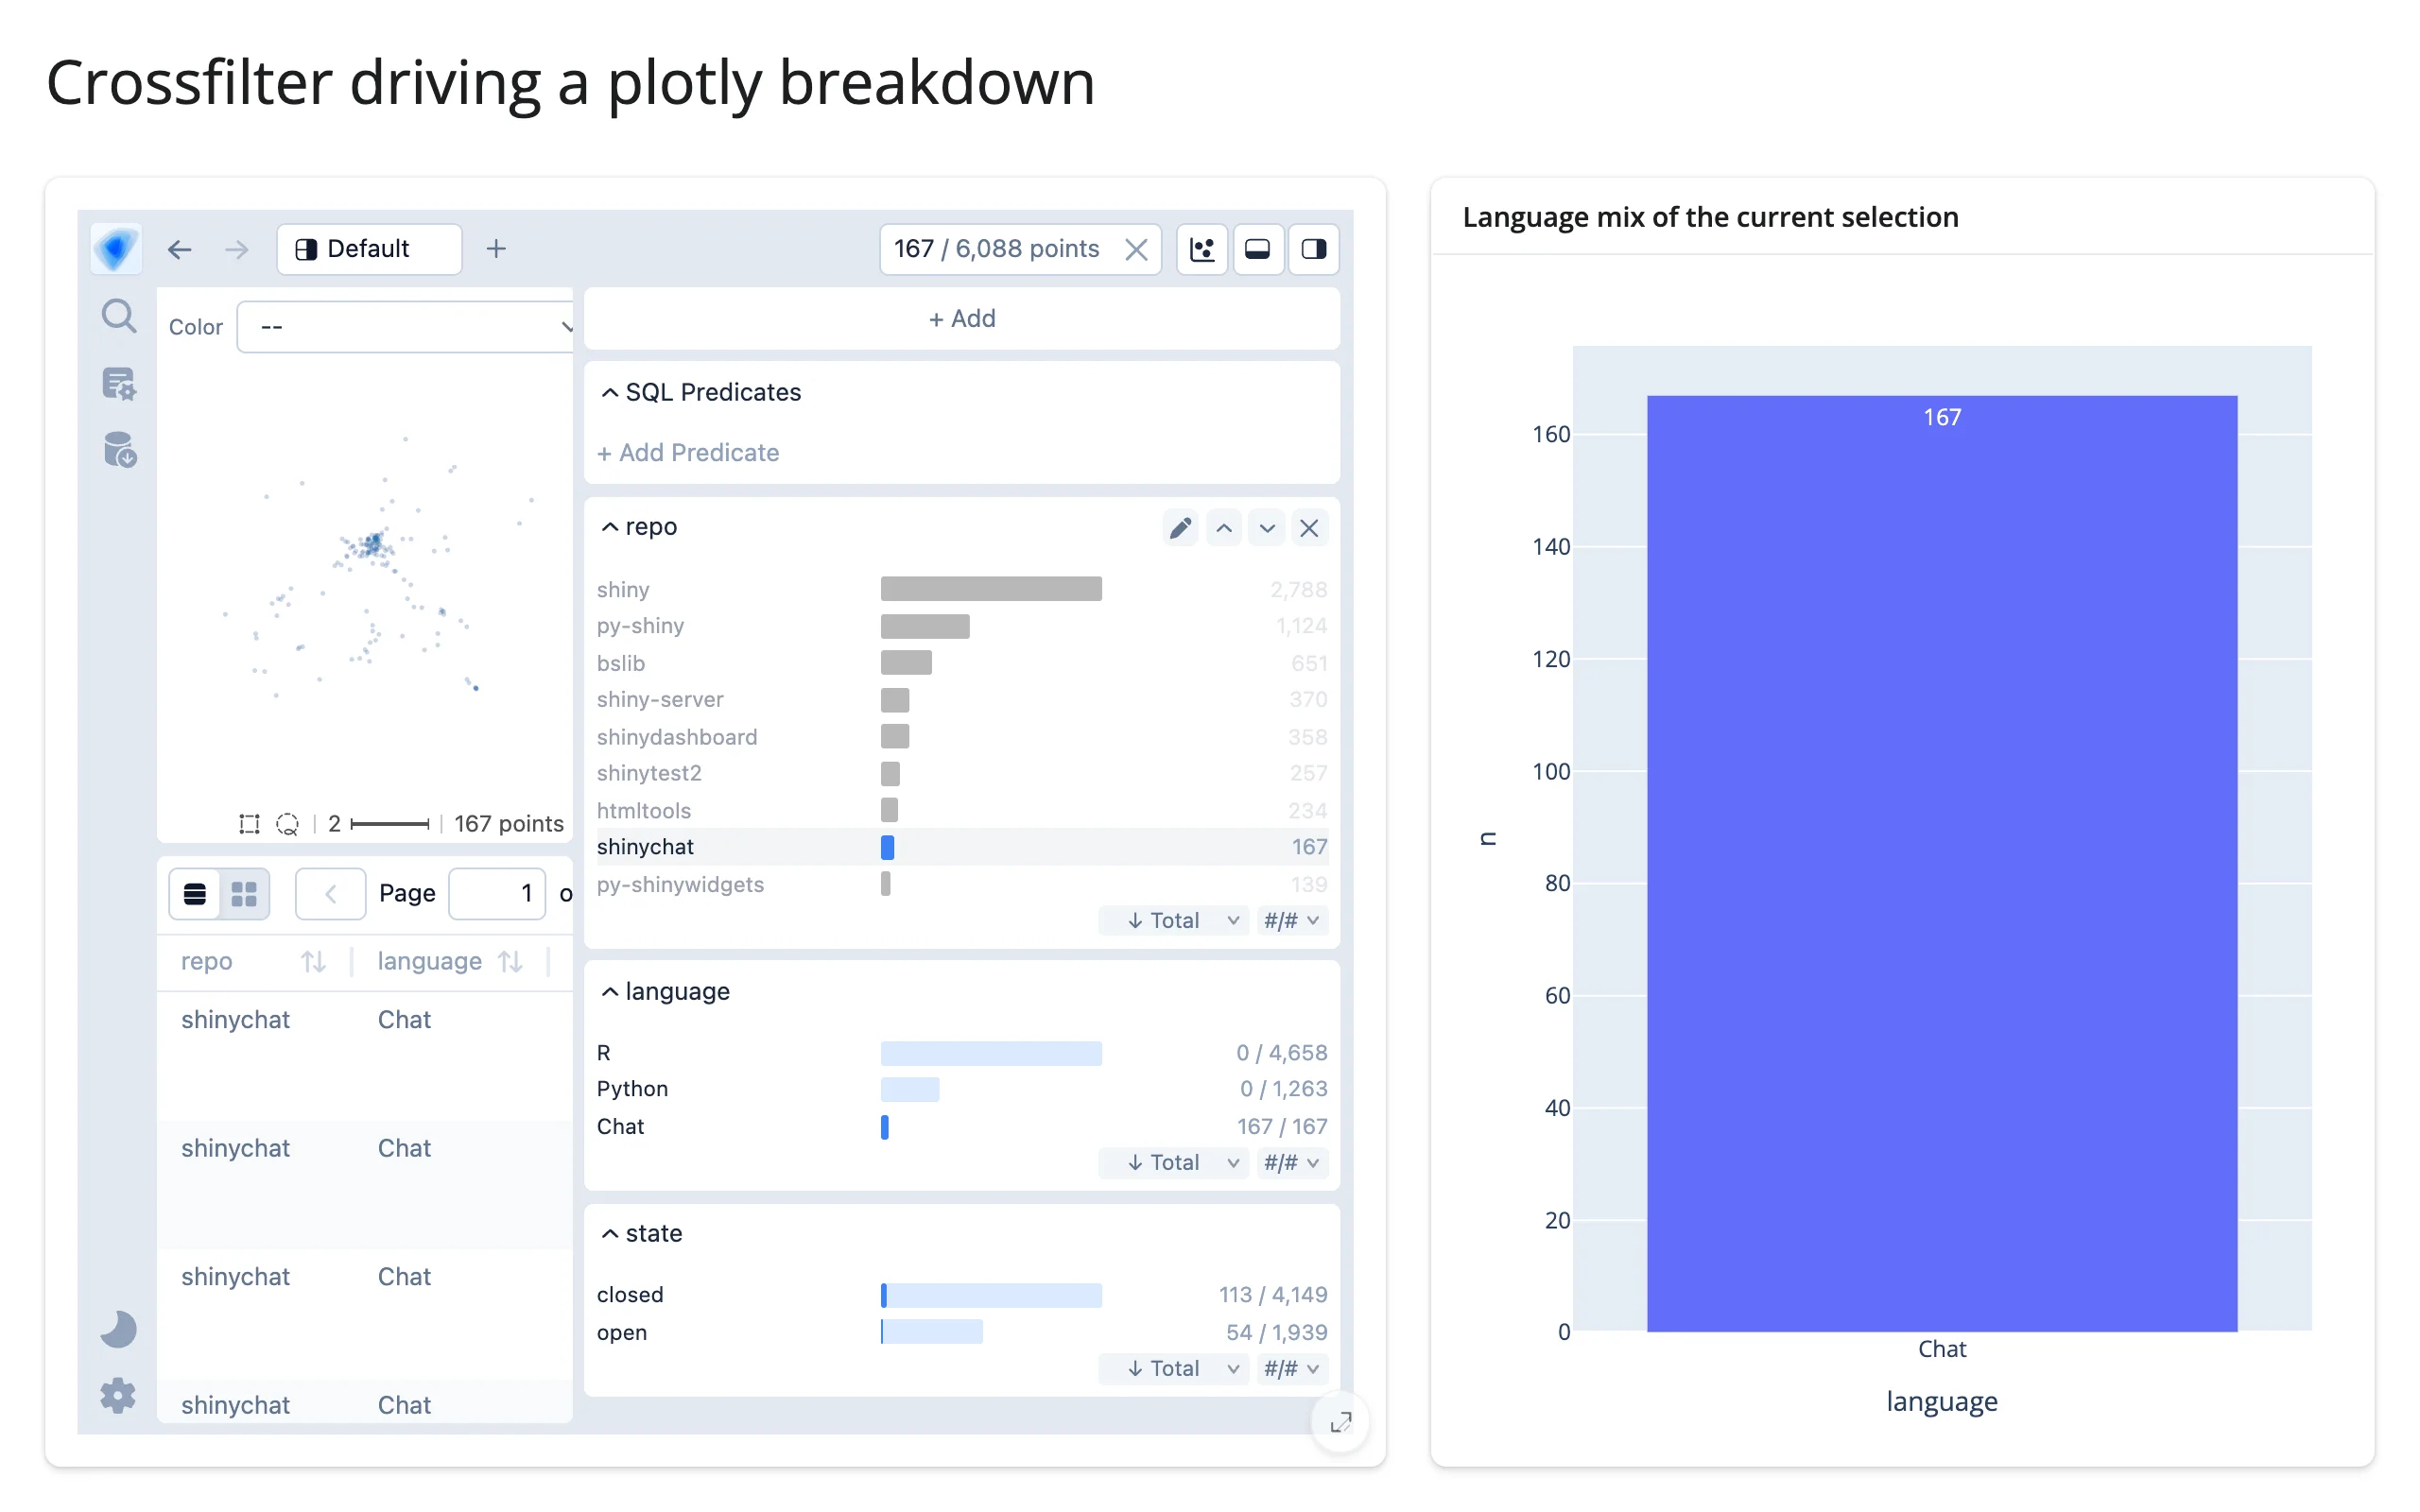
Crossfilter driving a plotly breakdown
examples/08_predicate_to_plotly.py – pairs well with the plotly guide. The same predicate() string, applied to a second connection over the same data, drives a live bar chart of whatever categorical breakdown you want for just the selected rows:
# Pattern: atlas crossfilter -> a plotly chart of exactly the selected rows.
# predicate() is a DuckDB WHERE expression over the *same* column names the
# widget was built from, so it applies directly to a pandas boolean mask via
# a second DuckDB connection registered on the same frame -- no need to
# touch the widget's own (locked-down) connection. Pairs with the plotly guide.
from pathlib import Path

import duckdb
import pandas as pd
import plotly.express as px
from embedding_atlas.widget import EmbeddingAtlasWidget
from shiny.express import render, ui
from shinywidgets import render_embedding_atlas, render_plotly

ISSUES = pd.read_parquet(Path(__file__).parent / "data" / "issues.parquet")
COLUMNS = ["repo", "language", "state", "title", "text", "projection_x", "projection_y"]  # fmt: skip

# Chained as an assignment, not a bare statement: shiny.express would
# otherwise capture .register()'s non-None return as a UI child
con = duckdb.connect().register("issues", ISSUES)

ui.page_opts(title="Crossfilter driving a plotly breakdown", fillable=True)

with ui.layout_columns(col_widths=[7, 5]):
    with ui.card(full_screen=True):

        @render_embedding_atlas
        def atlas():
            return EmbeddingAtlasWidget(
                ISSUES[COLUMNS], x="projection_x", y="projection_y", text="text"
            )

    with ui.card():
        ui.card_header("Language mix of the current selection")

        @render_plotly
        def breakdown():
            where = atlas.predicate()
            clause = f"WHERE {where}" if where else ""
            counts = con.sql(
                f"SELECT language, count(*) AS n FROM issues {clause} GROUP BY language"
            ).df()
            return px.bar(counts, x="language", y="n", text="n")
Before (all languages), and after clicking the “shinychat” bar (which is 100% Chat, not R/Python like the rest):
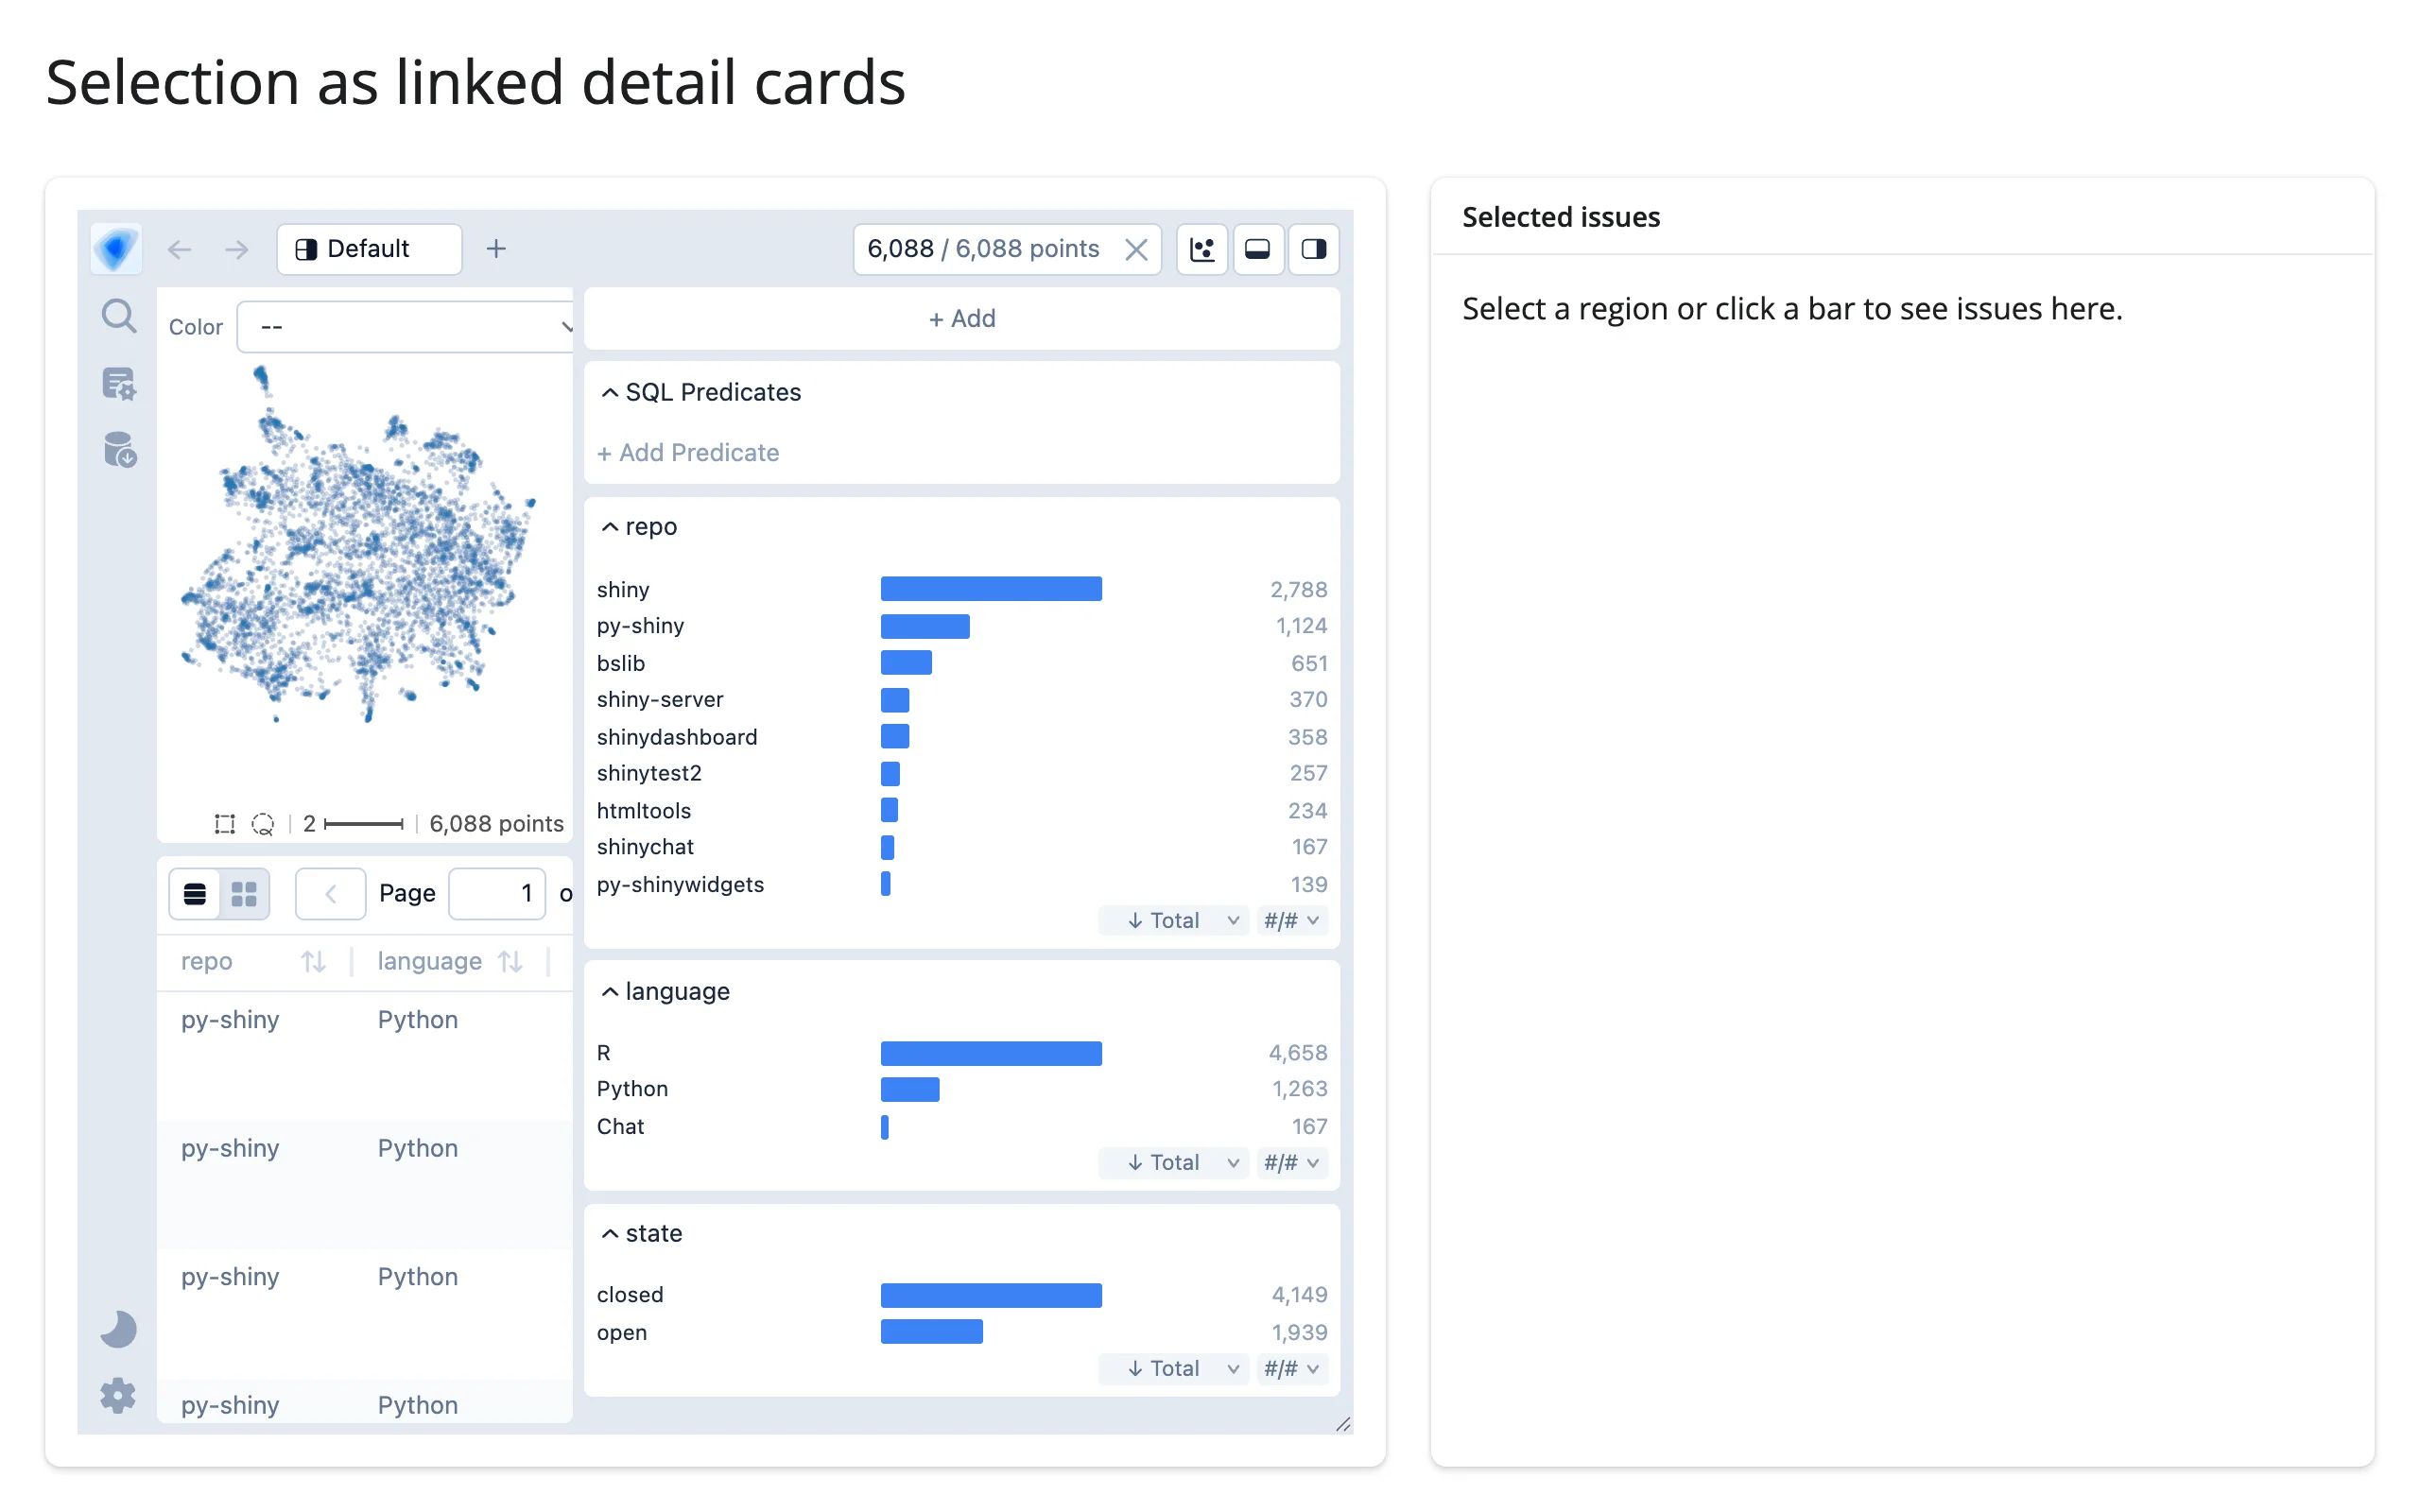
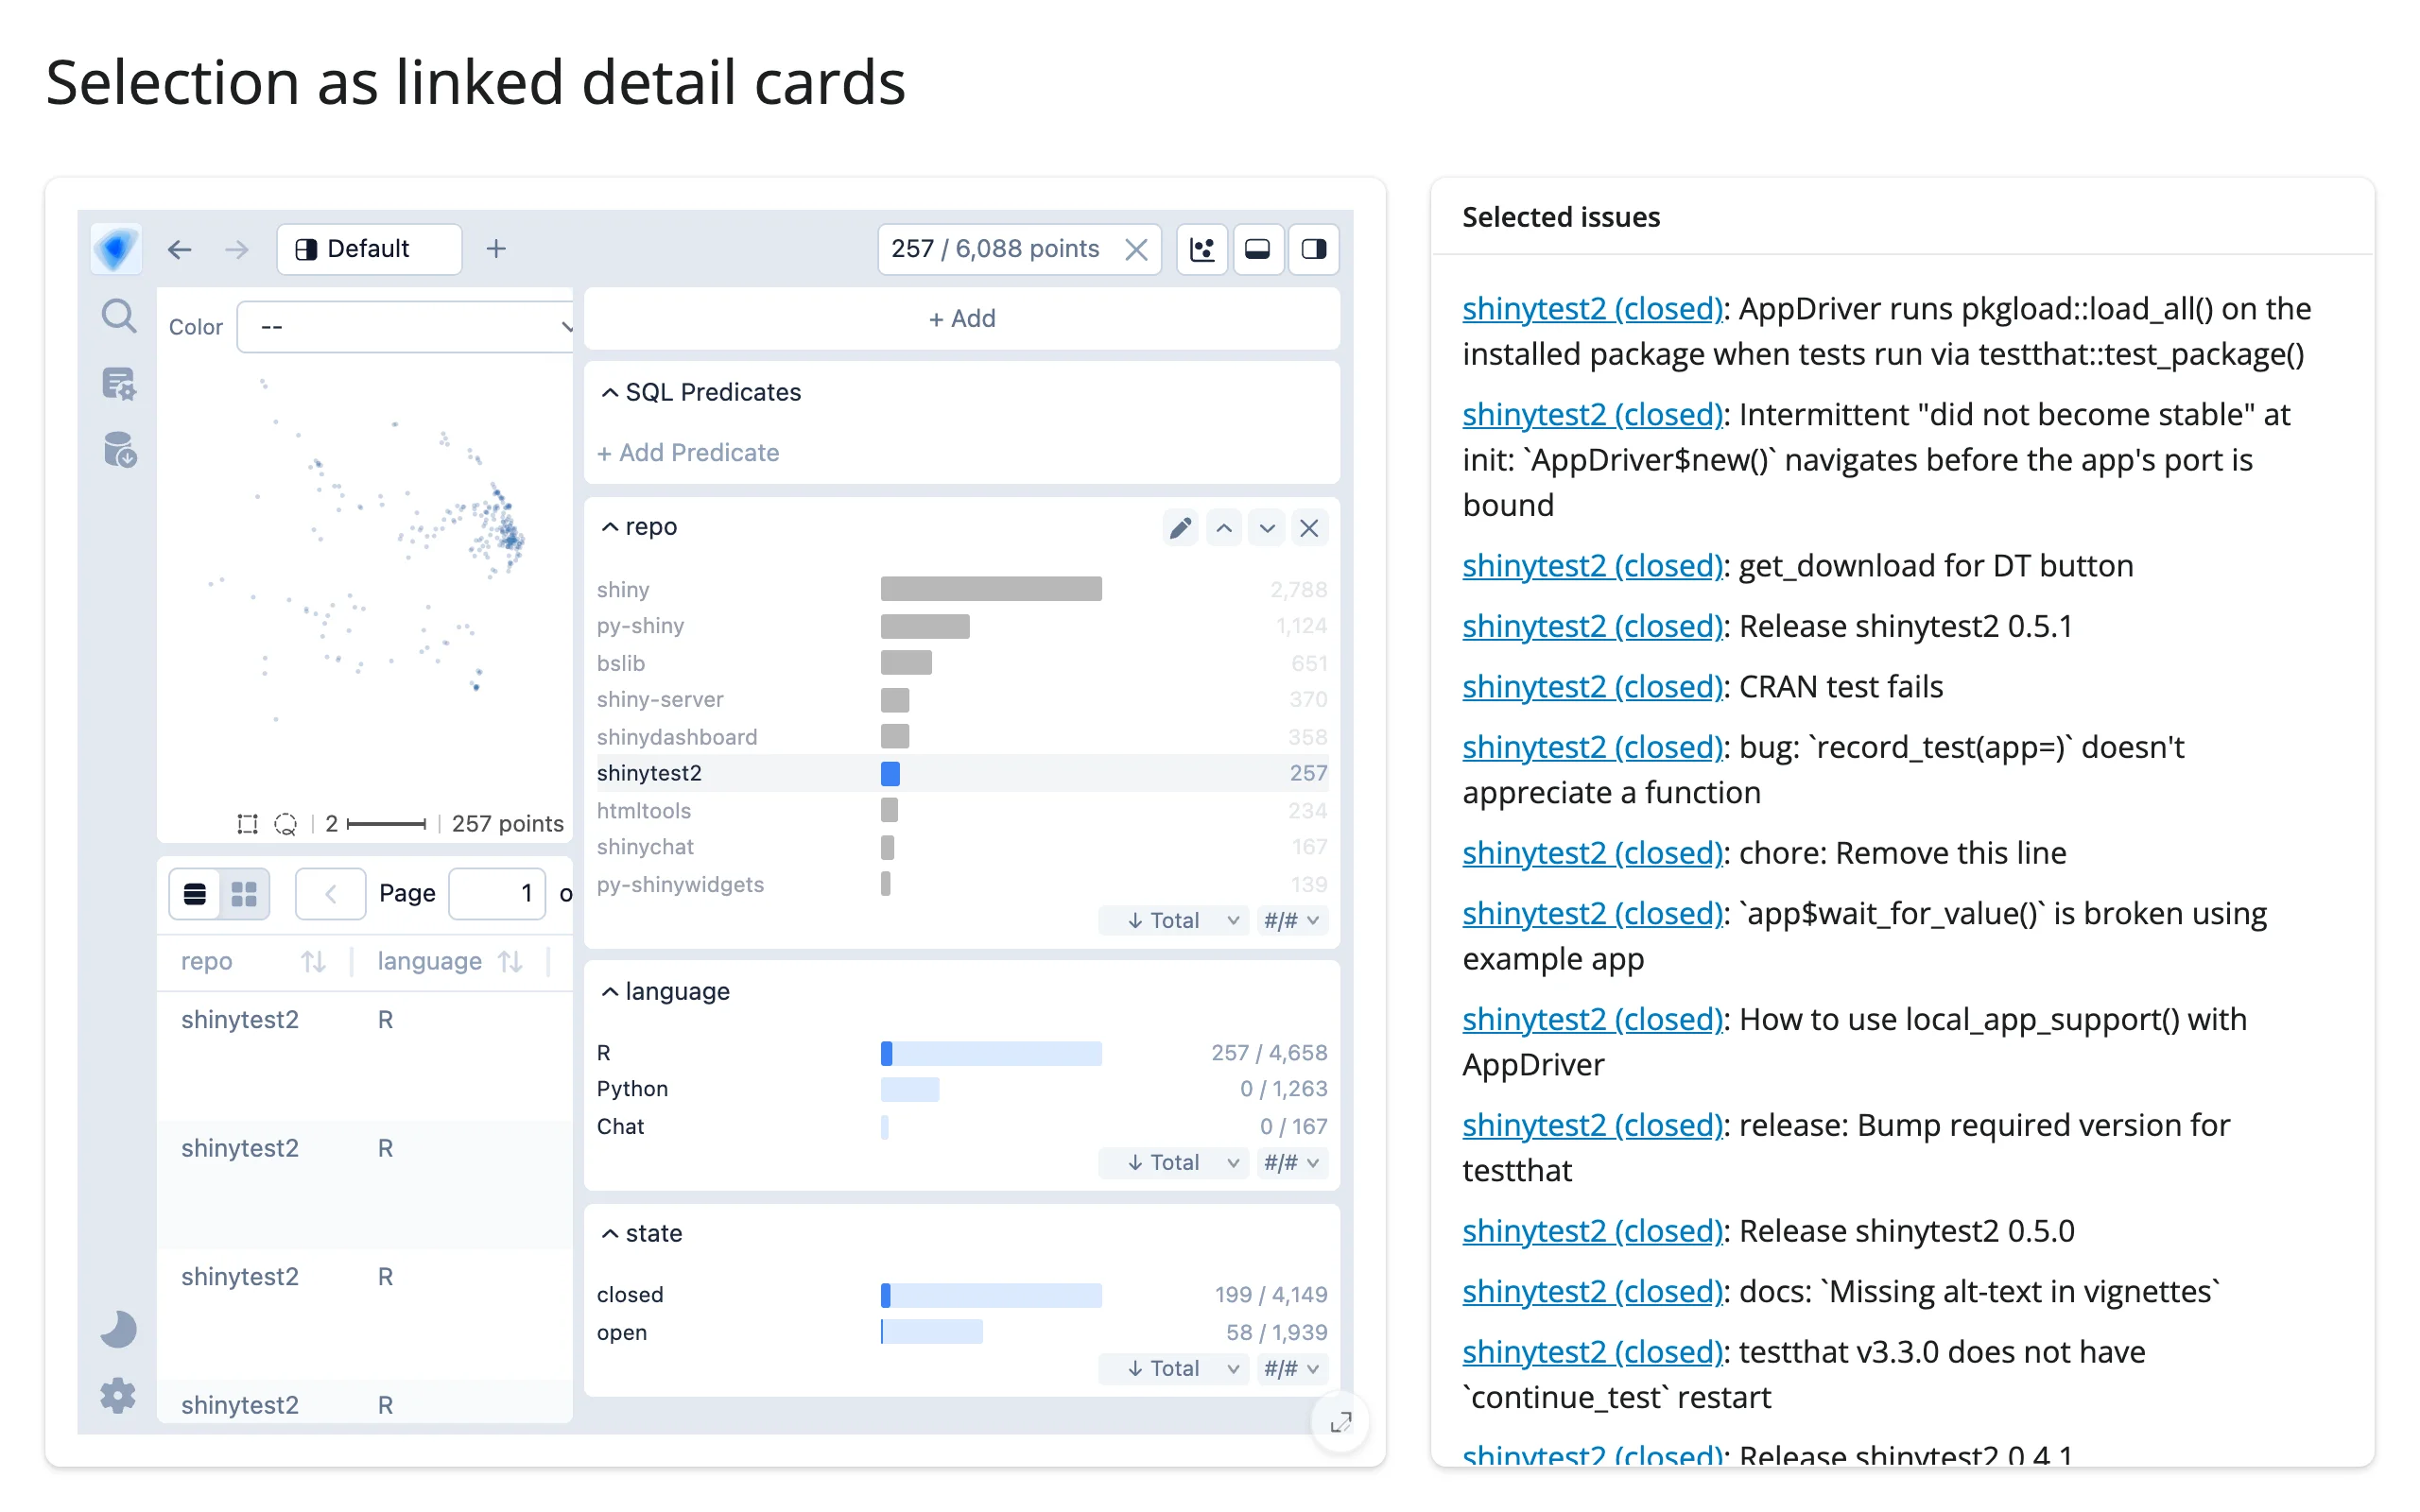
Selection as linked detail cards
examples/09_selection_to_cards.py – selected() feeding ui.a() links instead of a plain table, for a richer linked panel:
# Pattern: lasso/filter -> a linked detail list, built from selected()
# instead of a plain data_frame so each row can carry a live link.
from pathlib import Path

import pandas as pd
from embedding_atlas.widget import EmbeddingAtlasWidget
from shiny.express import render, ui
from shinywidgets import render_embedding_atlas

ISSUES = pd.read_parquet(Path(__file__).parent / "data" / "issues.parquet")
COLUMNS = ["repo", "language", "state", "title", "text", "url", "projection_x", "projection_y"]  # fmt: skip

ui.page_opts(title="Selection as linked detail cards", fillable=True)

with ui.layout_columns(col_widths=[7, 5]):
    with ui.card(full_screen=True):

        @render_embedding_atlas
        def atlas():
            return EmbeddingAtlasWidget(
                ISSUES[COLUMNS], x="projection_x", y="projection_y", text="text"
            )

    with ui.card(full_screen=True):
        ui.card_header("Selected issues")

        @render.ui
        def cards():
            sel = atlas.selected()
            if len(sel) == len(ISSUES):
                return ui.p("Select a region or click a bar to see issues here.")
            rows = sel.sort_values("state").head(15)
            return ui.div(
                *[
                    ui.p(
                        ui.a(f"{r.repo} ({r.state})", href=r.url, target="_blank"),
                        ": ",
                        r.title,
                        class_="mb-2",
                    )
                    for r in rows.itertuples()
                ]
            )
Before any selection, and after clicking the “shinytest2” bar:
Selection summary (a stand-in for an LLM call)
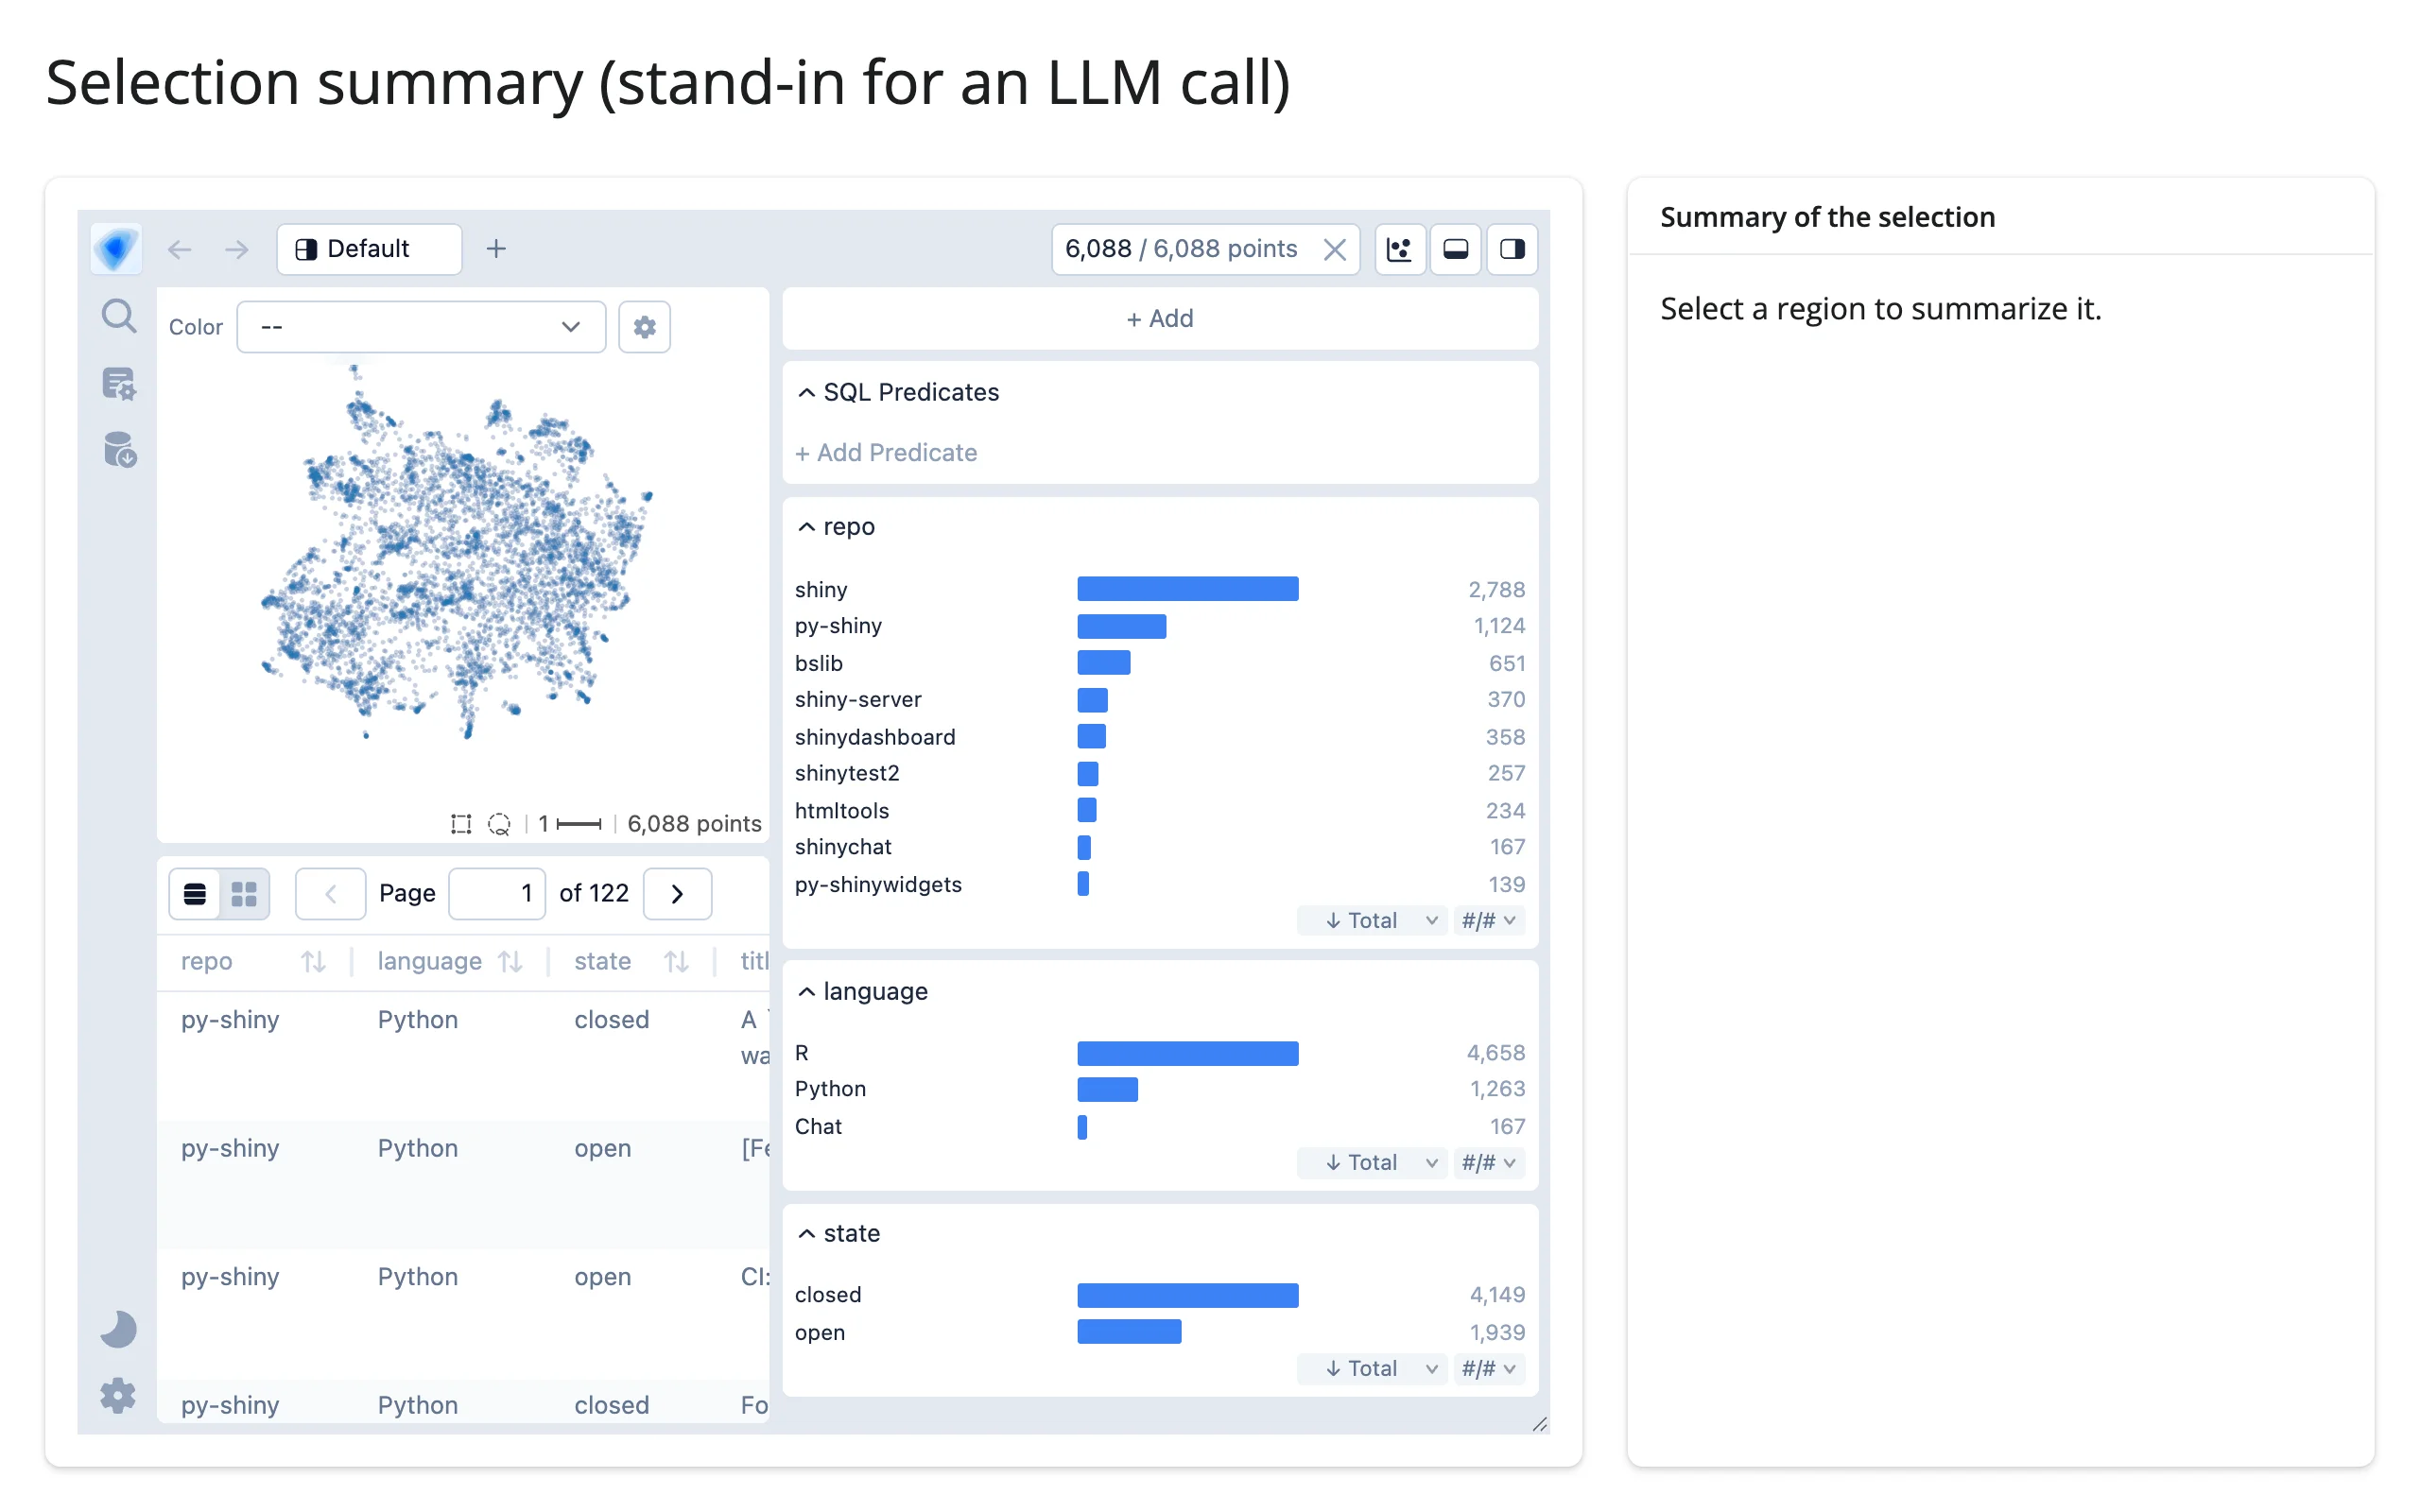
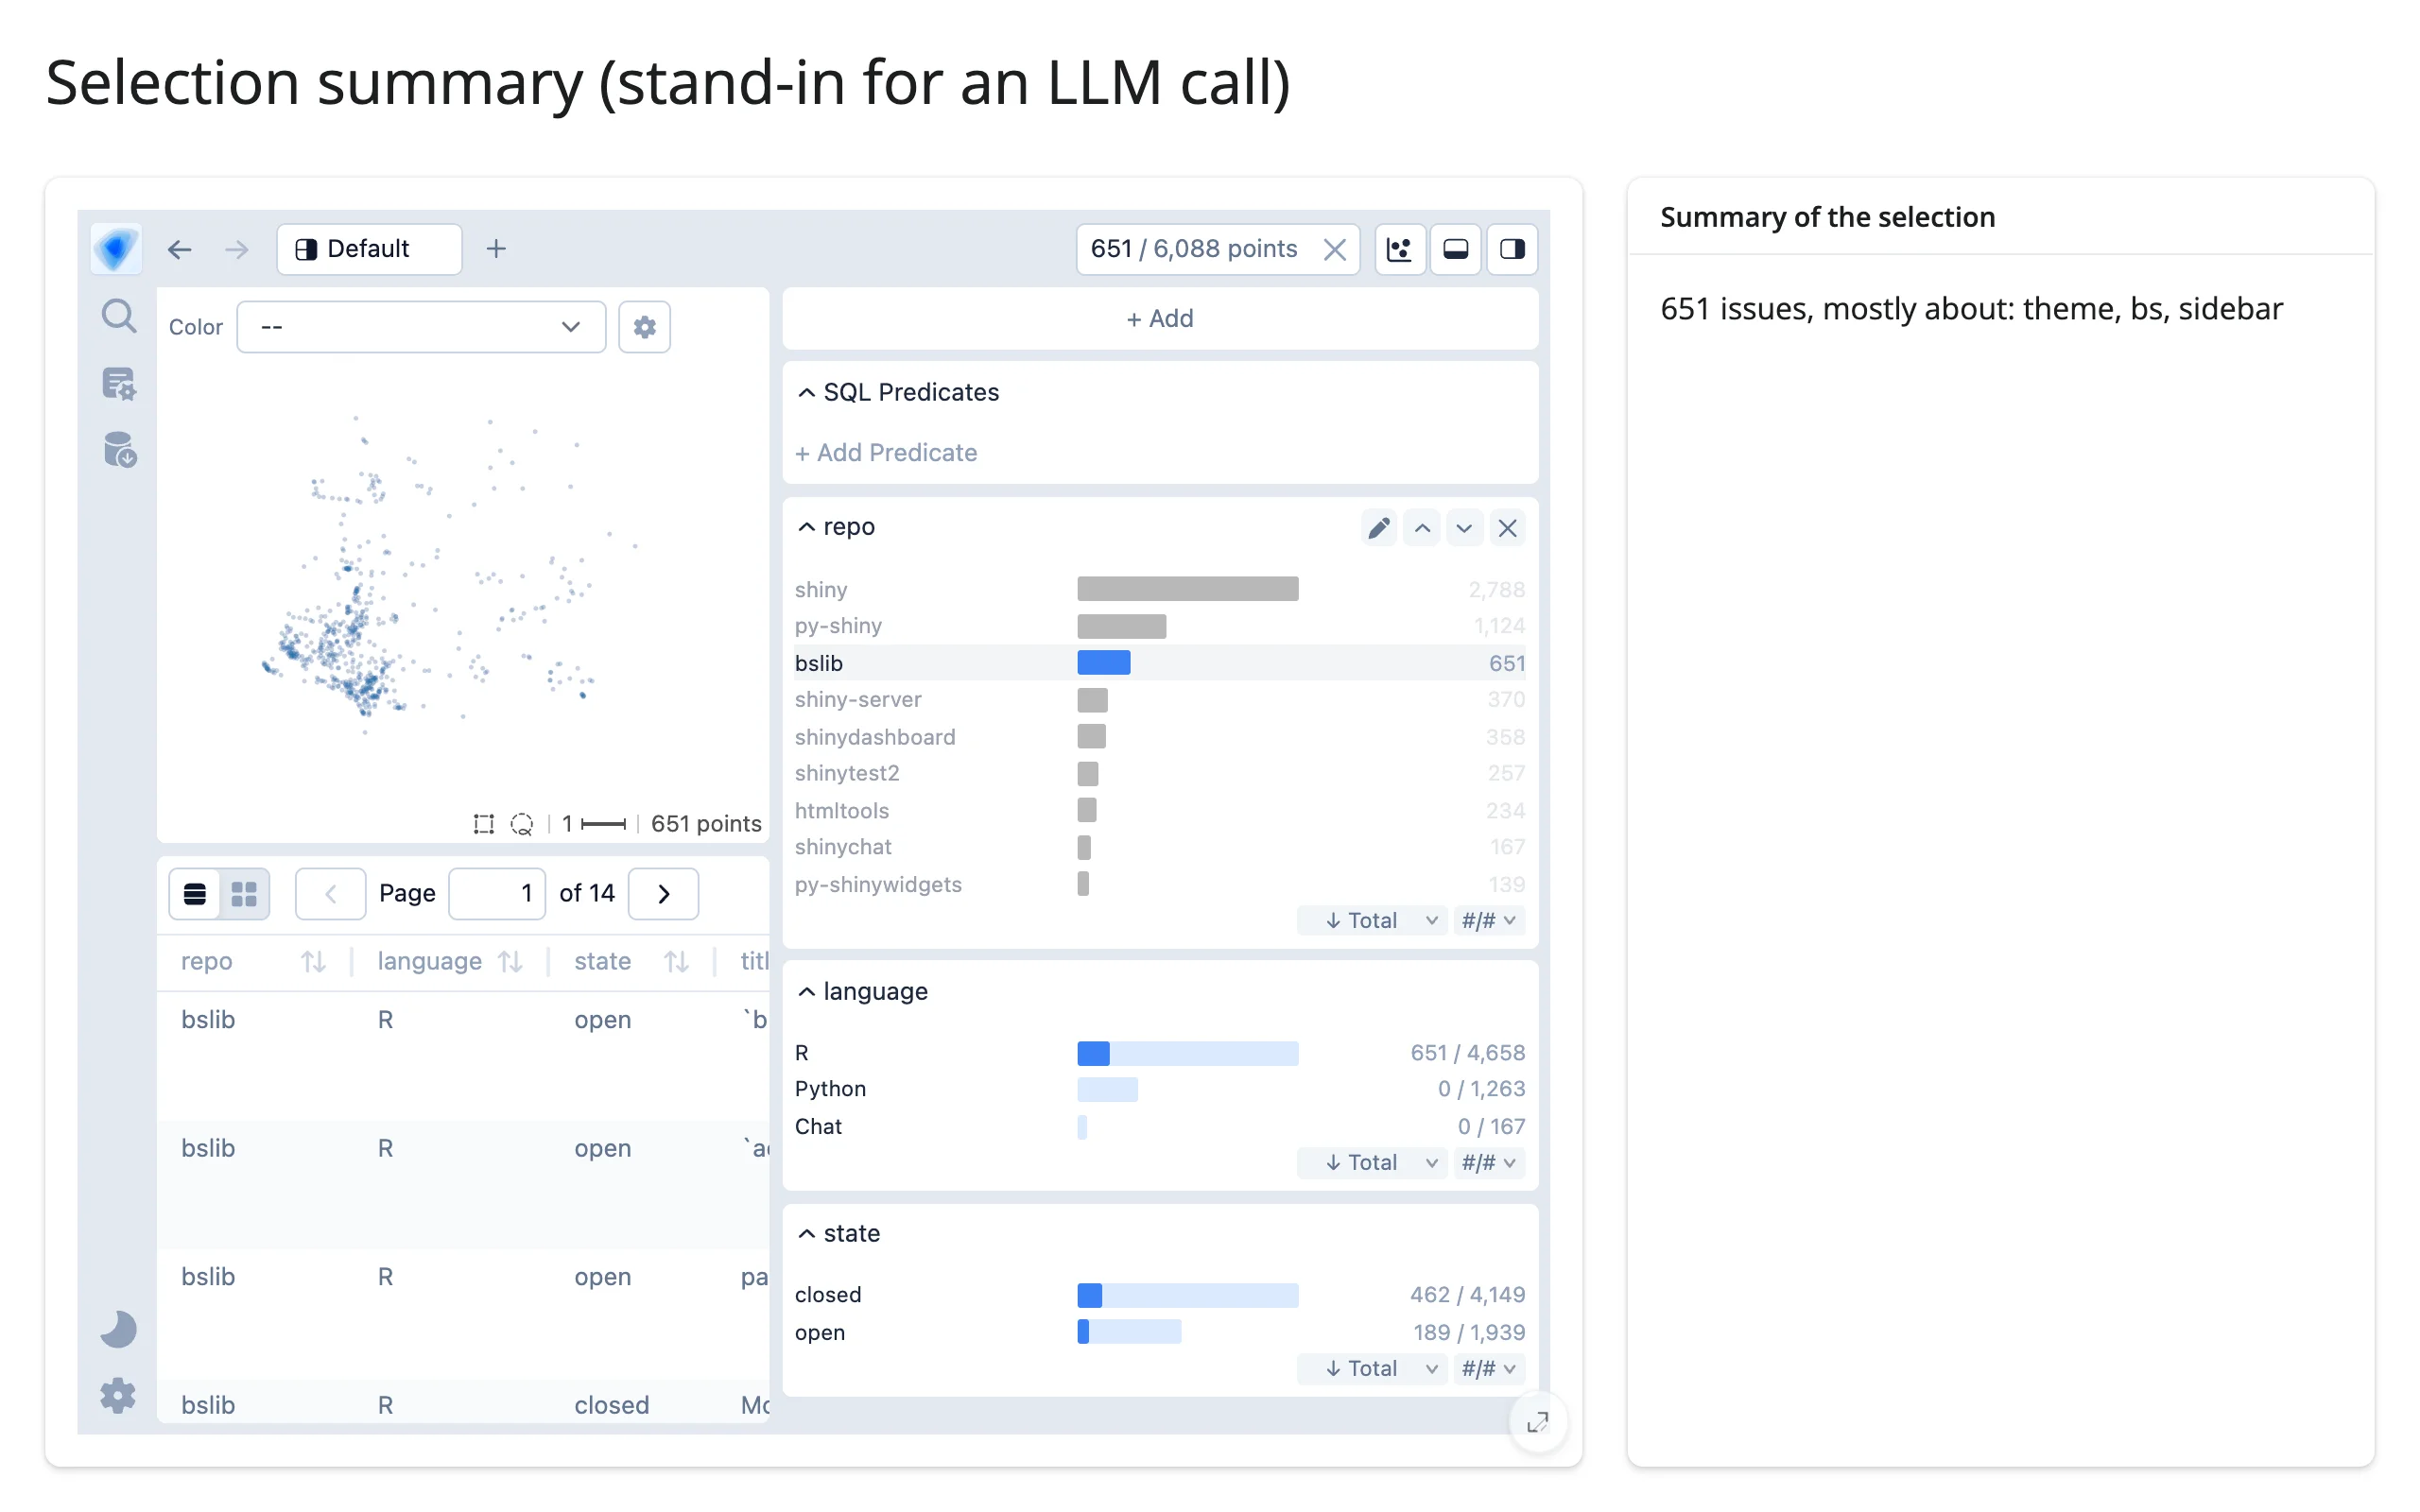
examples/10_selection_summary_stub.py. The release showcase (docs/showcase/issues/app.py and summarize.py) wires a real selection into Claude: it reads selected()’s titles, sends them to chatlas.ChatAnthropic(...).chat_async(prompt), and shows “what these issues have in common” in a couple of sentences. This guide can’t call a real LLM (no API keys), so this example keeps the exact shape – selected() in, a one-line text summary out – with a keyword-frequency stand-in in place of the model call (examples/10_selection_summary_stub.py):
# Pattern: selected() -> a one-line summary of what the user circled. This
# guide can't call a real LLM (no API keys), so `stub_summary()` below ranks
# keywords by frequency as a stand-in. The release showcase
# (docs/showcase/issues/summarize.py) wires the same selection into a real
# call: `await ChatAnthropic(model=..., system_prompt=...).chat_async(prompt)`
# with the selected titles in the prompt -- swap `stub_summary` for that.
import re
from collections import Counter
from pathlib import Path

import pandas as pd
from embedding_atlas.widget import EmbeddingAtlasWidget
from shiny.express import render, ui
from shinywidgets import render_embedding_atlas

ISSUES = pd.read_parquet(Path(__file__).parent / "data" / "issues.parquet")
COLUMNS = ["repo", "language", "state", "title", "text", "projection_x", "projection_y"]  # fmt: skip
STOP_WORDS = {"the", "a", "an", "to", "in", "on", "for", "and", "is", "of", "with"}


def stub_summary(titles: list[str]) -> str:
    words = [w for t in titles for w in re.findall(r"[a-z]+", t.lower())]
    top = Counter(w for w in words if w not in STOP_WORDS).most_common(3)
    return f"{len(titles)} issues, mostly about: {', '.join(w for w, _ in top)}"


ui.page_opts(title="Selection summary (stand-in for an LLM call)", fillable=True)

with ui.layout_columns(col_widths=[8, 4]):
    with ui.card(full_screen=True):

        @render_embedding_atlas
        def atlas():
            return EmbeddingAtlasWidget(
                ISSUES[COLUMNS], x="projection_x", y="projection_y", text="text"
            )

    with ui.card():
        ui.card_header("Summary of the selection")

        @render.text
        def summary():
            sel = atlas.selected()
            if len(sel) == len(ISSUES):
                return "Select a region to summarize it."
            return stub_summary(sel["title"].tolist())
Before any selection, and after clicking the “bslib” bar – the keyword stand-in surfaces “theme, bs, sidebar”, which is a fair one-line description of what bslib’s issues are actually about:
Export the current selection, read on demand
Every pattern above reads selected() continuously, re-rendering as the user filters. A download handler instead reads it on demand: it’s live from the moment the explorer renders, so the handler needs no earlier read to “arm” it, and no warm-up effect, even on the very first click (examples/12_export_selection.py):
# Read on demand: export the explorer's current selection as a CSV, read
# only when the user clicks Download -- no warm-up needed, since
# selected() is live from the moment the explorer renders.
from pathlib import Path

import pandas as pd
from embedding_atlas.widget import EmbeddingAtlasWidget
from shiny import render
from shiny.express import ui
from shinywidgets import render_embedding_atlas

ISSUES = pd.read_parquet(Path(__file__).parent / "data" / "issues.parquet")
COLUMNS = ["repo", "language", "state", "title", "text", "projection_x", "projection_y"]  # fmt: skip

ui.page_opts(title="Export the current selection, read on demand", fillable=True)

with ui.layout_columns(col_widths=[9, 3]):
    with ui.card(full_screen=True):

        @render_embedding_atlas
        def atlas():
            return EmbeddingAtlasWidget(
                ISSUES[COLUMNS], x="projection_x", y="projection_y", text="text"
            )

    with ui.card():
        ui.card_header("Export")
        "Download exactly the issues currently selected (chart click, box, or lasso)."

        @render.download_button(filename="issues_selected.csv", label="Download CSV")
        def download():
            sel = atlas.selected()
            yield sel[["repo", "state", "title"]].to_csv(index=False)
Before any selection (6,088 rows), and after clicking the “py-shinywidgets” bar:
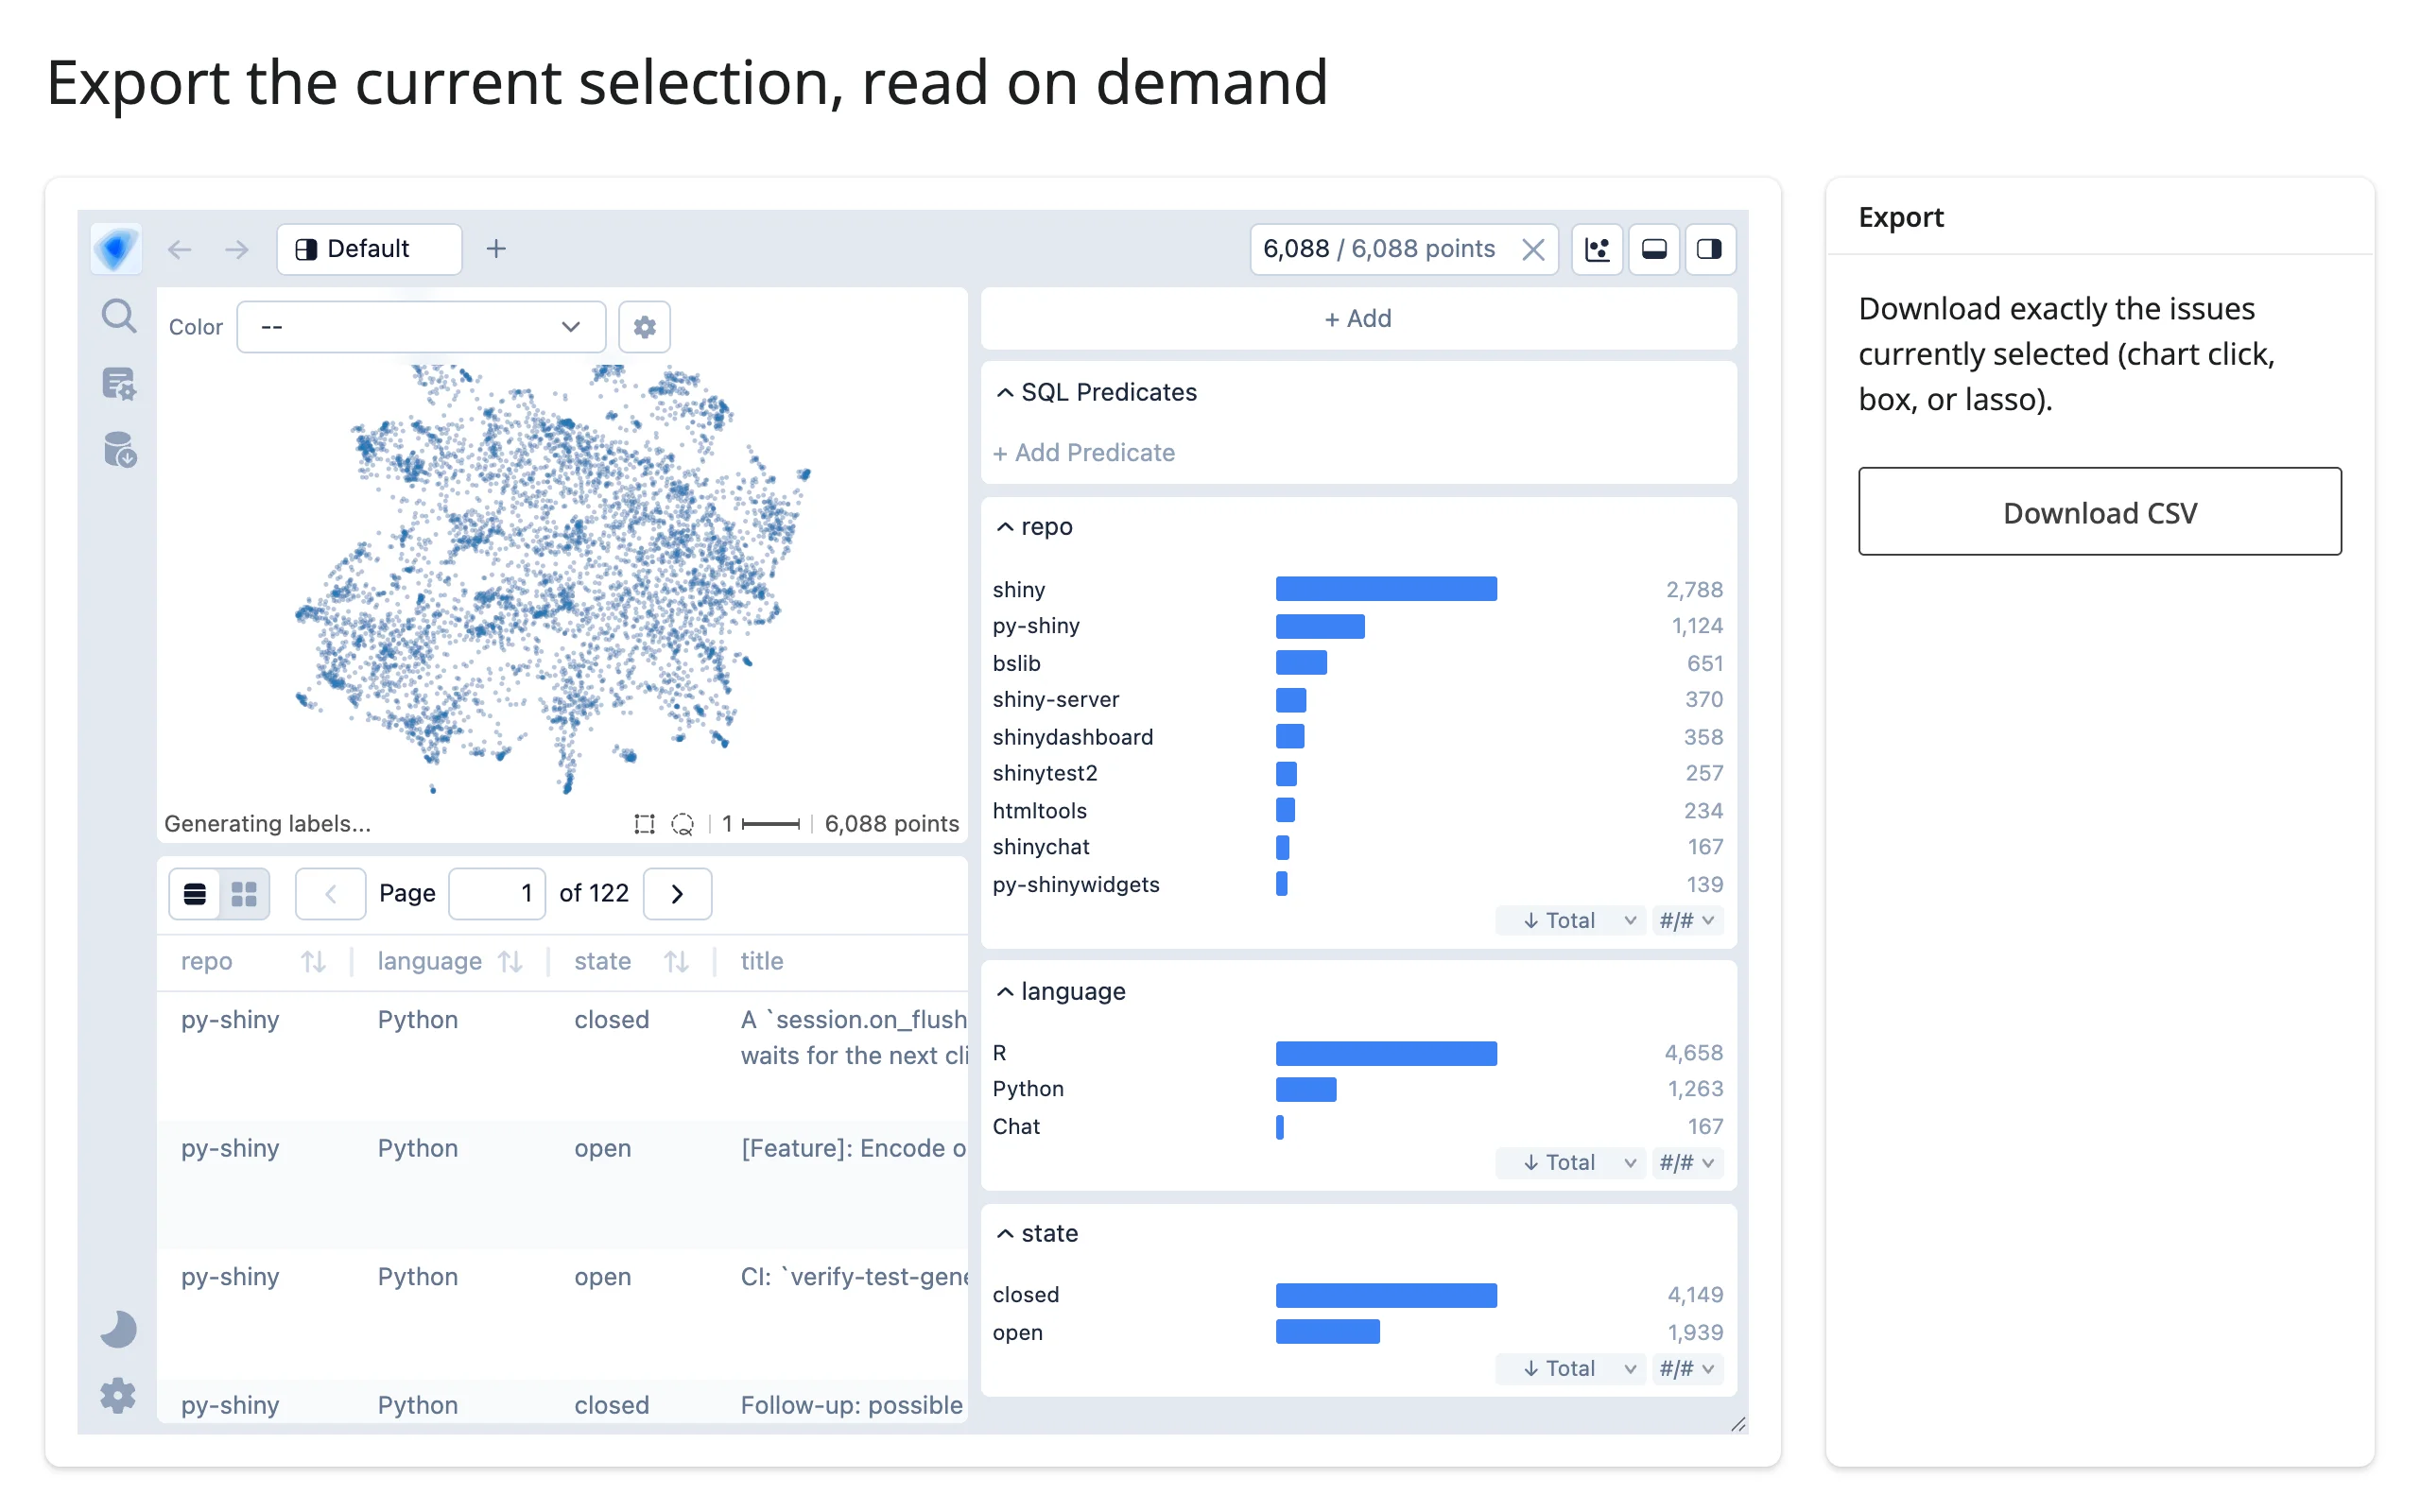
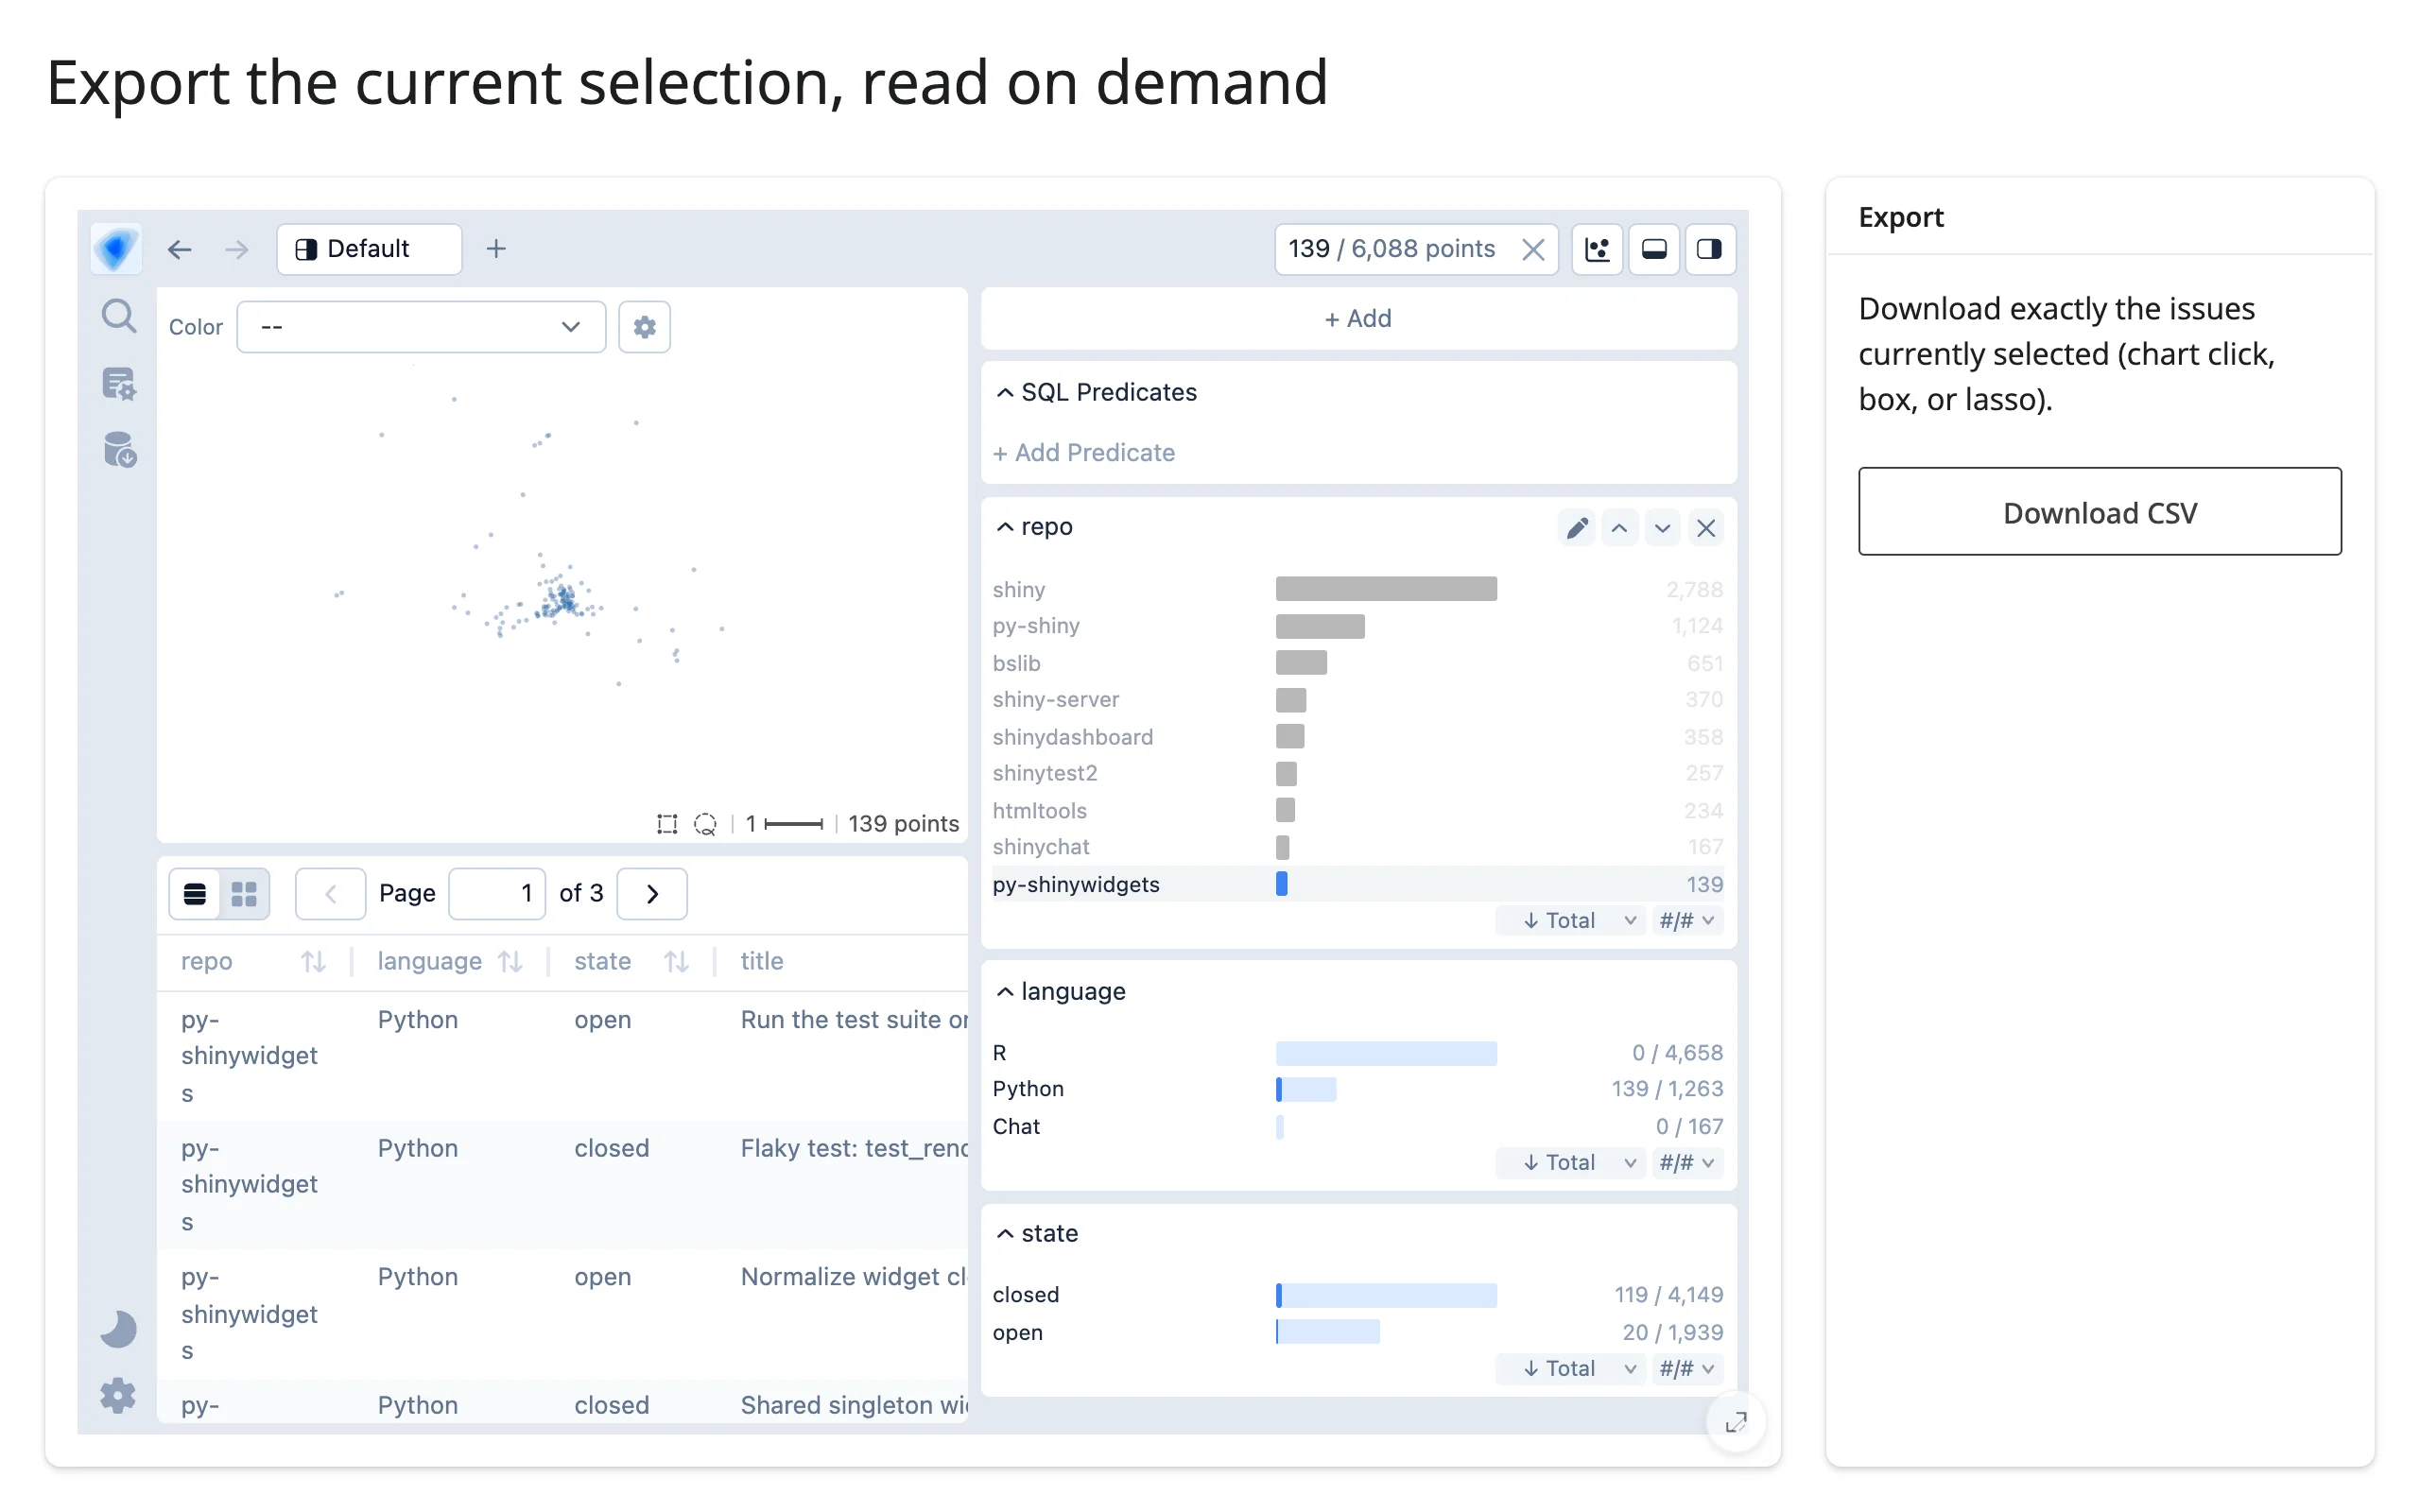
Verified end to end: the downloaded CSV has exactly 139 data rows, every one with repo equal to py-shinywidgets, matching the explorer’s own “139 / 6,088 points” count.
Large data
Embedding Atlas combines two large-data approaches at once: the embedding map is a GPU-rendered scatter (WebGPU, the same regl-style rendering jscatter uses), and every chart, table, and cross-filter runs as a DuckDB query in-process, so only the matching rows or a predicate cross the wire – not the underlying table. This guide’s own examples use a real but modest 6,088-row dataset (sized for a fast, gesture-verified demo), so we didn’t build a dedicated scale example here; for measured ceilings on each half, see jupyter-scatter (bare GPU scatter at scale) and quak or mosaic (DuckDB-backed views). This combines the “draw it with the GPU in the browser” and “only send what’s visible” approaches from Large data & performance.
Layout and sizing
# Fill behavior: with no explicit height, the output grows to fill its card
# (left, `full_screen=True` card). An explicit height (right) always wins --
# the explorer fits itself to it, growing or shrinking from its own 650px
# default. Outside a fillable container, give it at least 600px.
from pathlib import Path

import pandas as pd
from embedding_atlas.widget import EmbeddingAtlasWidget
from shiny.express import ui
from shinywidgets import render_embedding_atlas

ISSUES = pd.read_parquet(Path(__file__).parent / "data" / "issues.parquet")
COLUMNS = ["repo", "language", "state", "title", "text", "projection_x", "projection_y"]  # fmt: skip


def small_atlas():
    return EmbeddingAtlasWidget(
        ISSUES[COLUMNS], x="projection_x", y="projection_y", text="text"
    )


ui.page_opts(title="Fillable card vs. a fixed-height output", fillable=True)

with ui.layout_columns(col_widths=[8, 4]):
    with ui.card(full_screen=True):
        ui.card_header("Fills the card (no explicit height)")

        @render_embedding_atlas
        def atlas_fill():
            return small_atlas()

    with ui.card():
        ui.card_header('height="650px"')

        @render_embedding_atlas(height="650px")
        def atlas_fixed():
            return small_atlas()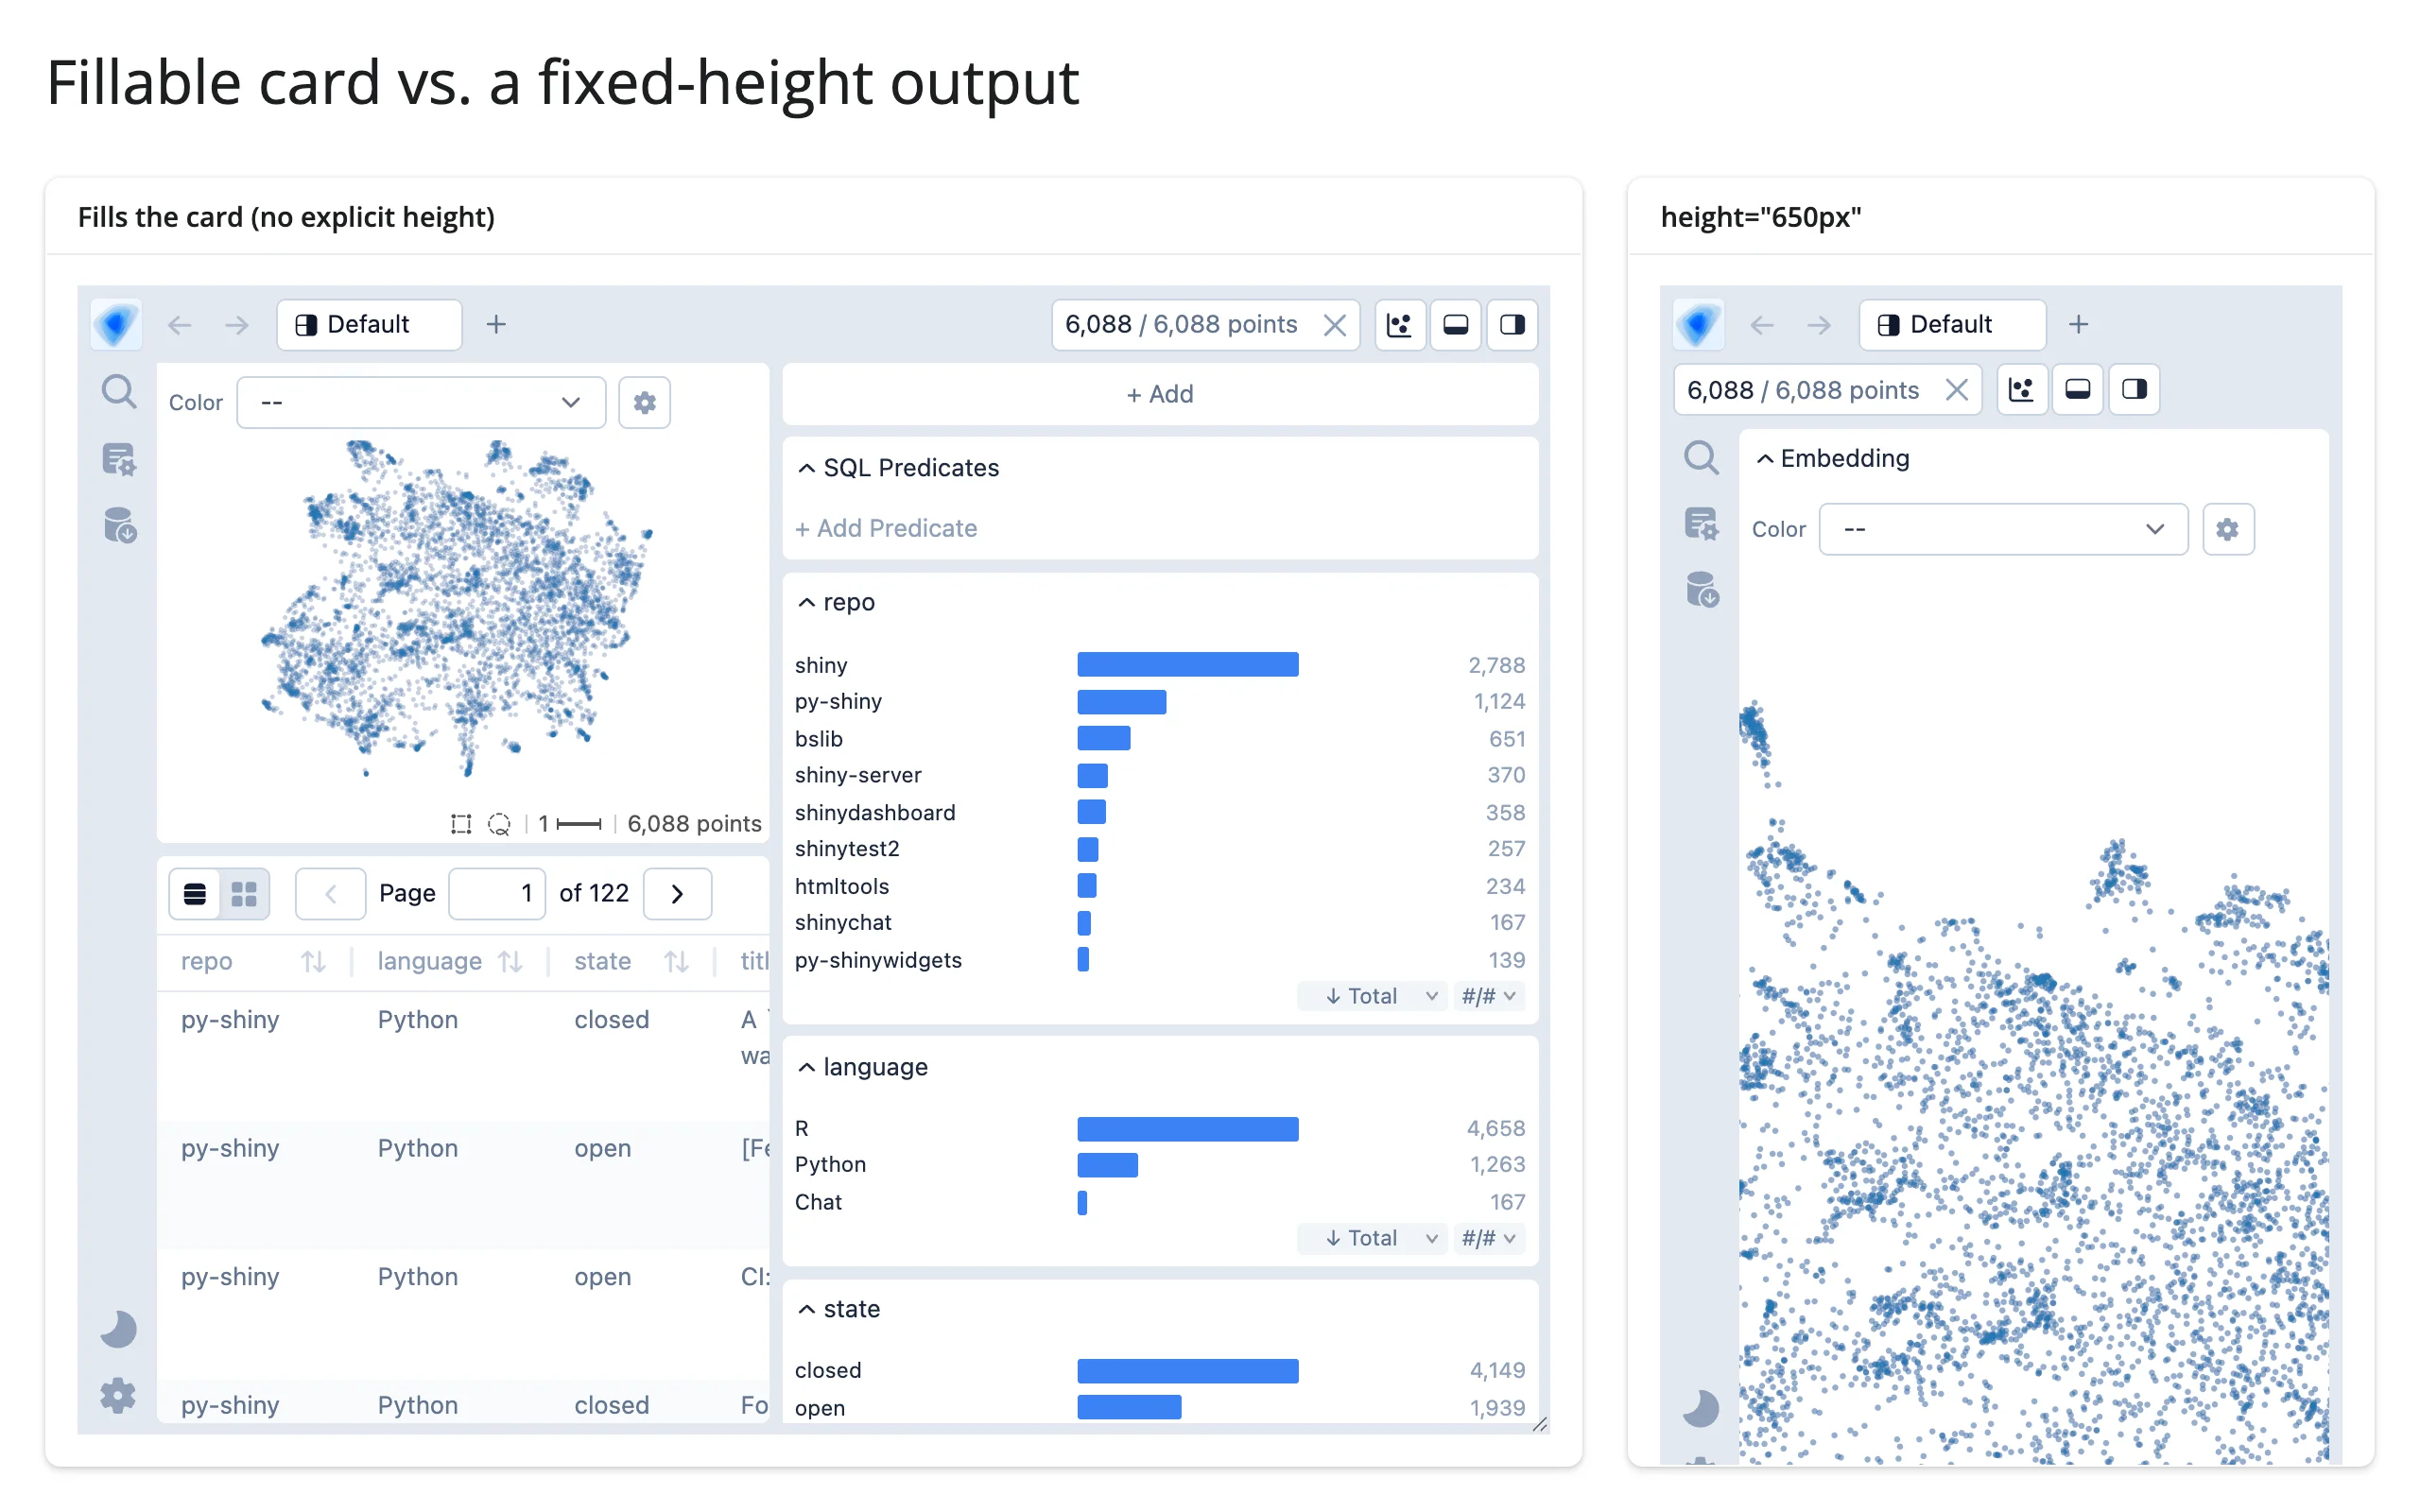
- With no explicit height, the output fills its parent (
full_screen=Trueworks well for an explorer this dense). In a non-fillable layout, giveoutput_widget()/@render_embedding_atlasan explicit height of at least 600px – the library’s own default is 650px, and shinywidgets fits the explorer to a smaller explicit height too (it can clip the chart panel if you go much below that). - The narrower card in the screenshot (about 590px) shows the library’s own responsive behavior: below a certain width, the explorer collapses its chart/table side panel behind the toggle icon at the top right. That’s upstream’s layout, not something shinywidgets controls.
Gotchas and limitations
- Security: lock down the DuckDB connection, or don’t deploy this. The explorer works by sending SQL from the browser to the widget’s DuckDB connection (
{type: "json"|"arrow"|"exec", sql: ...}), and without restrictions, any visitor can run arbitrary SQL with the server process’s permissions – including reading or writing files.@render_embedding_atlaslocks the connection down by default (SET enable_external_access = false; SET lock_configuration = trueafter construction), verified to block both file reads and file writes while leaving the explorer fully functional. Only passallow_unrestricted_connection=Truefor a local, single-user app. Even locked down, a visitor can still run expensive queries that block your server while they run – there’s no DuckDB statement timeout to cap this. quak and mosaic lock down their connections the same way, with the sameallow_unrestricted_connection=Trueopt-out; pygwalker uses a related but stricter scheme (it requires the lockdown, with no opt-out, because every PyGWalker widget in the process shares one connection). - Reading
.widgetinside its own render function is a silent trap, and it’s worse on a re-render than the first one. On the very first render,atlas.widgetisNonethere (so it cancels the output, the way an unreadyreq()would). On every render after the first, it silently returns last render’s widget – stale, notNone, and nothing marks it as such. I verified this by instrumenting three consecutive renders directly. Keep the previous state you need in areactive.valuewritten by a separate@reactive.effect(asexamples/07_update_in_place.pydoes), not by reading.widgetfrom inside the render function that’s about to replace it.predicate()andselected()are safer here: calling either insideatlas’s own render function raises aRuntimeErrornaming the problem, rather than returning something stale. - The
labels=option’s documented"automatic"/"disabled"strings don’t work. The class docstring (andEmbeddingAtlasWidget’s own) says to passlabels="automatic"for auto-labels orlabels="disabled"to turn them off. Neither does what it says: I tried both, plus a custom label dict shaped exactly like the docstring’s own example, against the same data that shows labels perfectly well whenlabelsis just left unset. Both strings silently produced a map with zero labels – identical results, despite claiming opposite behavior – and the custom label dict threw a page error (Cannot read properties of undefined (reading 'width')) that also left zero labels on screen. Tracing the frontend bundle confirms why: the literal strings"automatic"and"disabled"don’t appear anywhere in it, and the real on/off switch (embeddingViewConfig.autoLabelEnabled, default on) isn’t exposed by any Python option at all.embeddingViewLabels(whatlabels=actually sets) is a separate prop for supplying your own label list; giving it any non-Nonevalue – even a bogus string – appears to suppress the automatic generator as a side effect, without successfully substituting your own labels either. The only way to get automatic labels through this API is to not passlabels=at all. I could not find a working way to explicitly disable them or supply custom ones from Python. - Two widgets can’t share one DuckDB connection. The second
EmbeddingAtlasWidget(df, connection=con)construction on an already-used connection raisesCatalogException: Table "embedding_atlas" already exists. Create the connection inside the render function (or pass none and let the widget make its own default one) rather than at module scope if you expect more than one render. _propschanges from Python don’t apply to a live explorer, including things that do work as construction-time options (point_size, …). There’s no frontend listener that reapplies them after mount; a re-render is the only way to change them, same as_predicate.- Automatic labels need some density to trigger. The 139-row py-shinywidgets subset in “Updating the widget from Python” shows no labels at all after filtering to it – the full 6,088-row dataset’s clusters are dense enough to pass the label generator’s internal density threshold, but a small or sparse subset may not produce any. This looks like the library’s intended behavior (there’s no error, and it’s consistent across repeated renders), not a bug.
Gallery candidates
Template: atlas + live stats + detail table
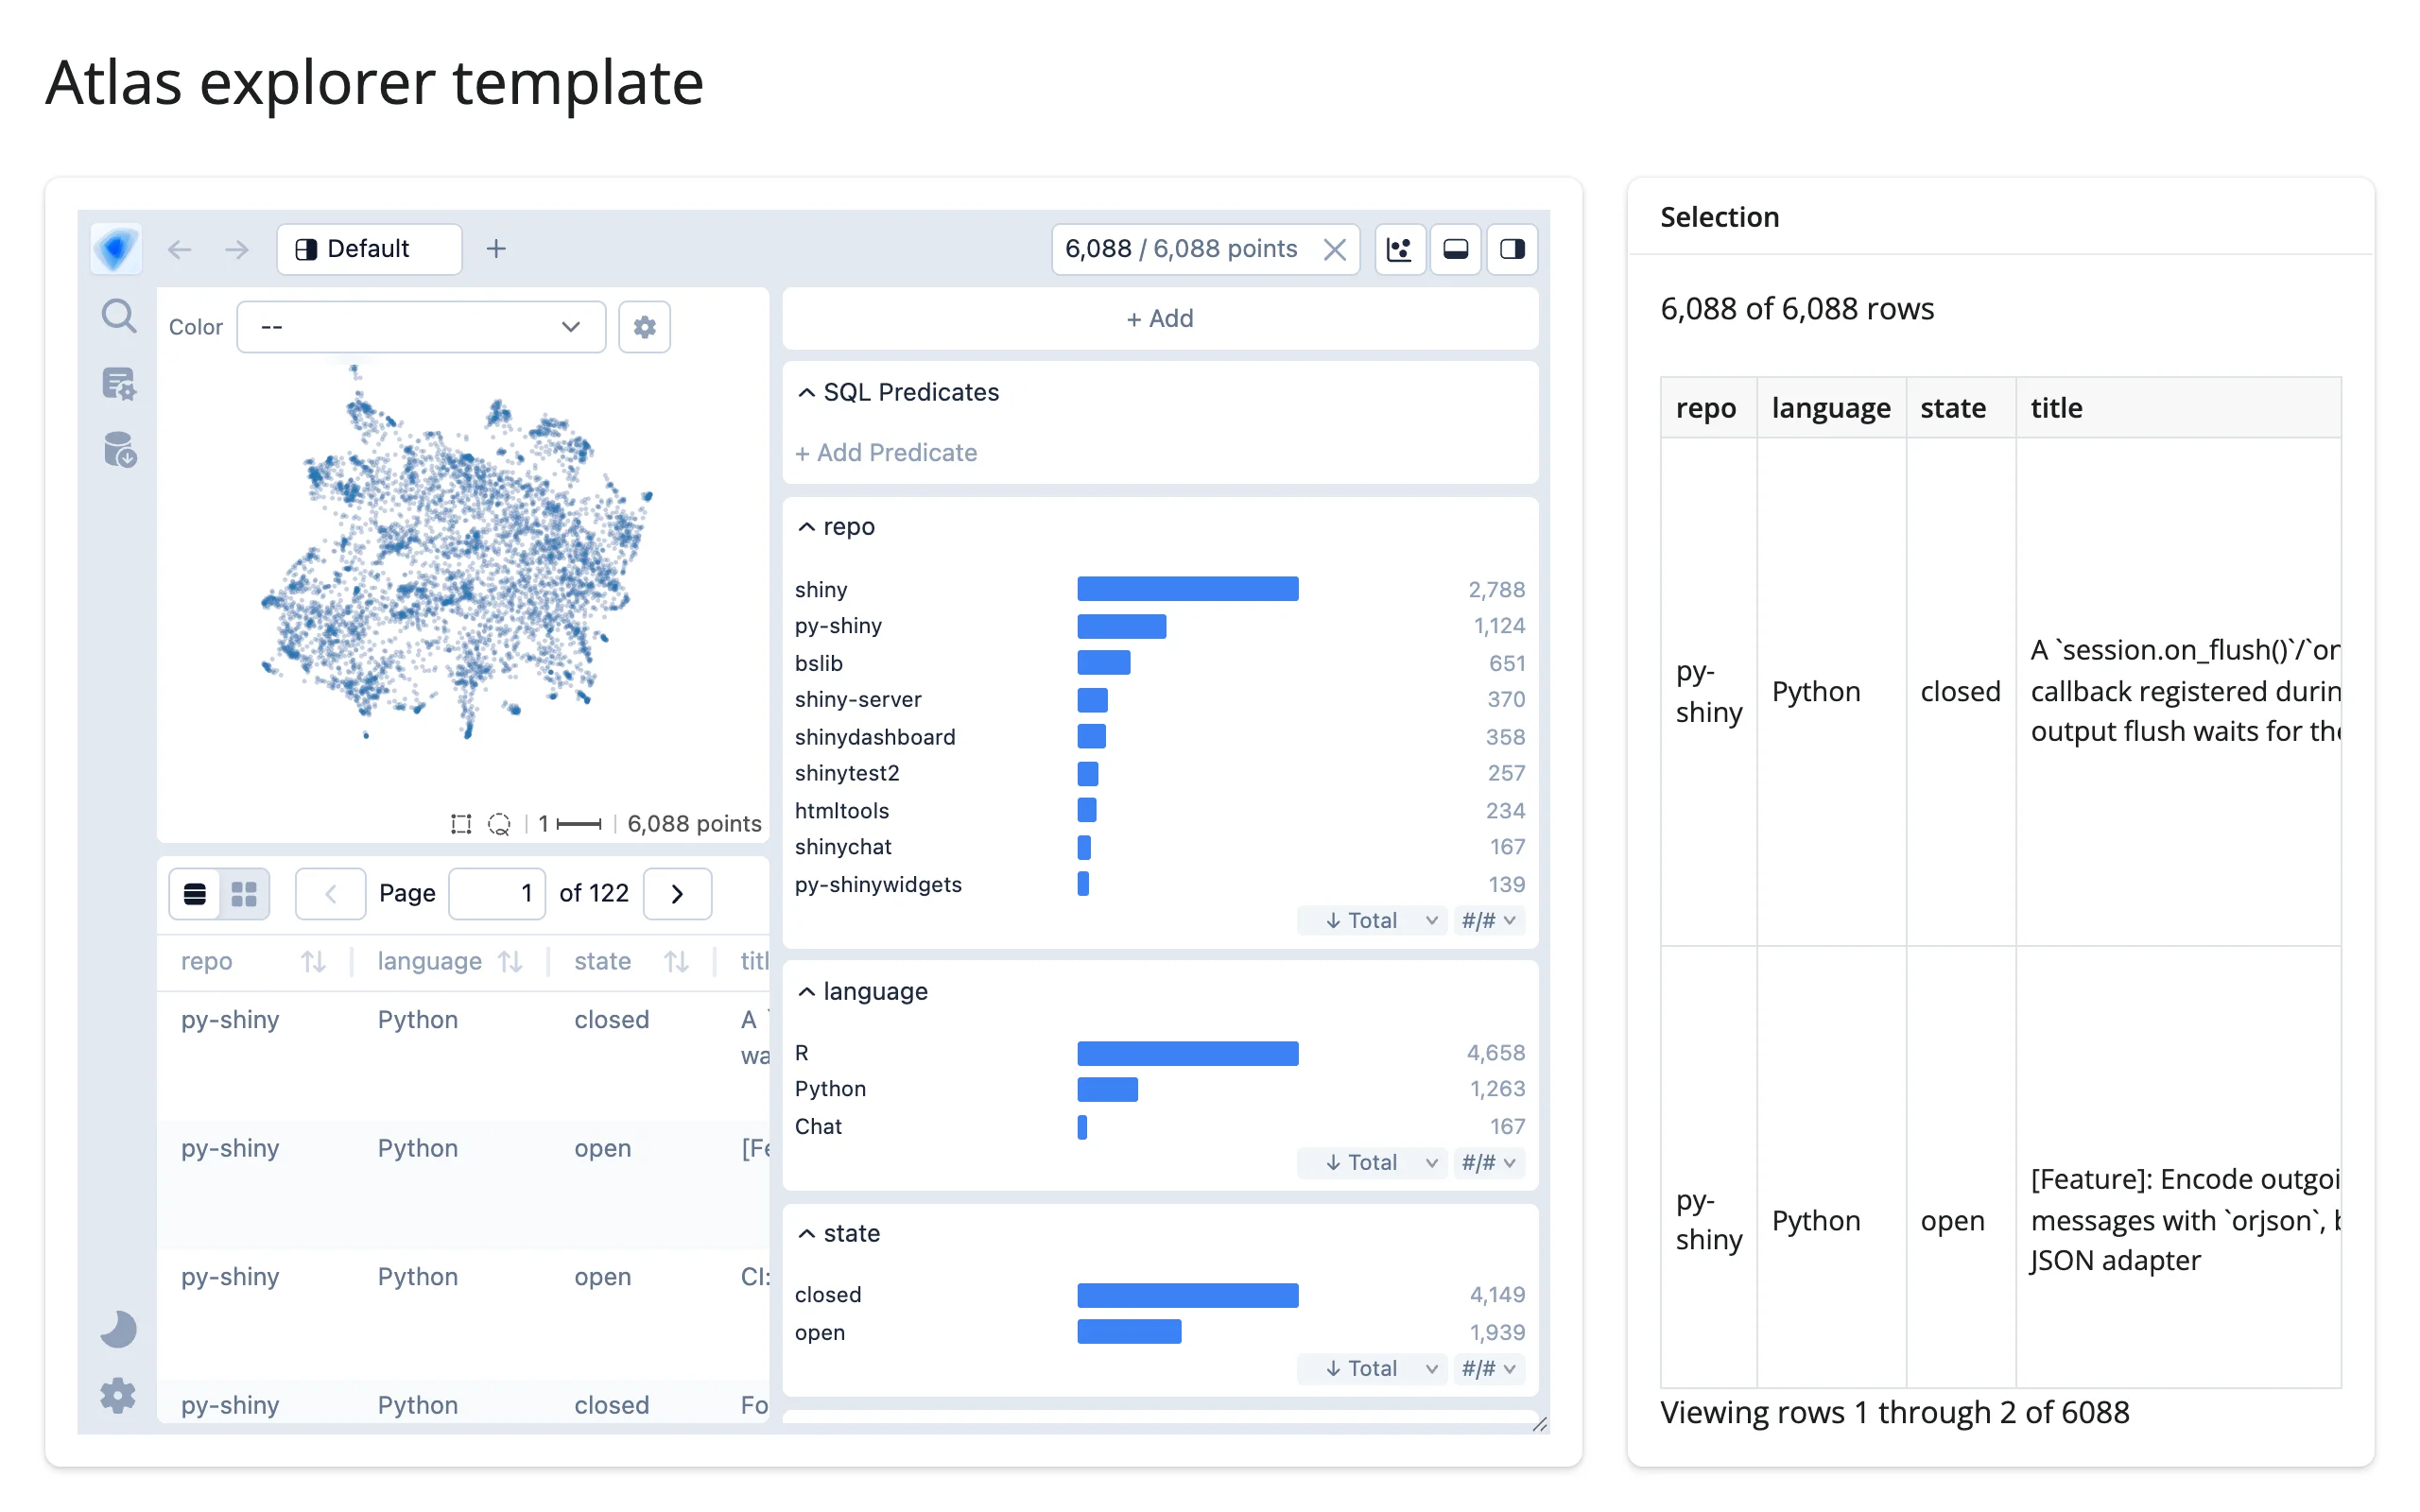
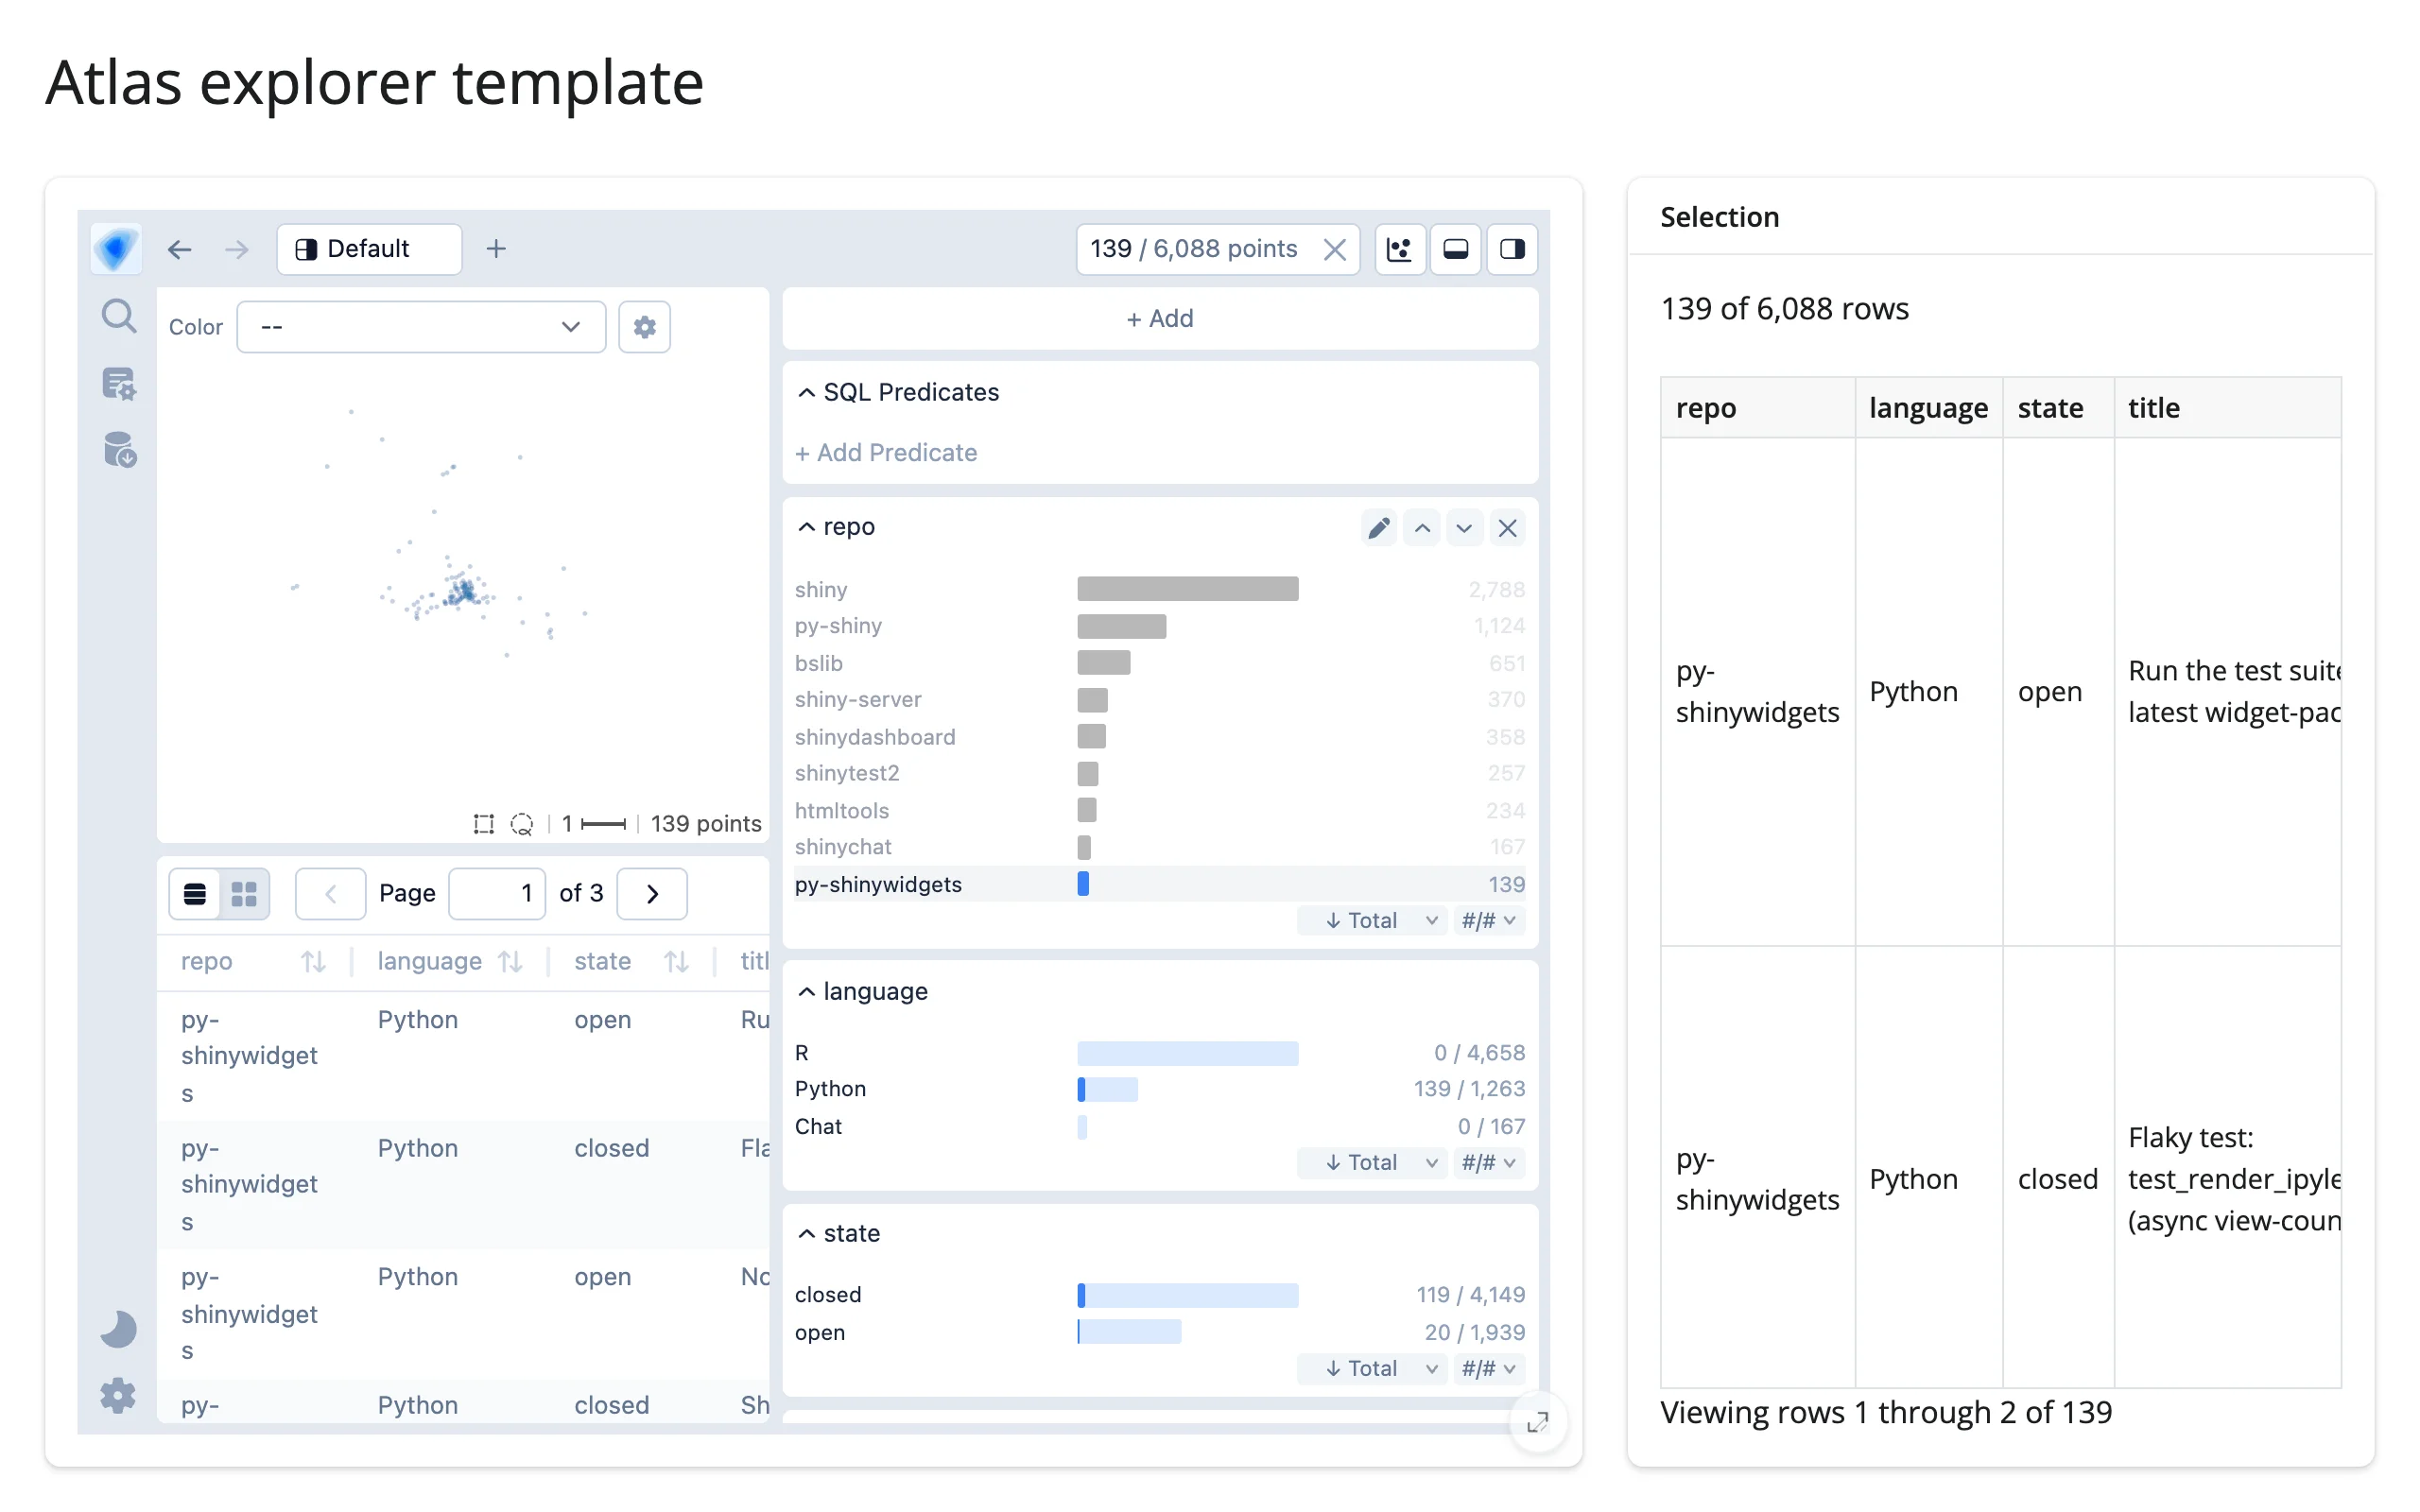
gallery/template_atlas_explorer.py – a minimal, adaptable starting point: an atlas next to a predicate()-driven count and a selected()-driven table, with the data frame and column names pulled to the top as constants to swap for your own.
Before any selection, and after clicking the “py-shinywidgets” bar:
Showcase: handwritten digits, with the average of your selection
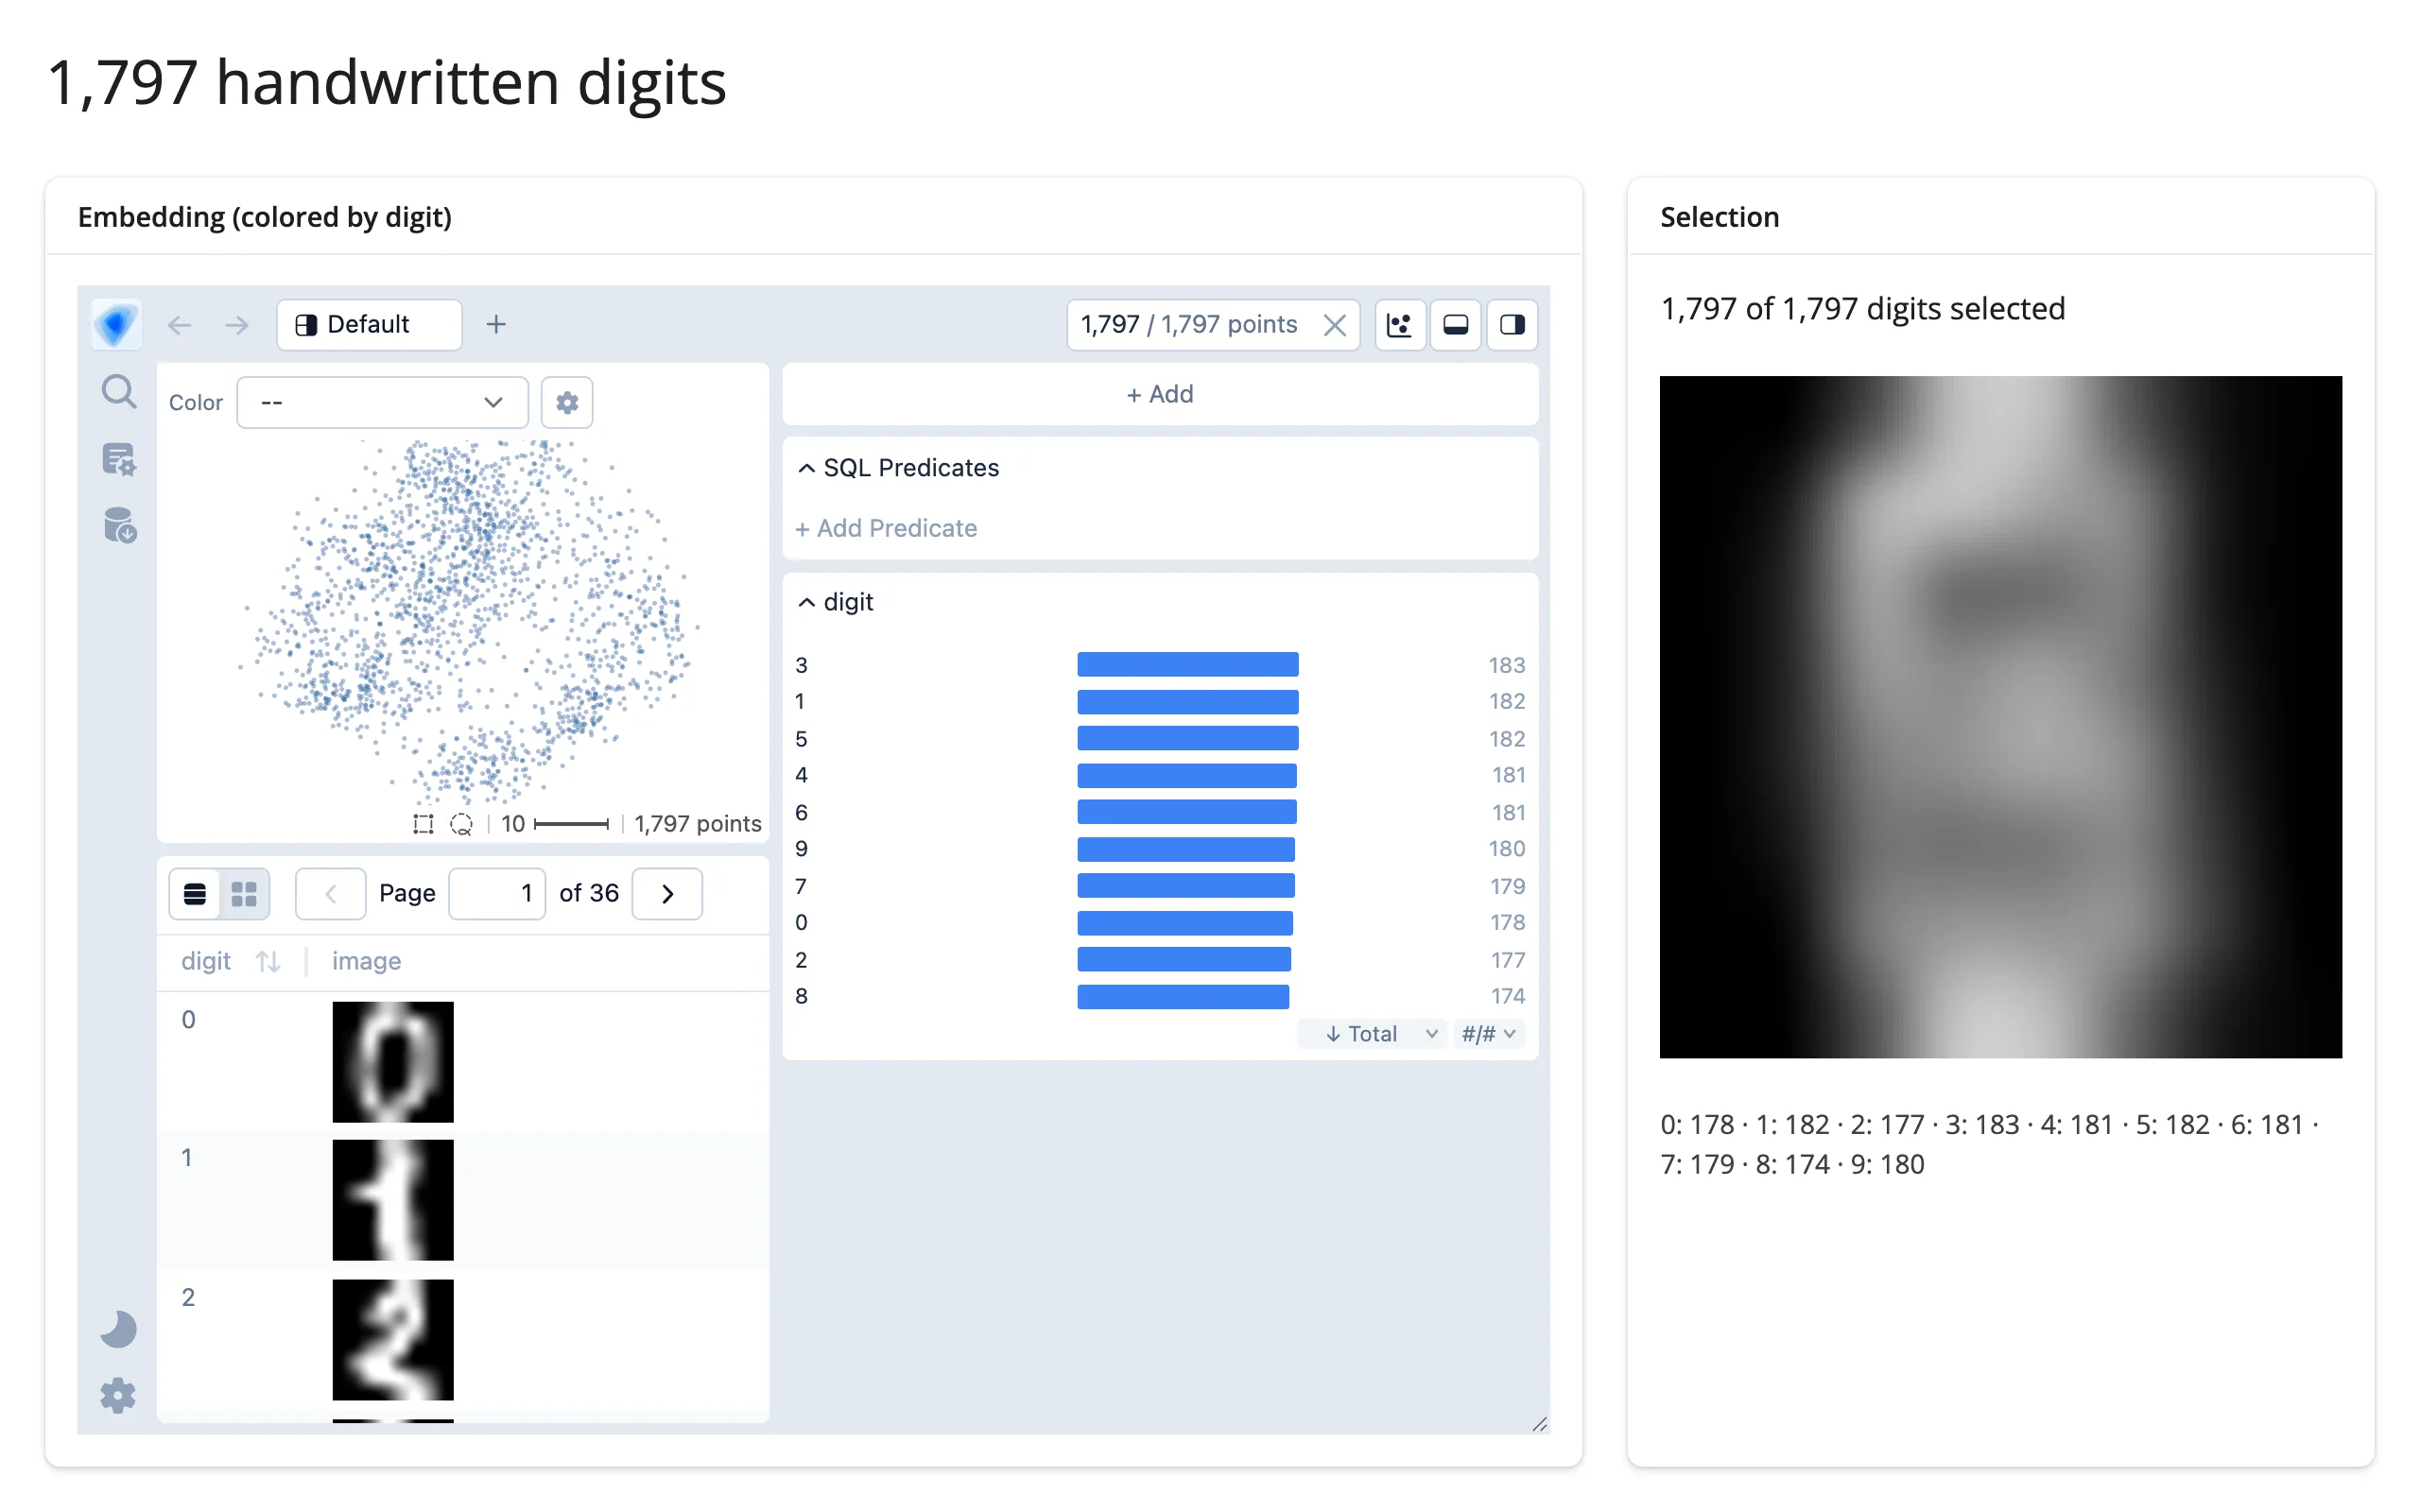
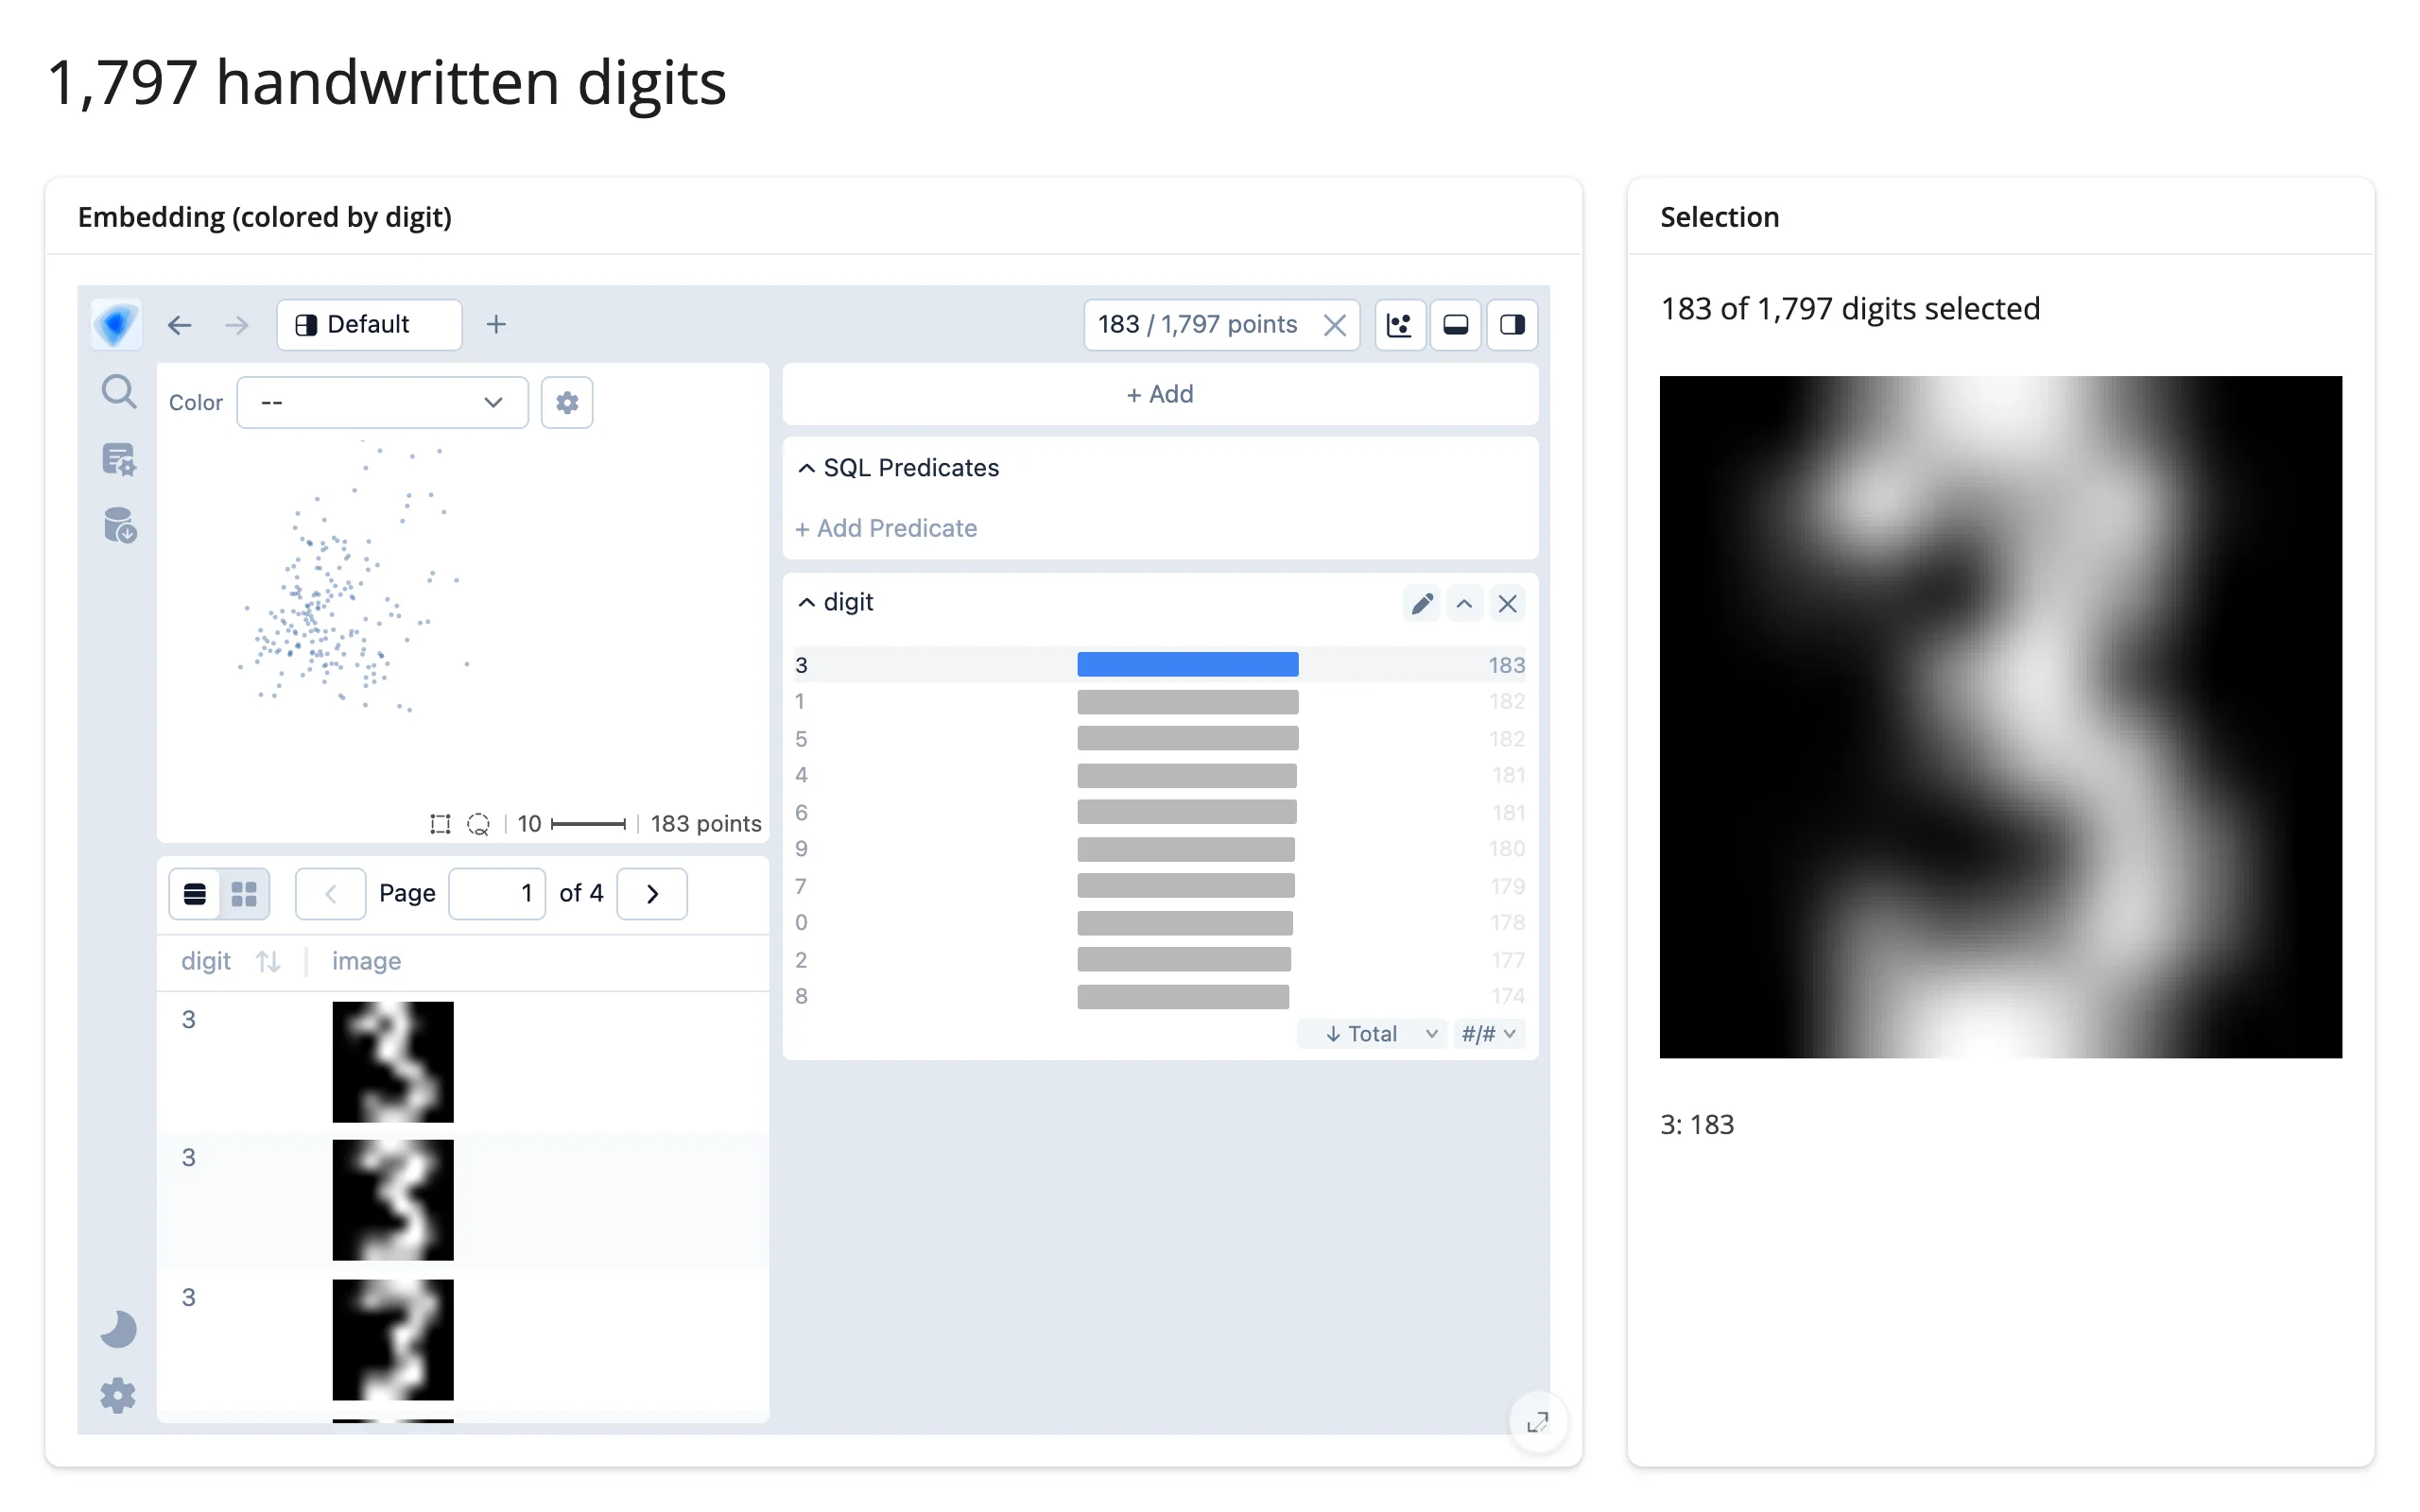
gallery/showcase_digits_atlas.py – 1,797 of sklearn’s bundled handwritten digit images, PCA-projected to 2D, each with an image thumbnail (see “Images in the explorer” above). Filter to any digit via the auto-generated bar chart and the sidebar reconstructs the average image of exactly that selection from selected()’s __row_index__ column – a concrete, visual payoff for “Python computes on what the user circled.” It works through the chart crossfilter alone, so it’s fully exercised even without a WebGPU-capable browser for the lasso.
Before any selection (the average of all 1,797 digits, an indistinct blur), and after clicking “3” in the digit chart (183 digits, and the average image is an unmistakable 3):
Learn more
- Embedding Atlas documentation and GitHub repository
embedding_atlas.projectionAPI reference forcompute_projection()and the lower-level text/image/vector functions- Related guides in this roster: jupyter-scatter (bare GPU scatter at scale), mosaic (grammar-based crossfilter dashboards), itables and perspective (tabular search without a map)