Why shinywidgets?
Much of Python’s interactive visualization – plotly, altair, lonboard, itables, and many more – is built as Jupyter widgets, made for notebooks. Notebooks are great for exploring, but they stall when it’s time to share what you found: everyone else needs your code, your environment, and the patience to run it.
Shiny bridges that gap between exploration and publication. Your analysis becomes a web app anyone can open, and it can grow from a few lines of Python into a sophisticated application without switching frameworks. shinywidgets brings the widgets you explored with along, so publishing doesn’t mean rebuilding with different tools.
In theory, any widget works, but dozens of popular libraries get first-class support:
- Your notebook code carries over. Return the figure, map, or table you’d display in a notebook, and shinywidgets handles the rest, including responsive sizing.
- What users do becomes an input. Each library’s own decorator, like
@render_plotly, adds methods for its interactions – a lasso, a click, an edited cell – that your app can read like any other input. - Updates are fast. You can change a widget that’s already on screen instead of rebuilding it, and each library’s guide shows how.
Here’s a whole app. Lasso some countries, and the table updates to match:
import plotly.express as px
from shiny.express import render, ui
from shinywidgets import render_plotly

df = px.data.gapminder().query("year == 2007").reset_index(drop=True)

ui.page_opts(title="Gapminder 2007", fillable=True)

with ui.layout_columns():

    with ui.card(full_screen=True):
        ui.card_header("Lasso some countries")

        @render_plotly
        def plot():
            fig = px.scatter(
                df, x="gdpPercap", y="lifeExp", color="continent", log_x=True,
                hover_name="country", custom_data=[df.index],
            )
            return fig.update_layout(dragmode="lasso")

    with ui.card(full_screen=True):
        ui.card_header("Selected countries")

        @render.data_frame
        def table():
            return plot.selected_rows(df)[["country", "continent", "lifeExp"]]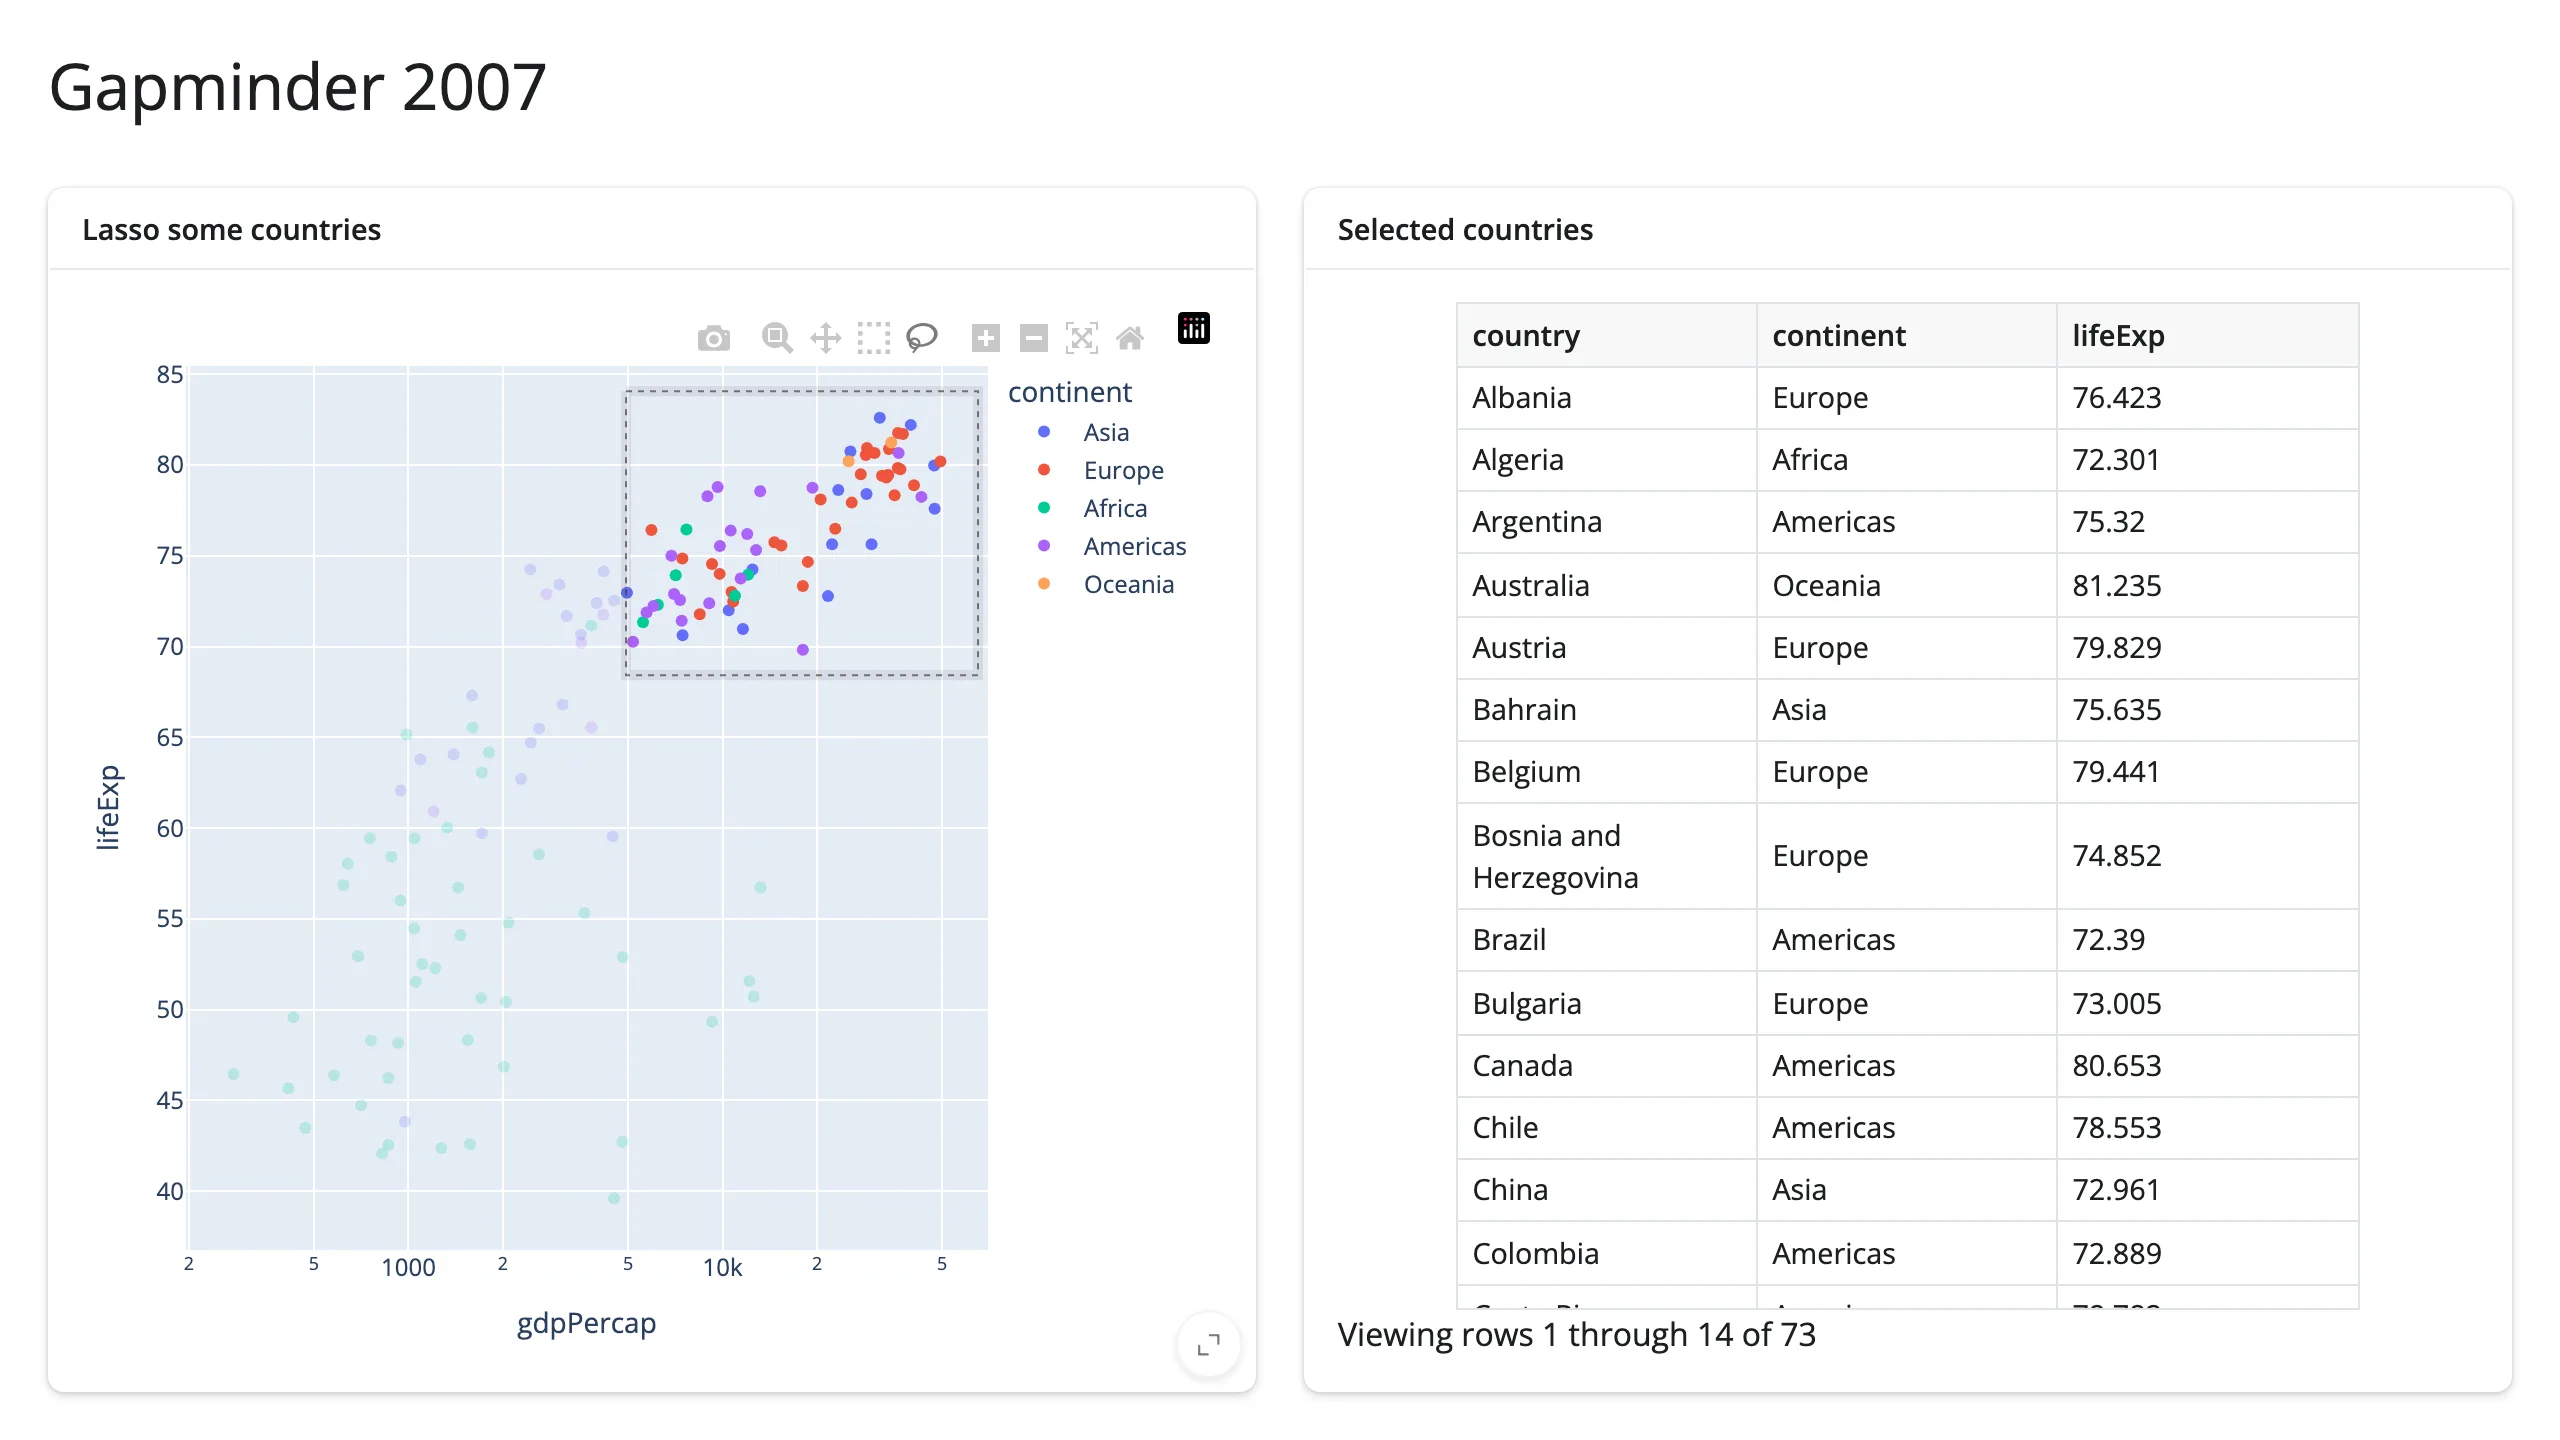
Each decorated function is one piece of the page. Your first widget app builds an app like this step by step, then updates the chart in place.
Reactive, not event-driven
Traditionally, responding to widget interactions requires event-driven programming: you write a callback for each thing the user might do, and each callback has to update every part of the page that cares. As an app grows, keeping those callbacks in step gets hard, and a missed one leaves views that quietly disagree.
With shinywidgets, what the user did is captured in a reactive value, not an event. Anything that reads it, like the table above, updates whenever it changes, the way a spreadsheet formula updates when a cell it uses changes. Adding another view means writing one more function that reads the same value; nothing else changes. Reacting to widgets covers the details.
Staying responsive
When something in an app changes, say the user picks a new highlight color, the obvious way to show it is to rebuild the widget: rerun the function that made it. For a big chart or map, that’s where an app starts to feel sluggish. The whole widget goes back to the browser and starts over, so every change means a wait, and the user loses their zoom and selection each time.
shinywidgets lets you update the widget that’s already on screen instead, sending only what changed. The difference is large: recoloring a plotly chart’s points in place sends 36 KB, while rebuilding the chart sends 5.5 MB, because a rebuild resends plotly’s JavaScript too.
Updating in place shows how, and Large data & performance has the measurements.
Is it for you?
shinywidgets fits when you want people to do something with your charts, maps, and tables – select, filter, drill in – and have the rest of the app respond. How that compares to what you might be using now:
- Jupyter notebooks or Voilà. Voilà turns a notebook into a web page, but it’s still a notebook underneath: by default the layout follows your cells, every visitor gets their own Python kernel, and interactivity means
observe()callbacks. A Shiny app is designed as an app from the start, with layouts like sidebars and cards, one server process for many visitors, and reactive values instead of callbacks, all using the widgets you already know. - Streamlit. Streamlit reruns your script (or a fragment of it) on every interaction, so charts are rebuilt each time, and caching and session state are how you keep that fast and stateful. Here, only what depends on a change reruns, widgets update in place, and you can draw on the whole Jupyter widget ecosystem.
- Dash. Dash apps are wired together with callbacks that name their inputs and outputs, and bringing in a new kind of widget means a Dash component written in React. Here, Shiny works out what depends on what, and Jupyter widgets work as they are.
If a static image or a shared notebook already does the job, you don’t need any of this. And if you’re used to callbacks, reactivity takes a little getting used to; Reacting to widgets covers the model.
Next: install shinywidgets, then build your first widget app.