HoloViews & hvPlot
HoloViews is a declarative plotting library from the HoloViz project (the same group behind Panel, Datashader, and GeoViews). Instead of building a figure imperatively, you wrap data in typed elements (Curve, Scatter, Image, …) and HoloViews decides how to draw them; * overlays elements on shared axes and + lays them out side by side, so multi-panel figures need no subplot bookkeeping. hvPlot puts a .hvplot accessor on pandas (and xarray/dask/polars) objects that returns the same HoloViews objects from one-line calls – it’s usually the faster way in, and this guide leans on it.
@render_holoviews accepts a HoloViews, hvPlot, or GeoViews object, or the underlying jupyter_bokeh.BokehModel widget. It renders through Panel to Bokeh (pip install 'shinywidgets[holoviews]'), gets the same layout defaults and sizing fixes as render_bokeh and render_panel, and keeps HoloViews’ own Python-side interactivity alive without a Bokeh server: HoloMap/DynamicMap widgets, linked streams (Tap, BoundsXY, Selection1D, …), and hv.link_selections crossfiltering all just work. There are no reactive accessors here (see Reacting to user interaction for why and what to do instead) – the interaction surface is HoloViews’ own stream objects, and this guide is mostly about wiring those into Shiny.
Choose HoloViews/hvPlot when you want the HoloViz ecosystem’s crossfilter story (link_selections across several plots with no callbacks), quick exploratory one-liners over a DataFrame, or you’re already building on Datashader or GeoViews. Choose bokeh directly for fine, low-level control and four built-in accessors (selected(), tapped(), zoomed(), …). Choose panel if you’re building a general Panel app rather than plotting.
Installation
pip install 'shinywidgets[holoviews]'That installs holoviews, panel, and jupyter_bokeh>=4.1 (the version floor matters: earlier jupyter_bokeh falls back to a CDN for its JS, so offline apps render blank). hvPlot is not included – add pip install hvplot yourself; it’s such a common pairing that every example below uses it. If you use pure HoloViews without import hvplot.pandas (which registers the Bokeh extension as a side effect), call hv.extension("bokeh") once at the top of your app before calling .opts() – otherwise .opts() raises ValueError: No plotting extension is currently loaded (verified on current main). Datashader-rasterized plots and GeoViews maps also render through @render_holoviews; they get their own guides and are only mentioned in passing here.
Quick start
# A quick-start hvPlot scatter: one line of pandas turns into an interactive
# Bokeh plot (pan, zoom, hover) with no extra ceremony.
import plotly.express as px
import hvplot.pandas  # noqa: F401 -- registers the .hvplot accessor on DataFrames
from shiny.express import ui

from shinywidgets import render_holoviews

tips = px.data.tips()

ui.page_opts(title="Tips, by total bill and tip", fillable=True)


@render_holoviews
def scatter():
    return tips.hvplot.scatter(
        "total_bill",
        "tip",
        by="day",
        responsive=True,
        title="Tips vs. total bill",
        hover_cols=["size"],
    )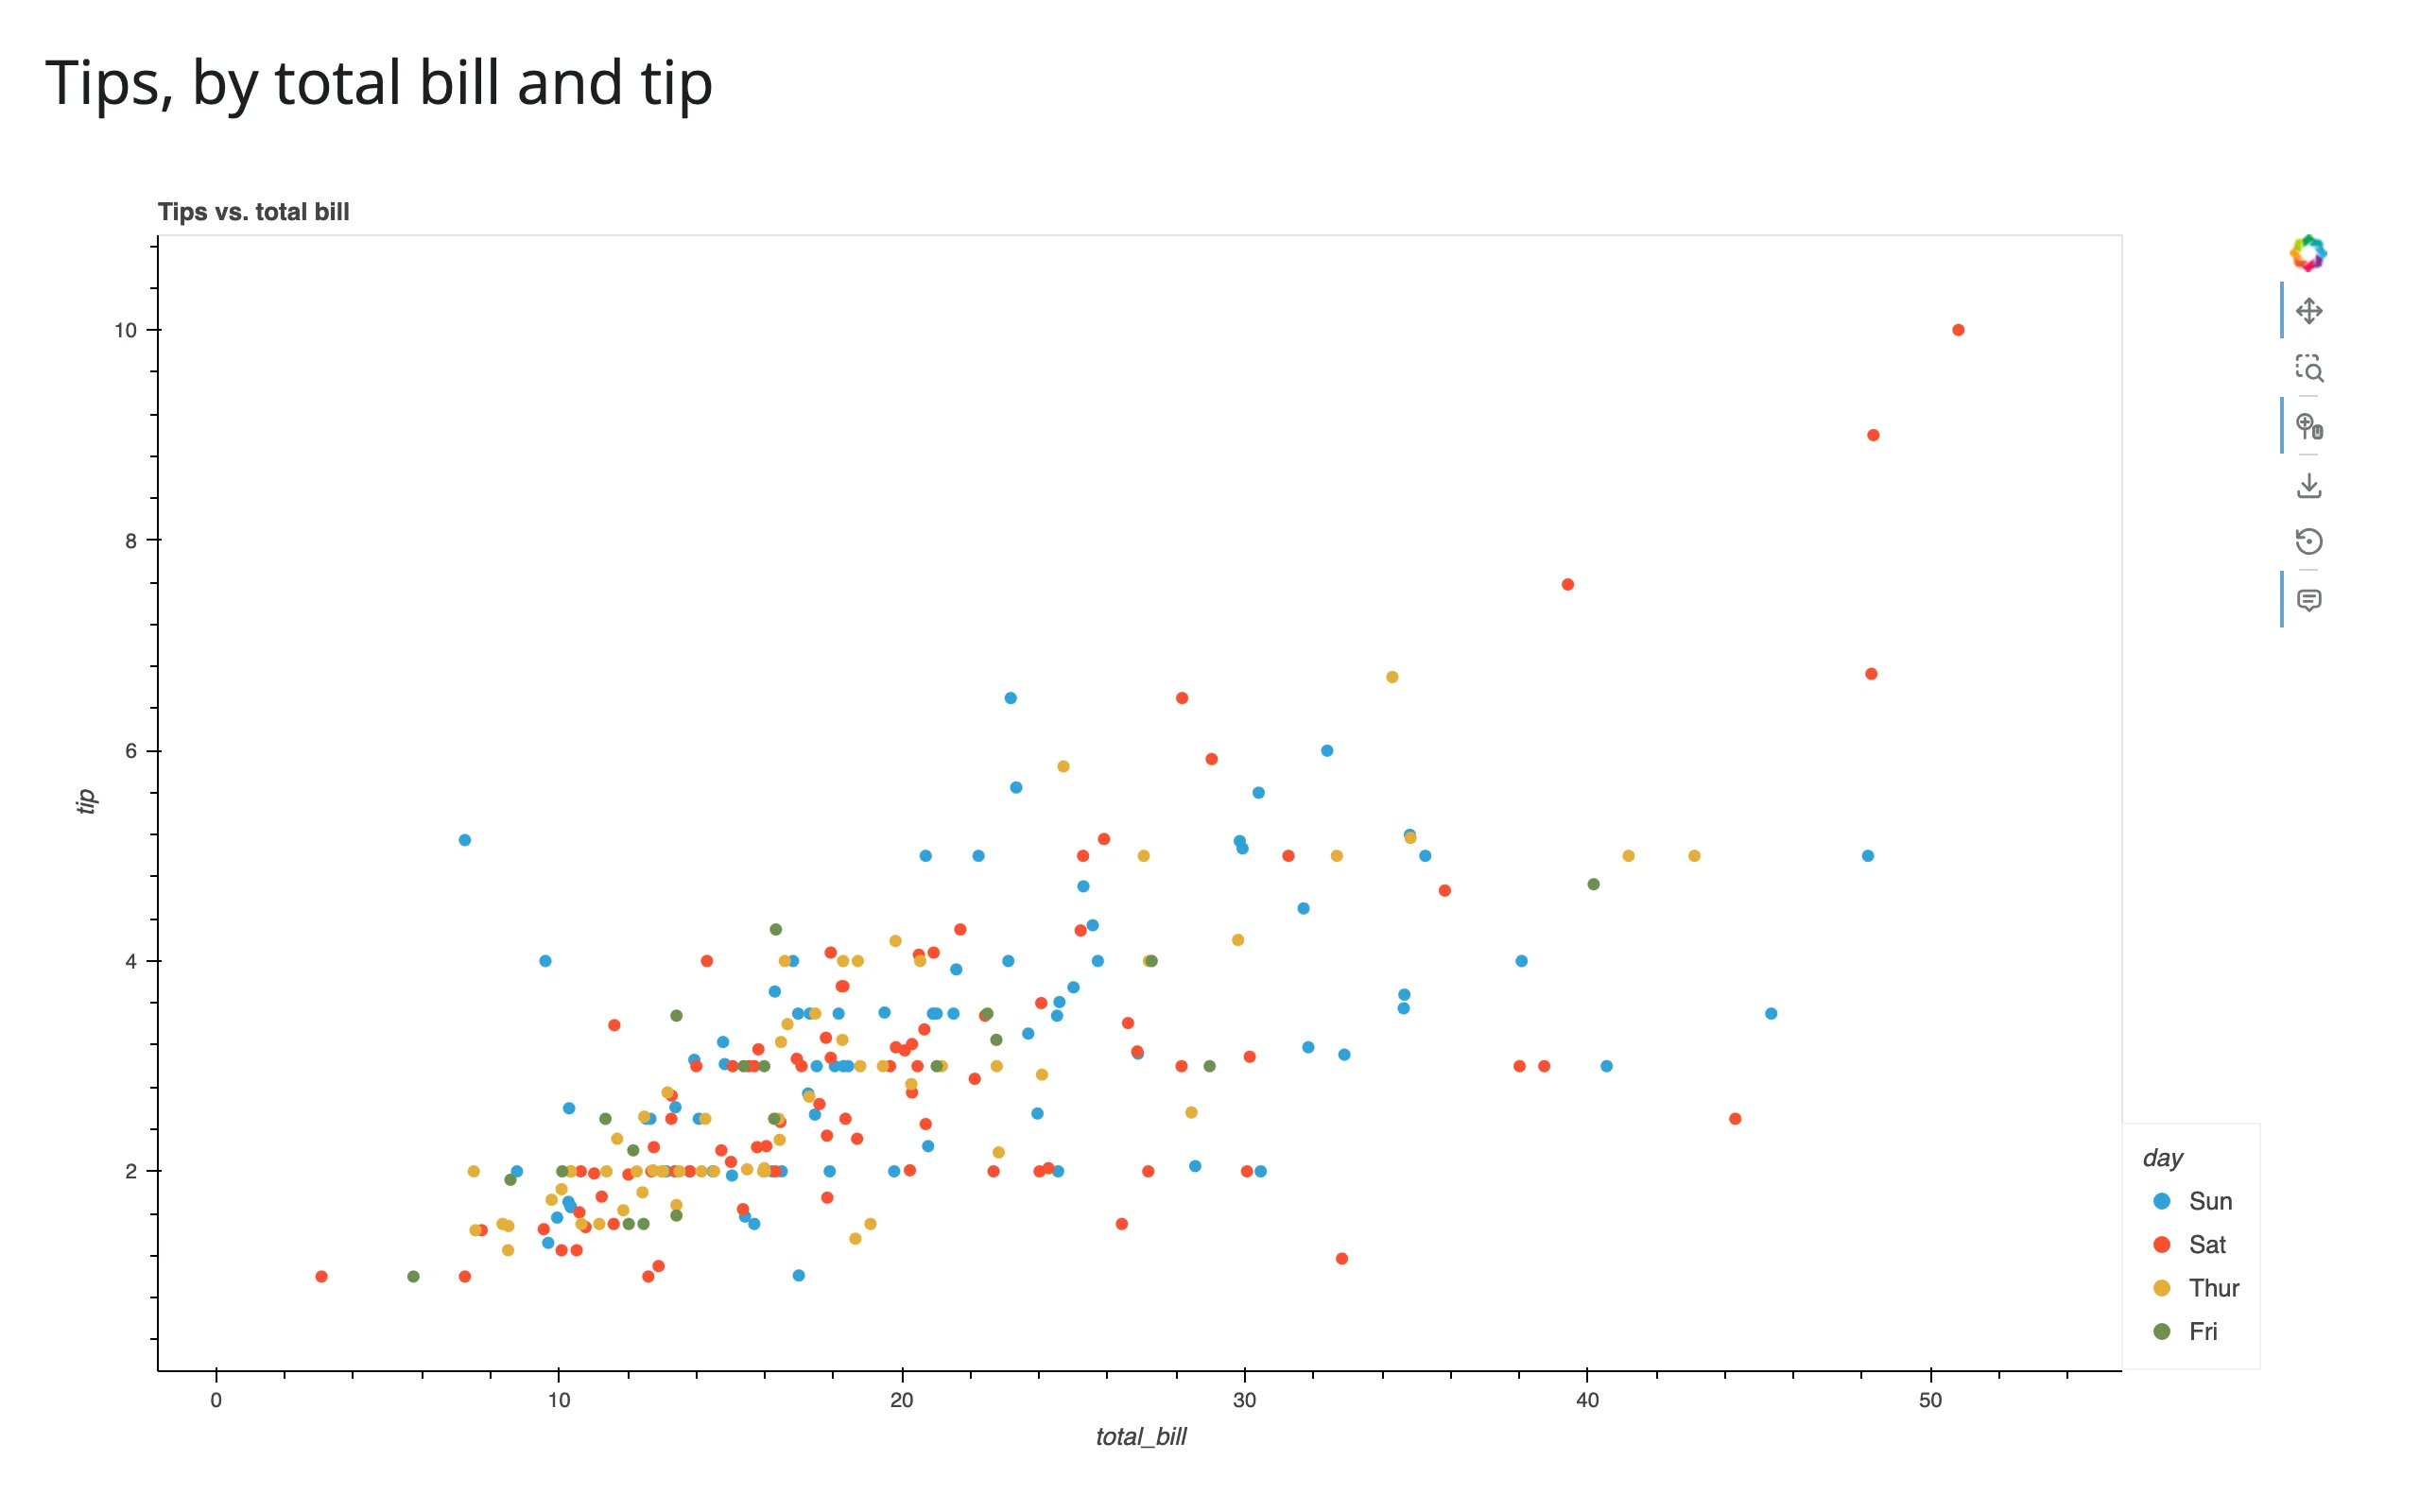
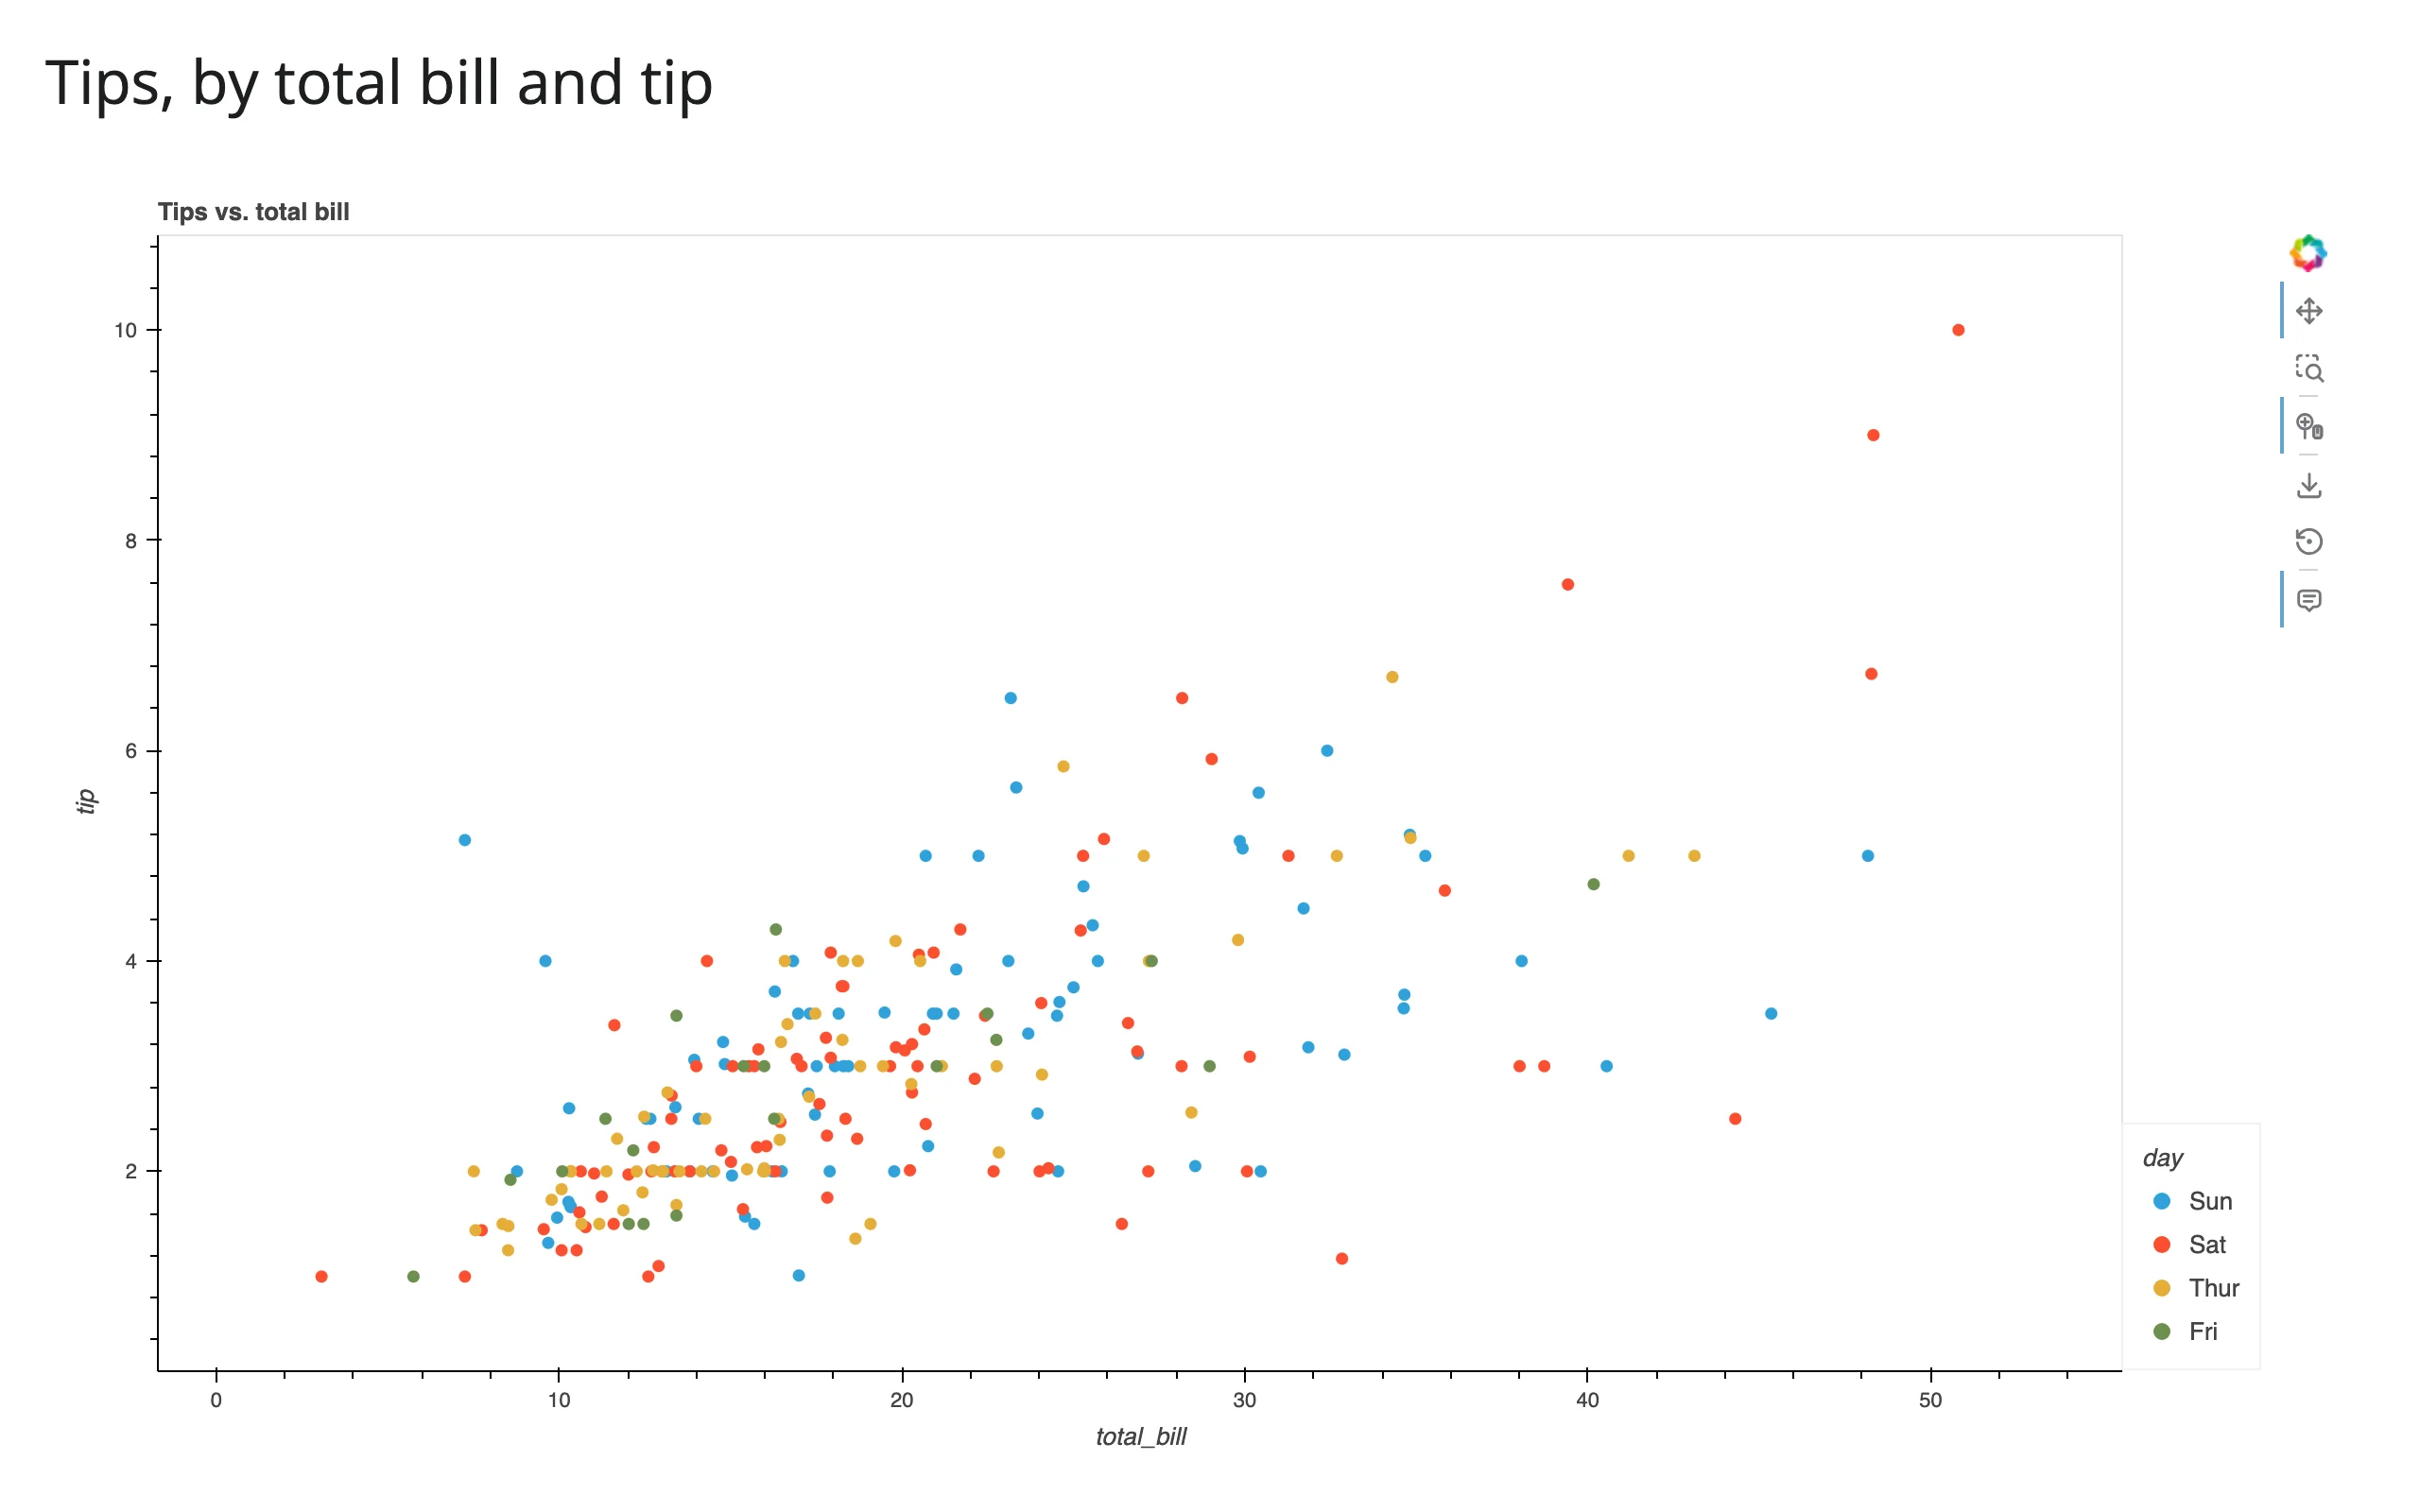
One .hvplot.scatter() call produces a fully interactive Bokeh plot: pan, zoom, hover tooltips, and a clickable legend, all for free. responsive=True is the one thing to remember – without it the plot is a fixed 700x300px and won’t fill its card (see Layout and sizing).
What you can build
Composing with * and +
examples/02_overlays_layouts.py – overlay two elements on the same axes with *, or lay out independent plots with +:
# Compose plots with `*` (overlay, same axes) and `+` (layout, side by side) --
# no subplot bookkeeping required.
import holoviews as hv
import plotly.express as px
import hvplot.pandas  # noqa: F401
from shiny.express import ui

from shinywidgets import render_holoviews

hv.extension("bokeh")

tips = px.data.tips()
by_day = tips.groupby("day", observed=True)["tip"].mean().reindex(
    ["Thur", "Fri", "Sat", "Sun"]
)

ui.page_opts(title="Overlay and layout", fillable=True)

with ui.layout_columns():
    with ui.card(full_screen=True):
        ui.card_header("Overlay (*): scatter + a reference line, shared axes")

        @render_holoviews
        def overlay():
            points = tips.hvplot.scatter(
                "total_bill", "tip", responsive=True, color="gray", alpha=0.5
            )
            rule = hv.Slope(0.15, 0).opts(color="firebrick", line_width=2)
            return (points * rule).opts(title="15% tip reference line")

    with ui.card(full_screen=True):
        ui.card_header("Layout (+): two independent plots, one call")

        @render_holoviews
        def layout():
            bars = by_day.hvplot.bar(
                responsive=True, title="Average tip by day", ylabel="tip"
            )
            hist = tips.hvplot.hist(
                "total_bill", responsive=True, title="Bill distribution"
            )
            return (bars + hist).opts(shared_axes=False)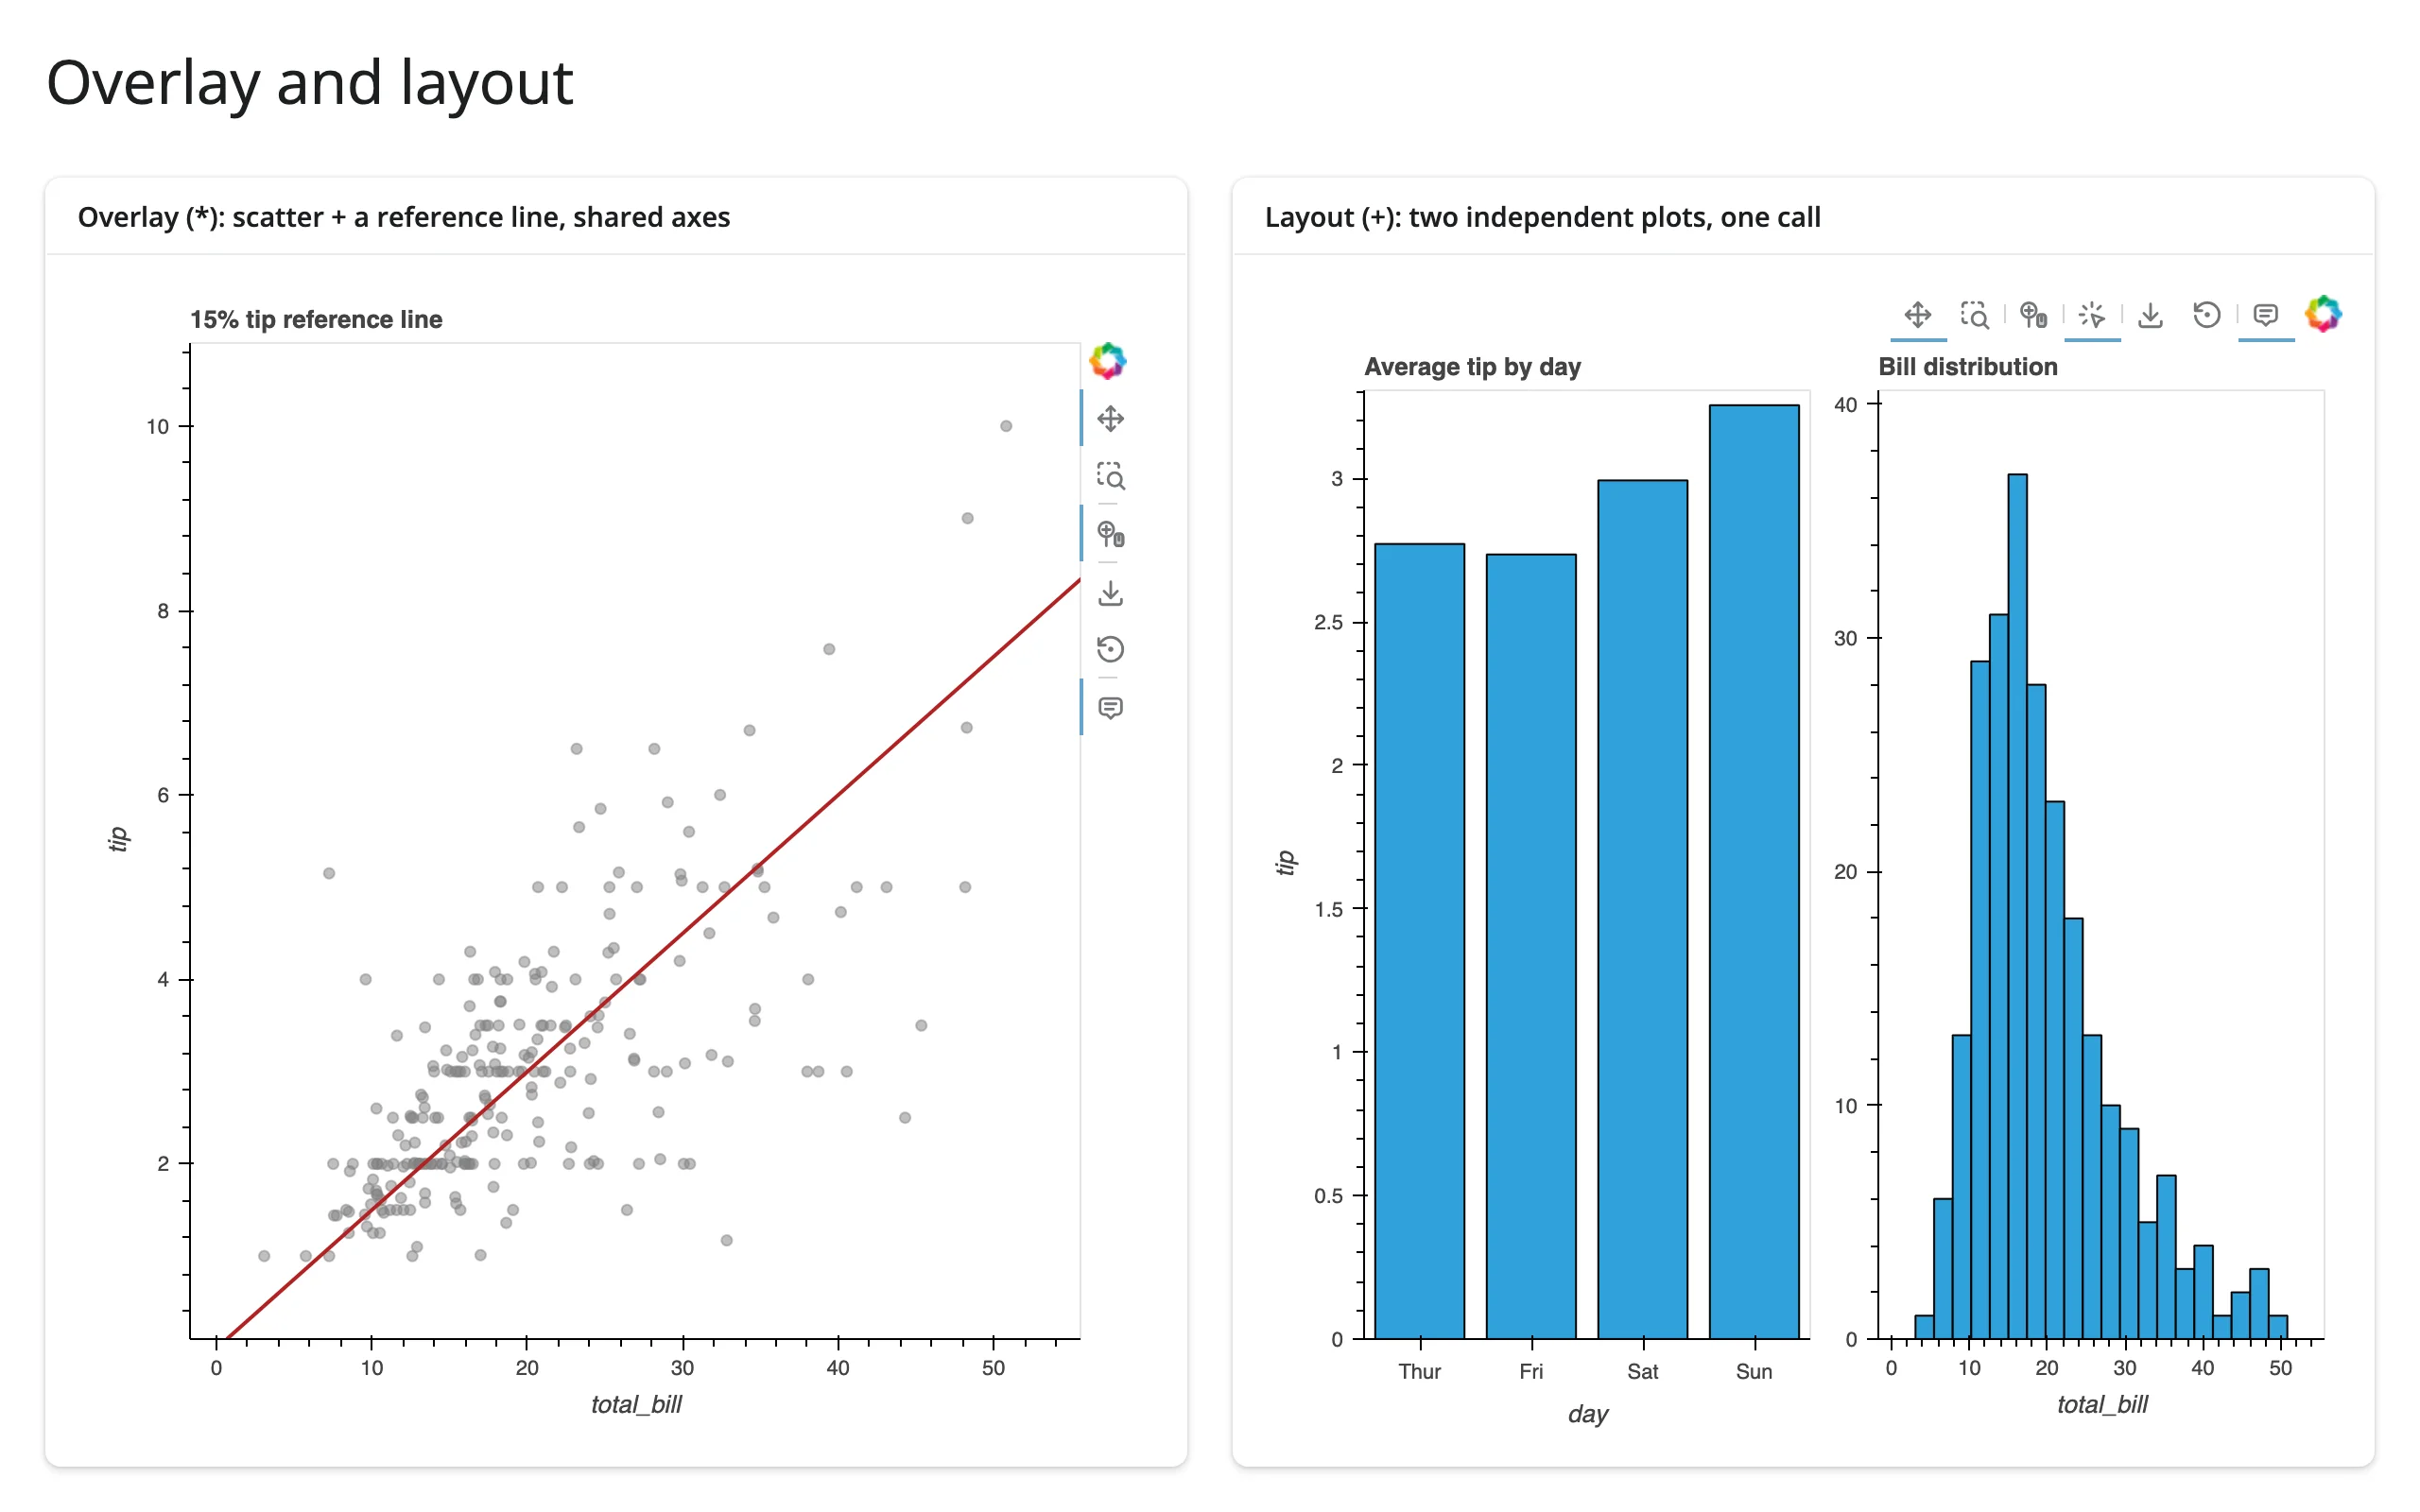
Crossfilter with zero callbacks
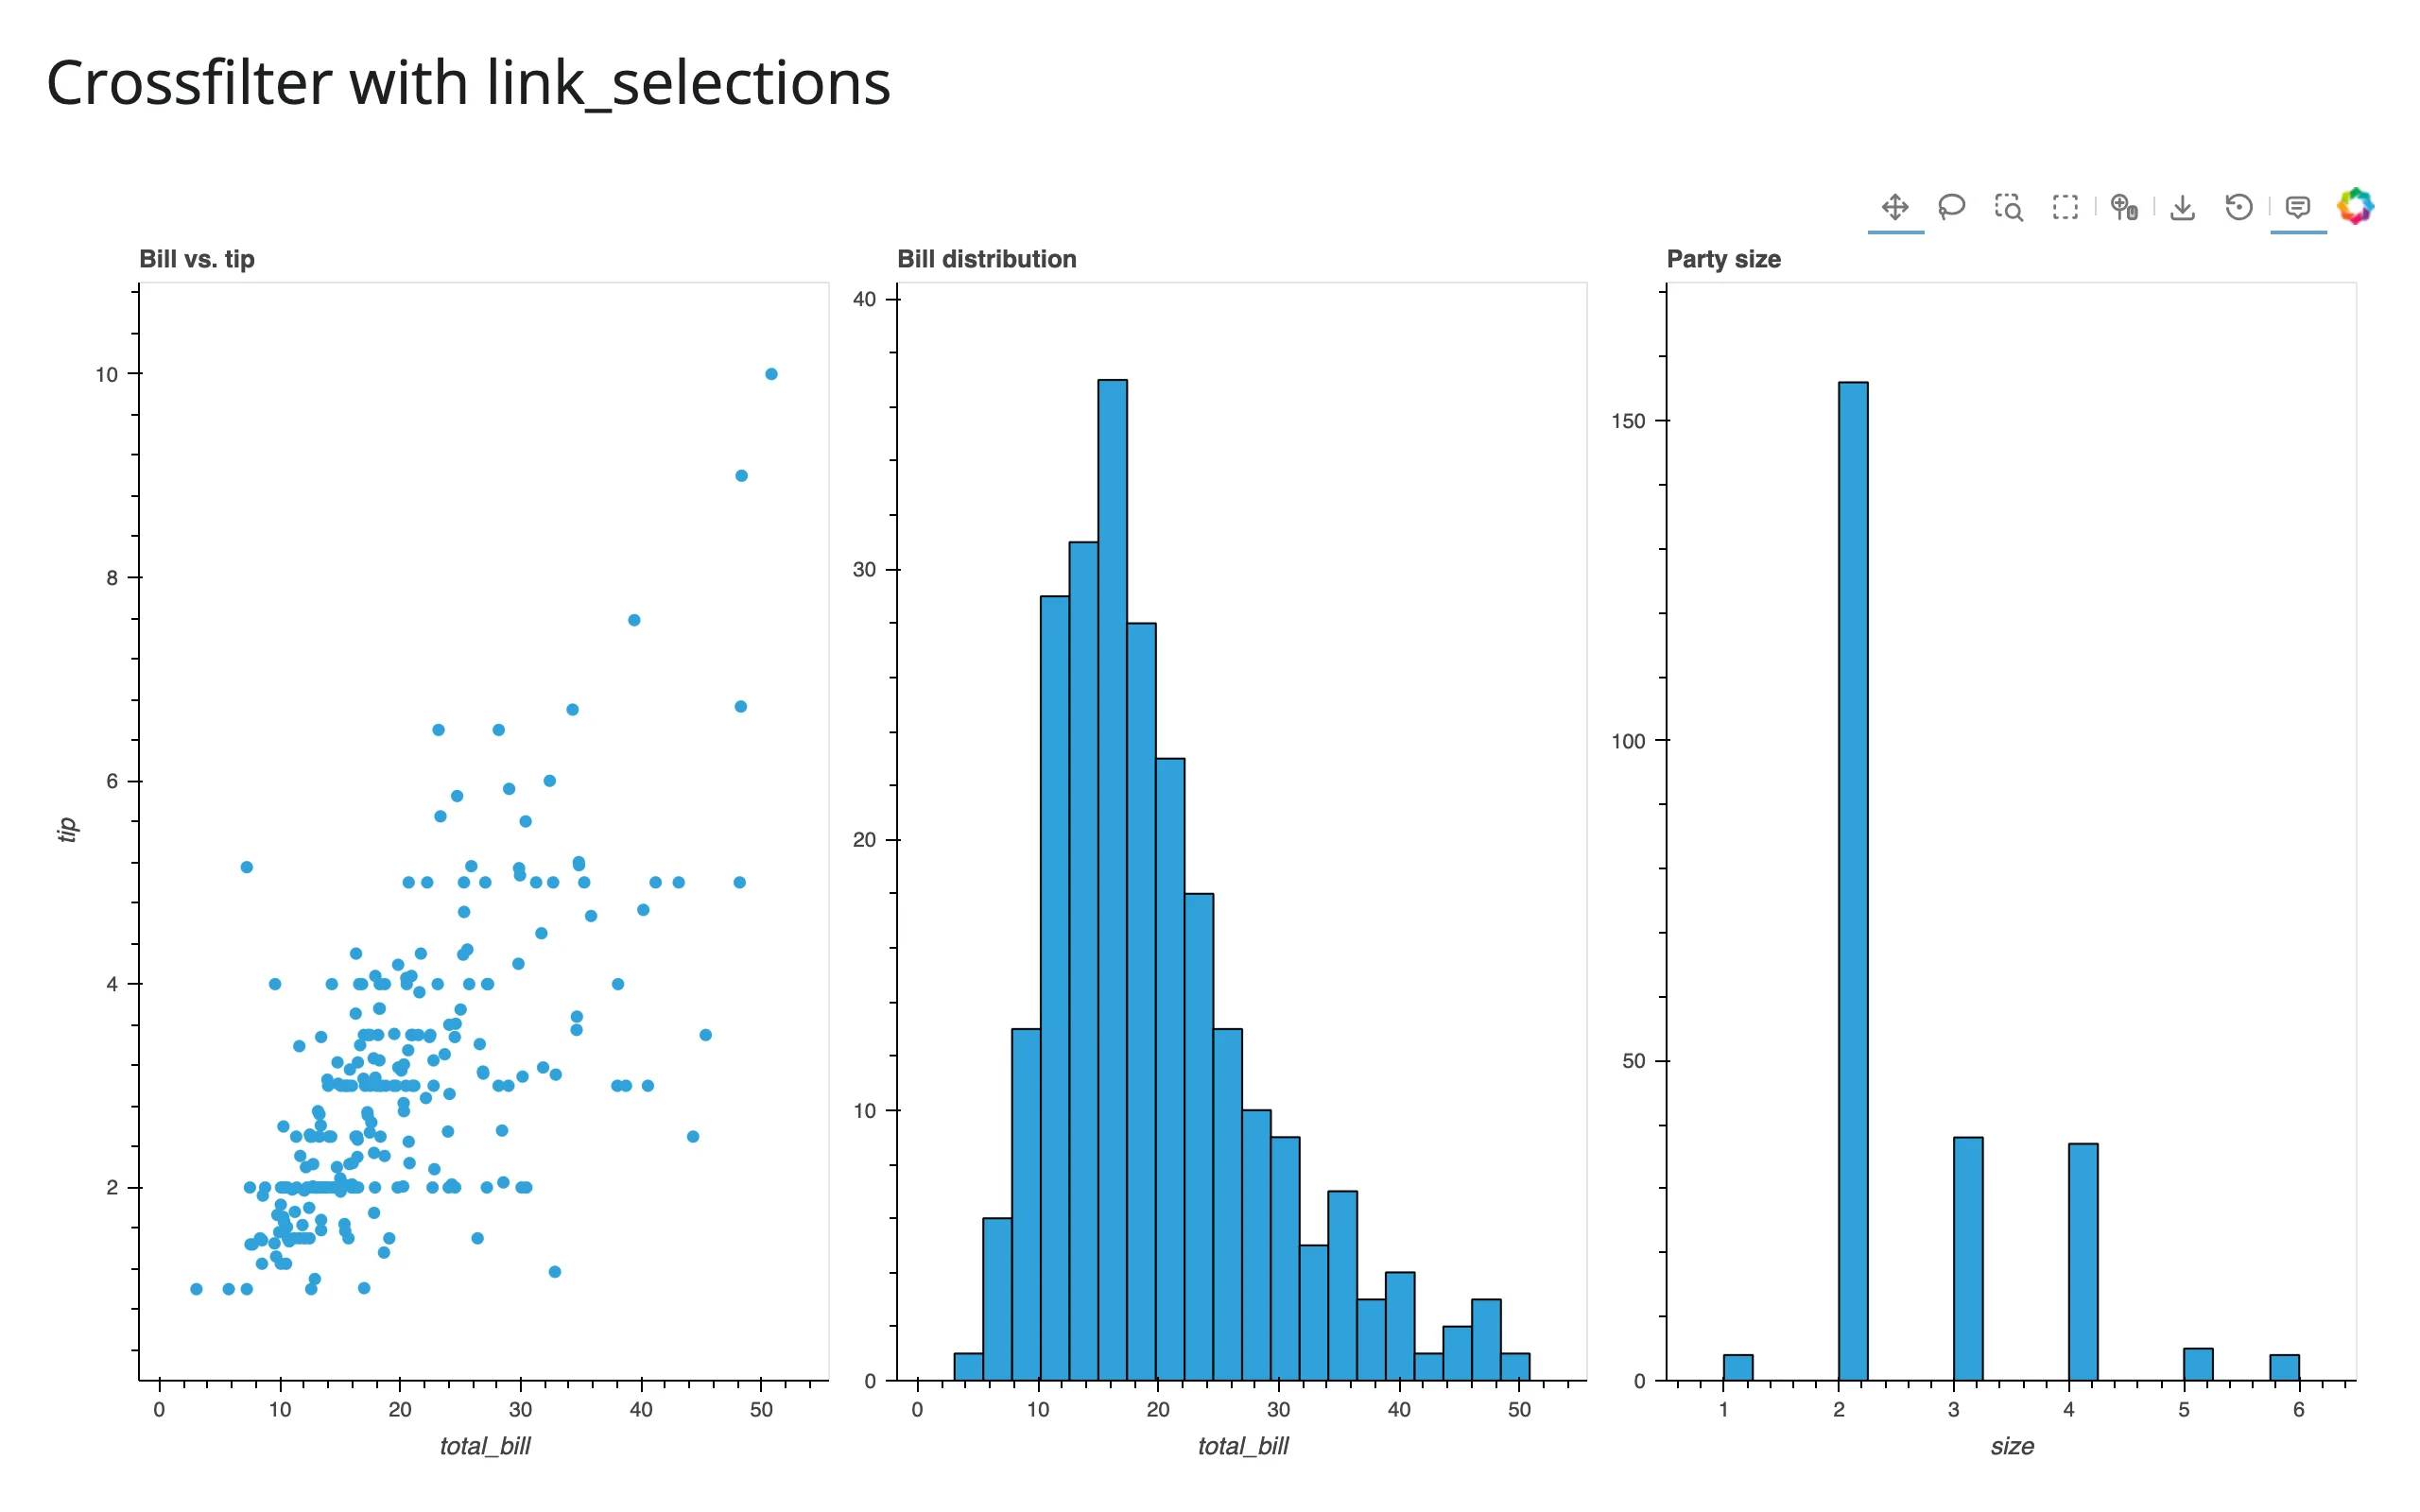
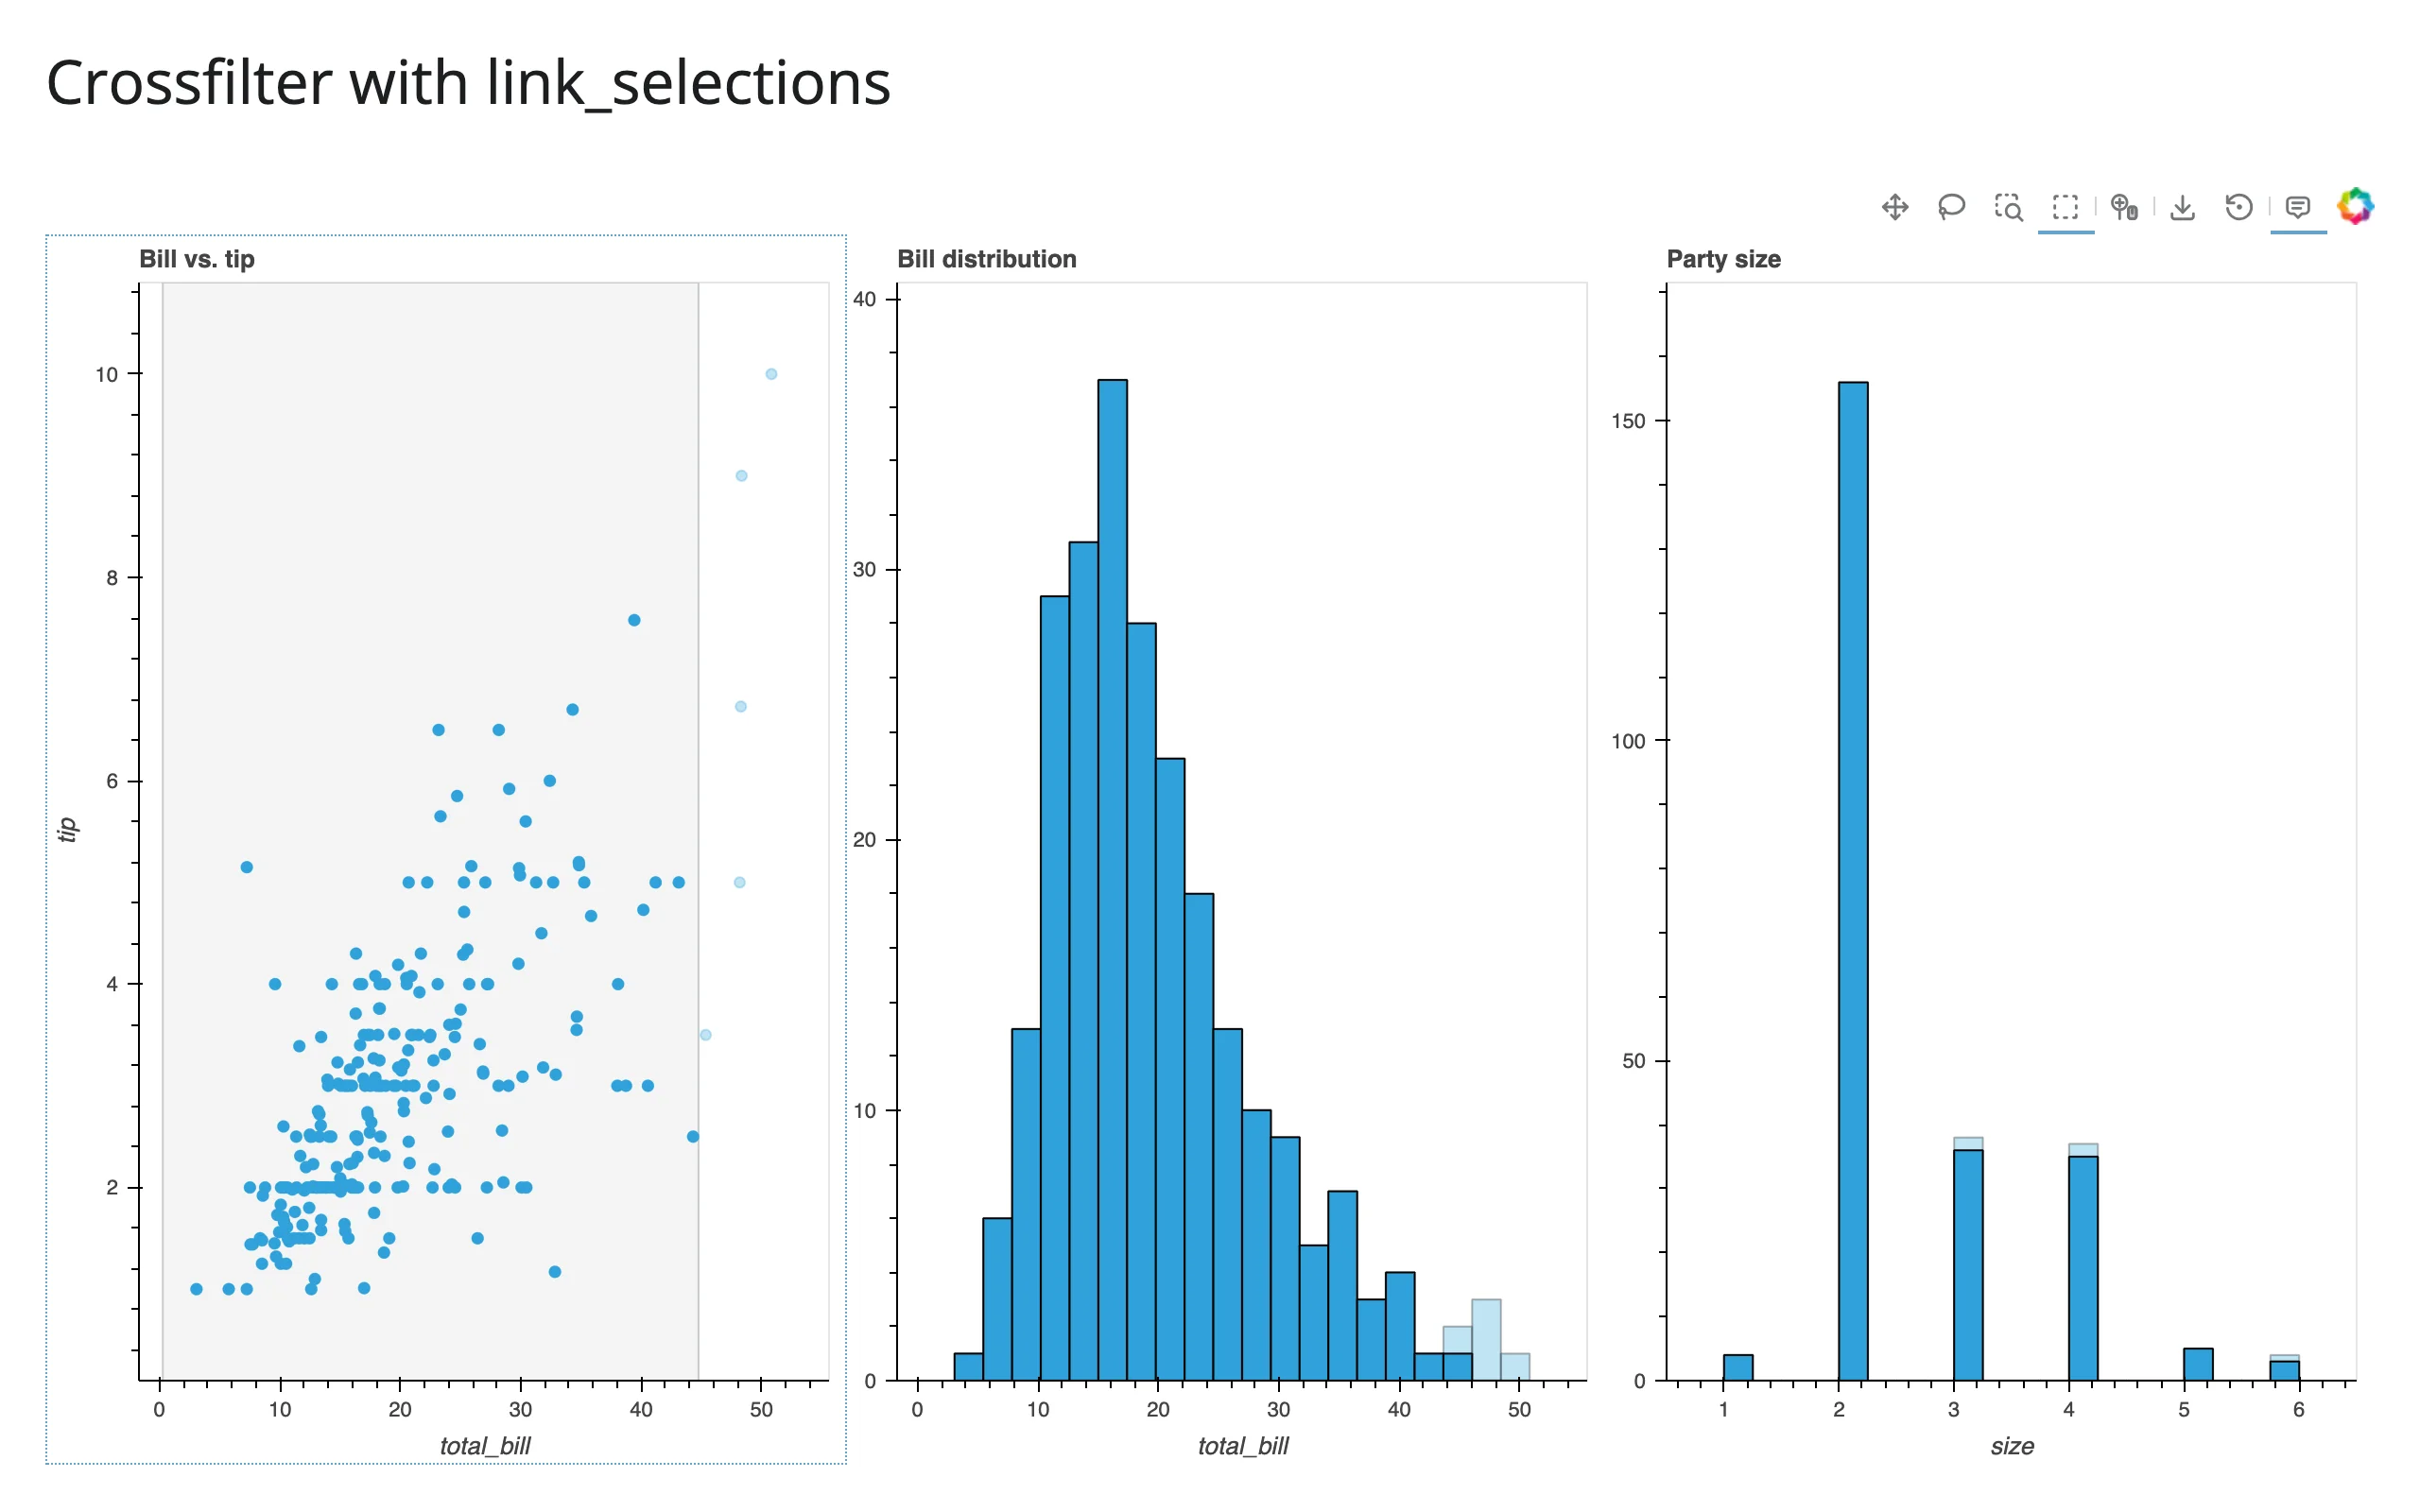
hv.link_selections wraps any combination of plots and crossfilters them: box-select in one, and the others (plus the held-out points in the first) restyle to show what’s inside the selection – no Python callback at all. examples/03_link_selections.py:
# hv.link_selections crossfilters every plot it wraps: box-select in one chart
# and the others (plus any held-out, non-selected points) restyle to match --
# no Python callback written. A composite Layout like this defaults its drag
# tool to Pan, not Box Select, regardless of panel width -- set
# active_tools=["box_select"] on each element so box-select is the
# ready-to-use default instead.
import holoviews as hv
import plotly.express as px
import hvplot.pandas  # noqa: F401
from shiny.express import ui

from shinywidgets import render_holoviews

hv.extension("bokeh")

tips = px.data.tips()

ui.page_opts(title="Crossfilter with link_selections", fillable=True)

# One instance per session (Express re-runs this module per session). A
# module-level instance would show every visitor's selection to everyone else.
links = hv.link_selections.instance(unselected_alpha=0.3)


@render_holoviews
def crossfilter():
    scatter = tips.hvplot.scatter(
        "total_bill", "tip", responsive=True, title="Bill vs. tip"
    ).opts(active_tools=["box_select"])
    bill_hist = tips.hvplot.hist(
        "total_bill", responsive=True, title="Bill distribution"
    ).opts(active_tools=["box_select"])
    size_hist = tips.hvplot.hist("size", responsive=True, title="Party size").opts(
        active_tools=["box_select"]
    )
    # Drag directly on any plot below to crossfilter the others -- box-select
    # is already the active drag tool on every panel, no toolbar click needed.
    return links(scatter + bill_hist + size_hist).opts(shared_axes=False)
Drag directly on any plot below – active_tools=["box_select"] on each element already makes box-select the default drag tool, so there’s no toolbar icon to click first:
Driving a plot from a Shiny input
The simplest way to connect a Shiny input to a HoloViews plot: read the input inside the render function. examples/04_gapminder_slider.py recreates the classic Gapminder animation as a slider:
# The simplest way to drive a plot from a Shiny input: read the input inside
# the render function. Shiny re-runs the function whenever the slider changes,
# and shinywidgets builds a brand-new plot each time (see 07_update_in_place.py
# for a HoloViews DynamicMap that updates the existing plot in place instead).
import plotly.express as px
import hvplot.pandas  # noqa: F401
from shiny.express import input, render, ui

from shinywidgets import render_holoviews

gapminder = px.data.gapminder()

ui.page_opts(title="Life expectancy vs. GDP per capita", fillable=True)
ui.input_slider("year", "Year", min=1952, max=2007, value=1952, step=5, sep="")


@render_holoviews
def scatter():
    year_df = gapminder[gapminder.year == input.year()]
    return year_df.hvplot.scatter(
        "gdpPercap",
        "lifeExp",
        by="continent",
        logx=True,
        responsive=True,
        size=80,
        alpha=0.7,
        xlim=(200, 120_000),
        ylim=(20, 90),
        title=f"{input.year()}",
    )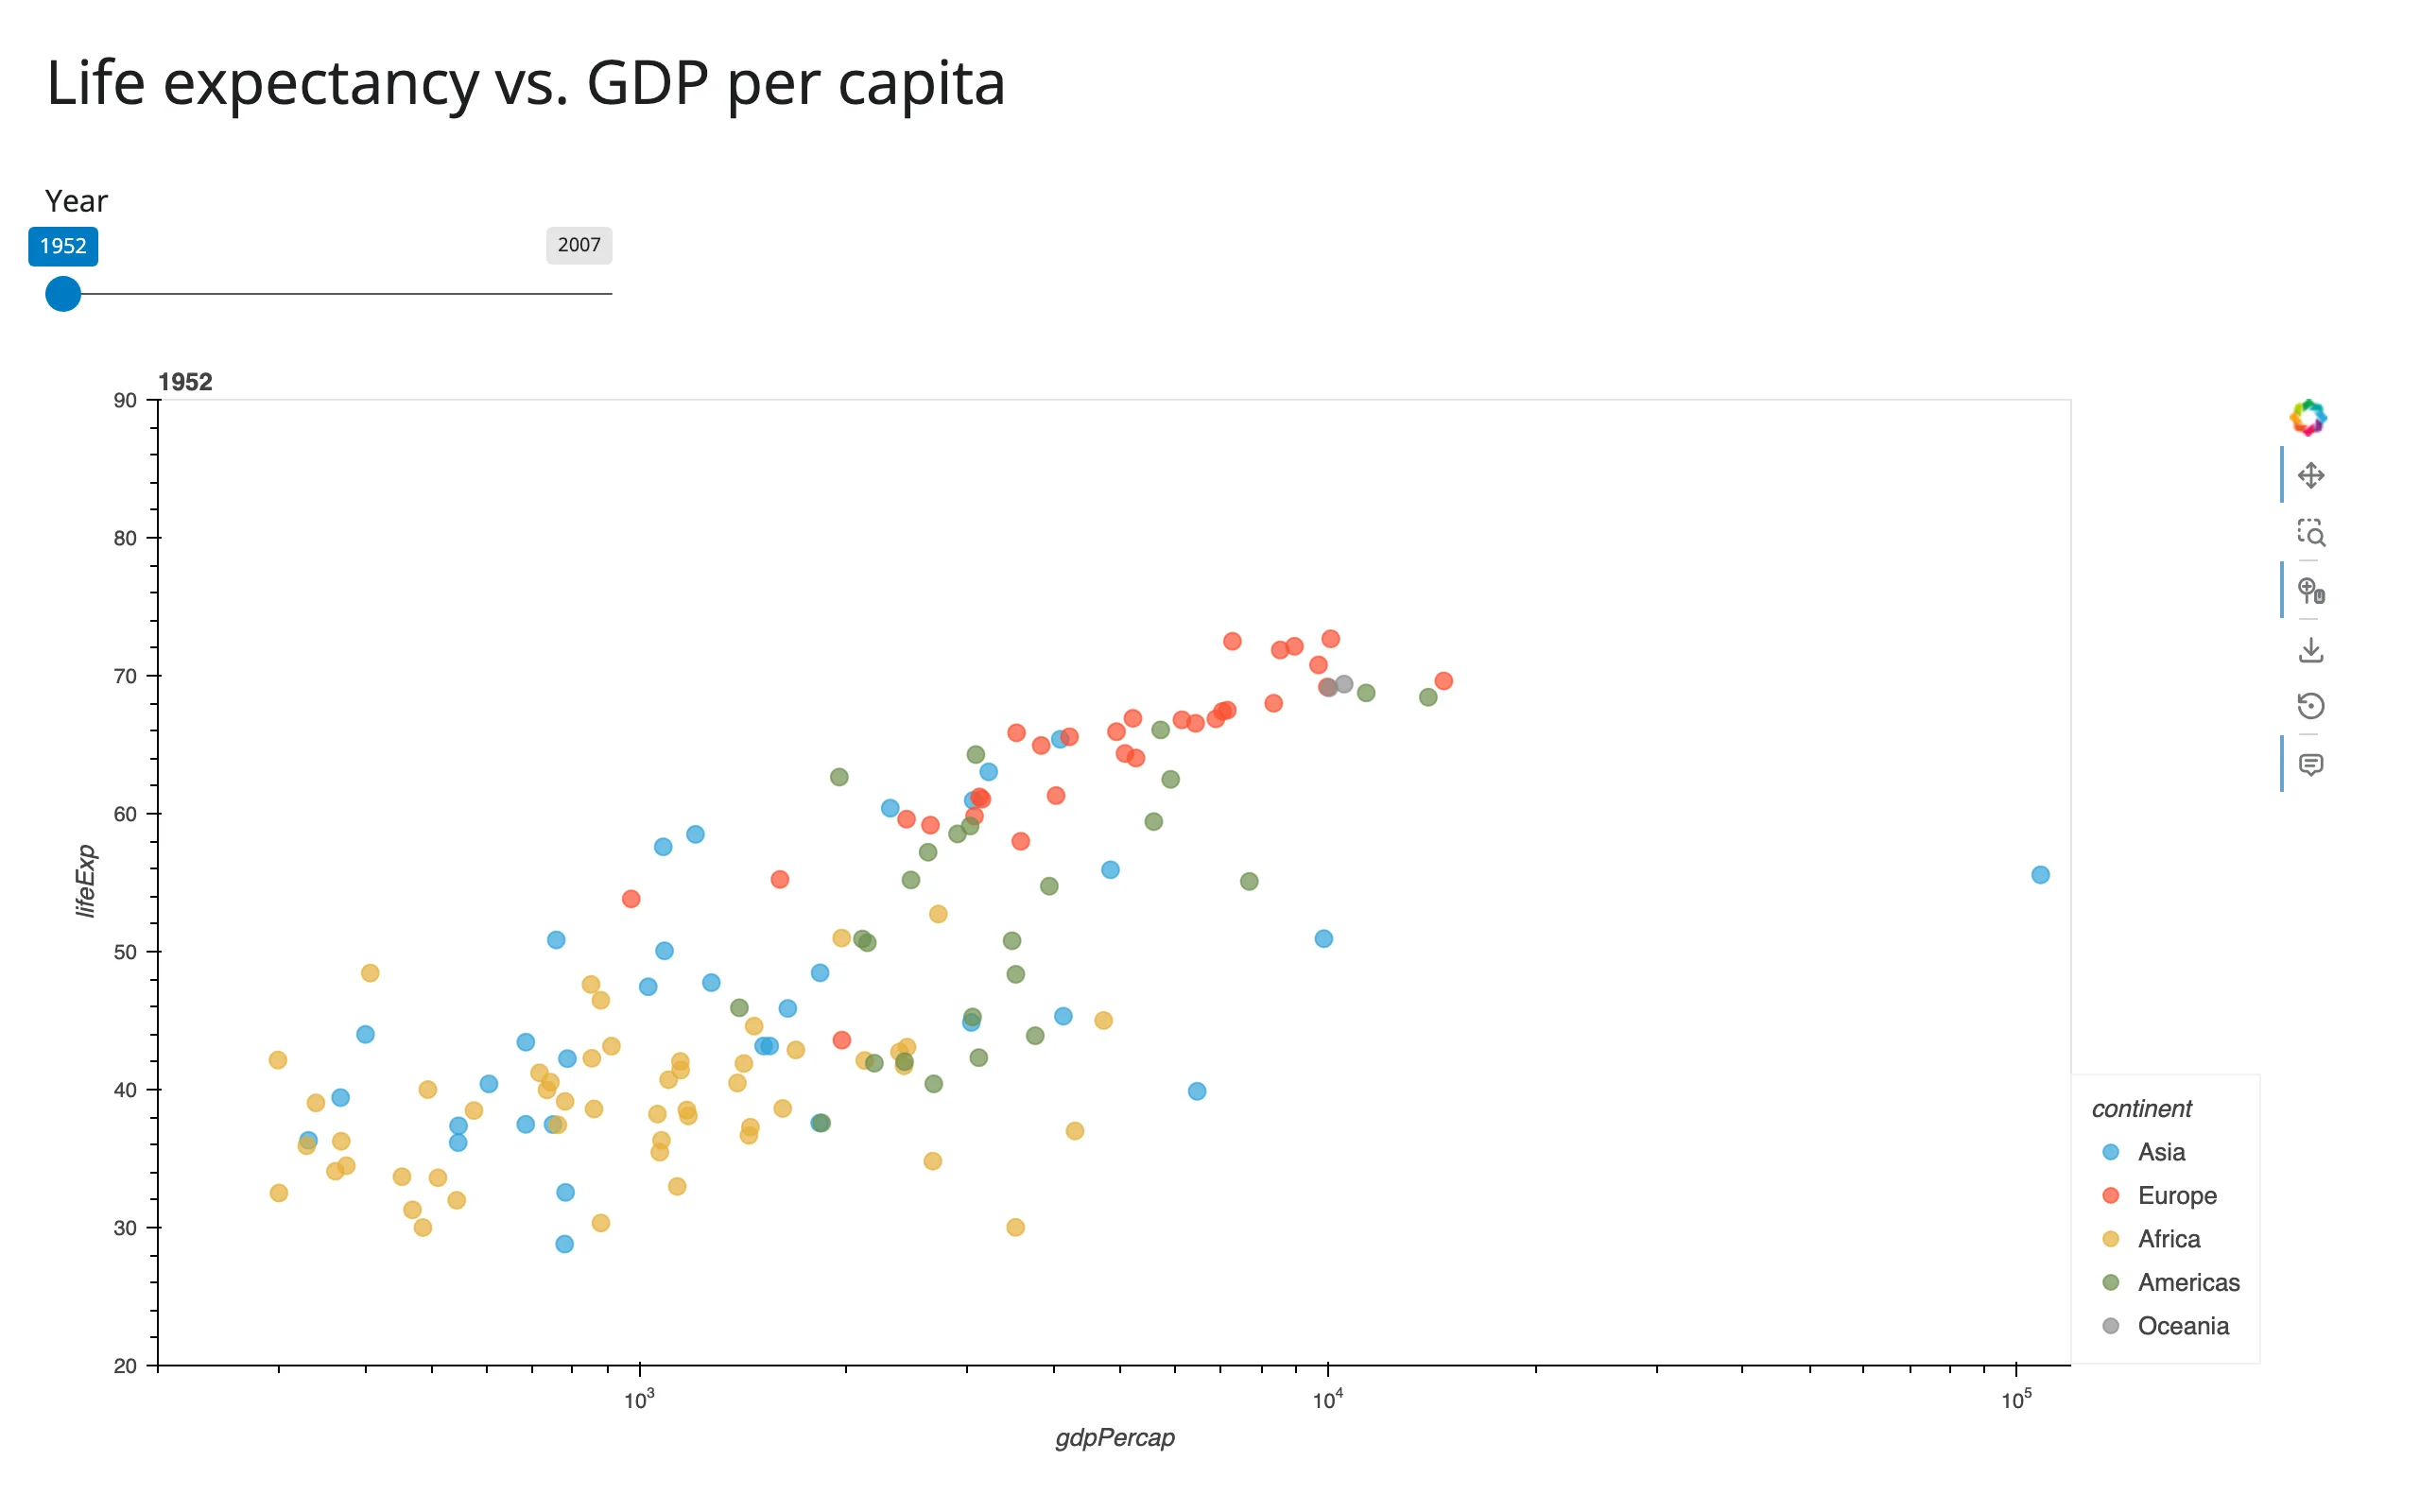
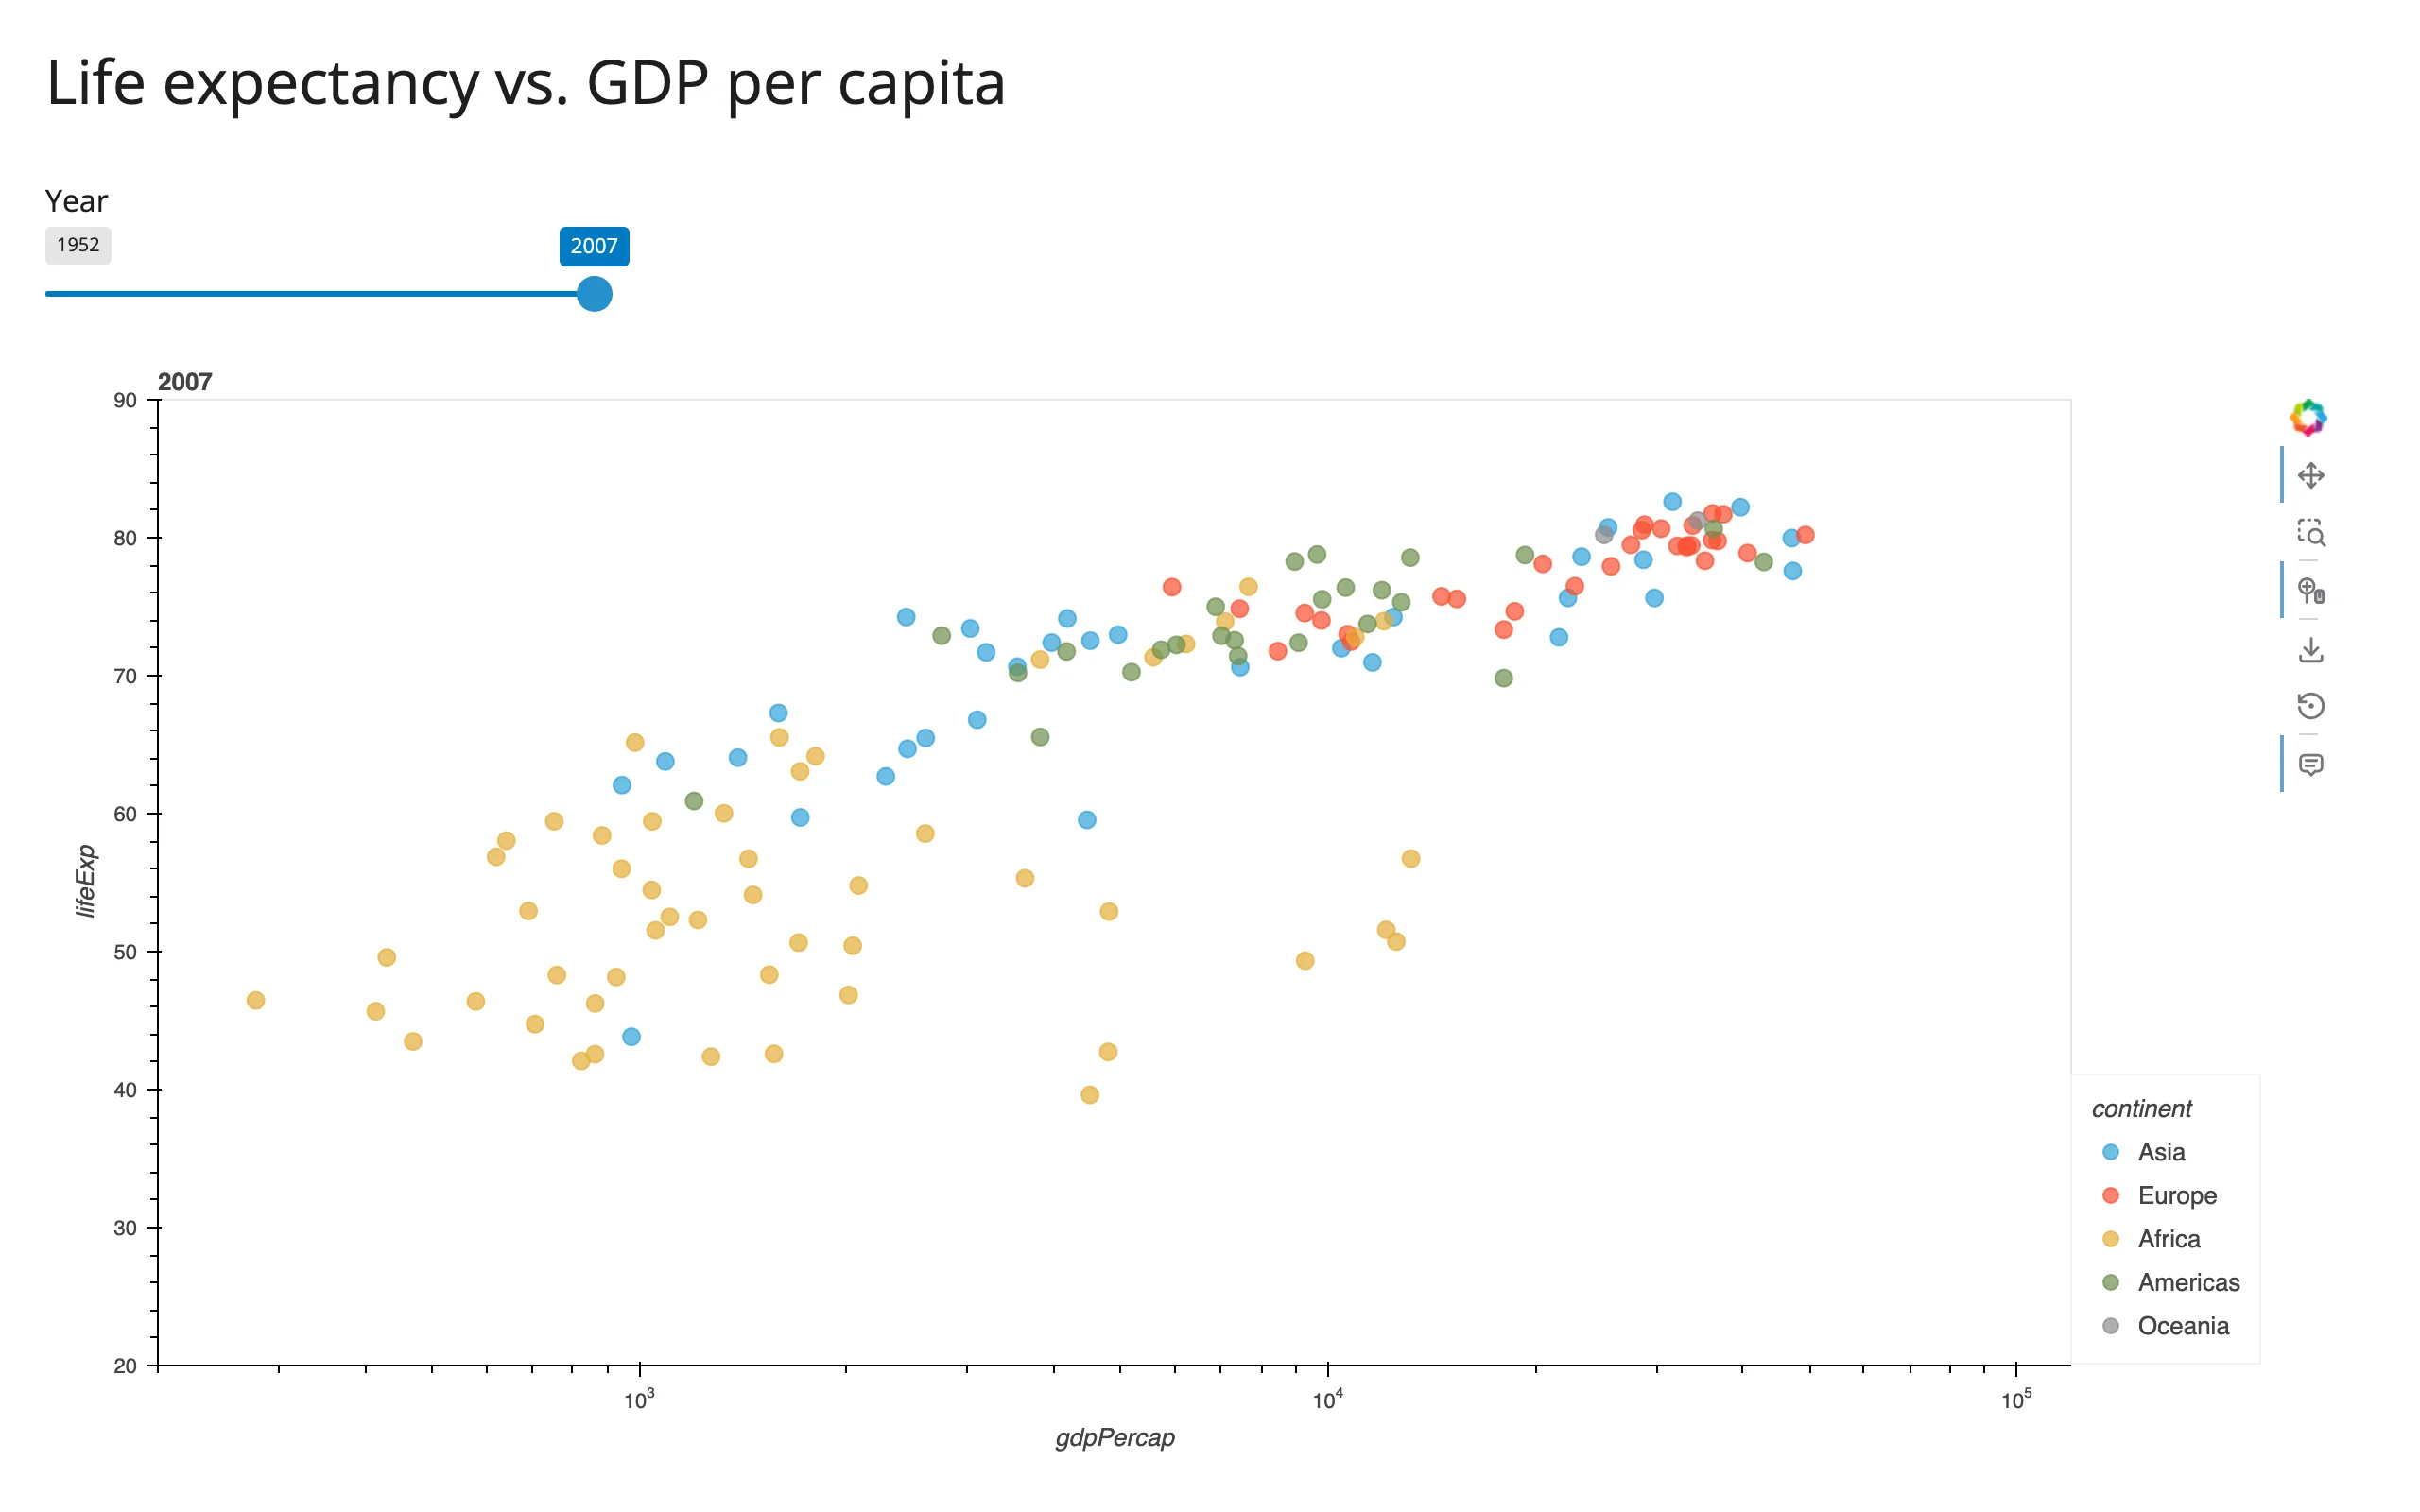
Shiny re-runs scatter() on every slider move, and shinywidgets builds a brand-new plot each time – simple, and fine for most apps. See Updating the widget from Python for the alternative (a DynamicMap driven by a stream) that updates the existing plot instead of replacing it, which matters when you want to preserve zoom/pan state across updates.
Filling the container
Pass responsive=True to make a plot fill its card instead of rendering at HoloViews’ fixed default size; see Layout and sizing.
Datashader and GeoViews
Plots rasterized with Datashader (hvPlot’s rasterize=True, or HoloViews’ rasterize() operation) and GeoViews maps both render through this same @render_holoviews decorator. They get their own guides; the short version is that Datashader plots re-aggregate on the server as you zoom and pan (build them inside the render function, not at module level, for the same per-session reason as streams below), and GeoViews needs .opts(..., clone=True) on shared objects like gv.tile_sources.OSM.
Reacting to user interaction
render_holoviews has no reactive accessors – there’s no fig.selected() to call. HoloViews’ interaction model is its own streams (hv.streams.Tap, BoundsXY, Selection1D, RangeXY, …) and hv.link_selections, both of which run their callbacks directly in Python, outside the accessor machinery the other renderers use. The recipe below bridges that into Shiny’s reactive graph, and is the pattern every interactive example in this guide uses.
The recipe: stream subscriber -> reactive.Value
examples/06_boxselect_table.py – box-select on a scatter plot filters a table:
# The recipe for reacting to a HoloViews stream in Shiny: subscribe to it, and
# set a `reactive.Value` from the callback. The stream runs outside Shiny's
# render cycle, but setting a reactive value from it still invalidates
# whatever reads that value, same as any other reactive.Value.
import holoviews as hv
import plotly.express as px
import hvplot.pandas  # noqa: F401
from shiny import reactive
from shiny.express import render, ui

from shinywidgets import render_holoviews

hv.extension("bokeh")

tips = px.data.tips()

ui.page_opts(title="Box-select to filter a table", fillable=True)

bounds_val = reactive.value(None)


@render_holoviews
def scatter():
    points = tips.hvplot.scatter(
        "total_bill", "tip", responsive=True, tools=["box_select"]
    ).opts(active_tools=["box_select"])
    hv.streams.BoundsXY(source=points).add_subscriber(
        lambda bounds: bounds_val.set(bounds)
    )
    return points


@render.data_frame
def selected_rows():
    b = bounds_val()
    if b is None:
        return tips.iloc[:0]  # empty frame until the first selection
    x0, y0, x1, y1 = b
    sel = tips[tips.total_bill.between(x0, x1) & tips.tip.between(y0, y1)]
    return render.DataGrid(sel, height="250px")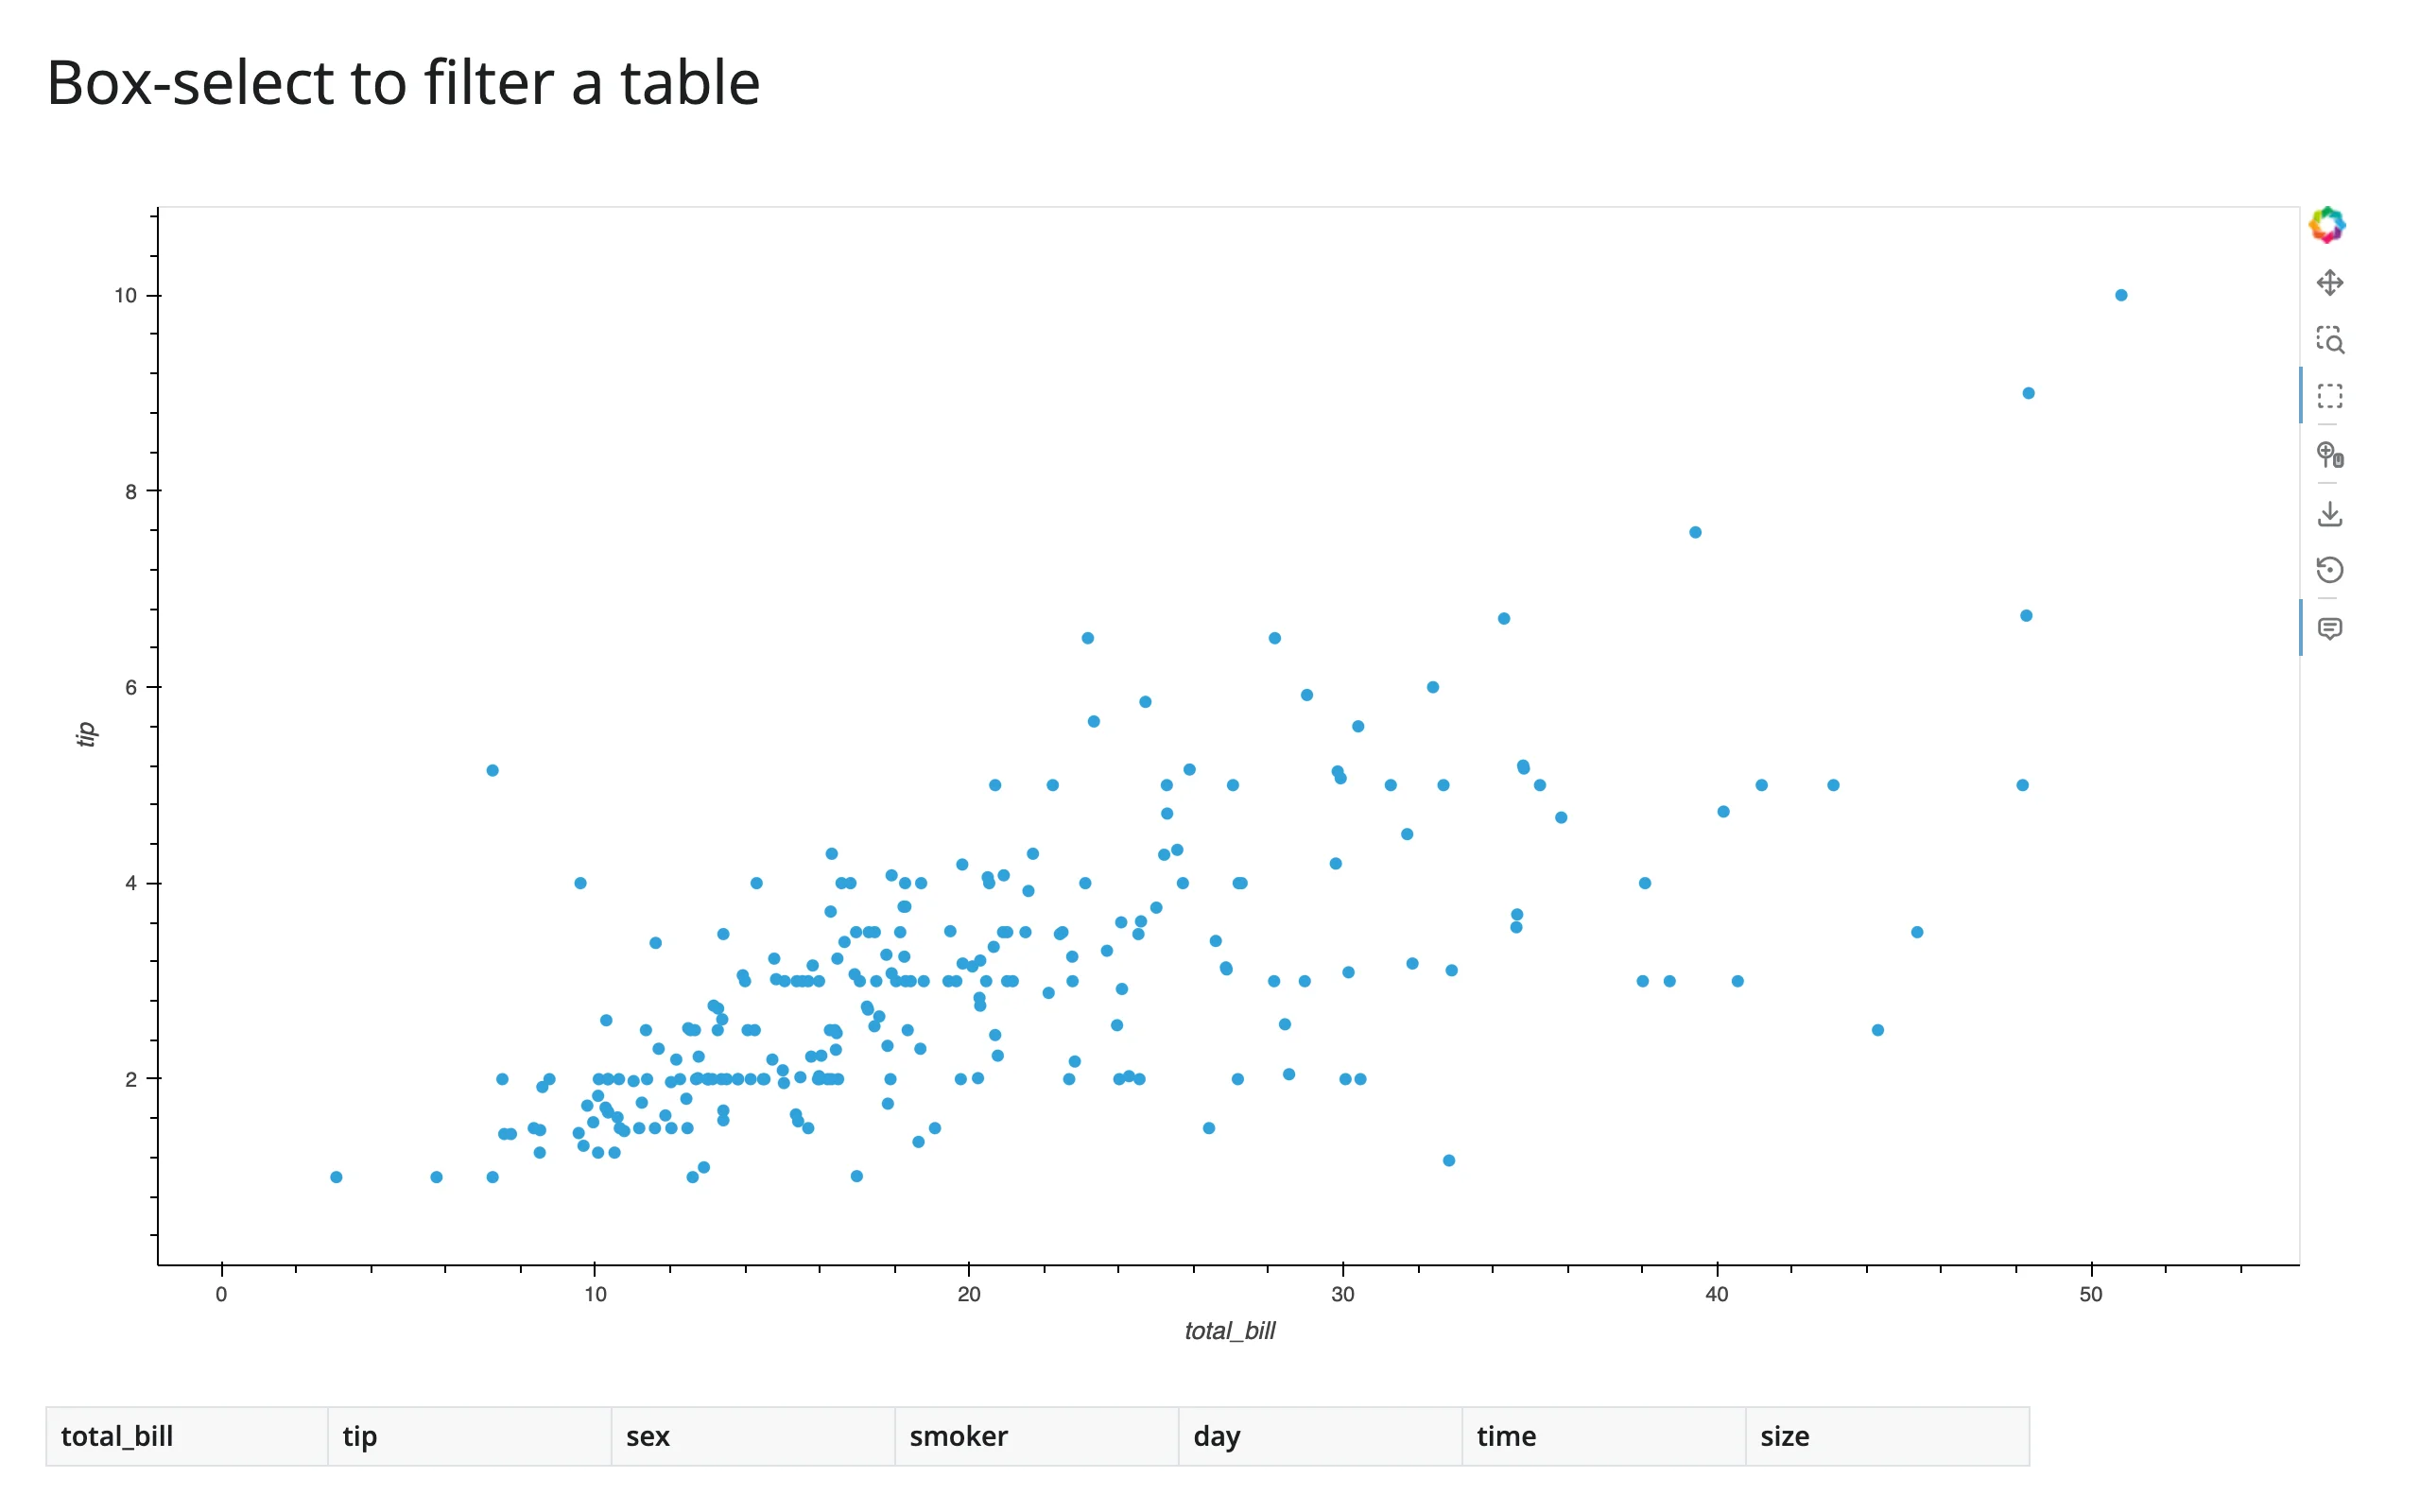
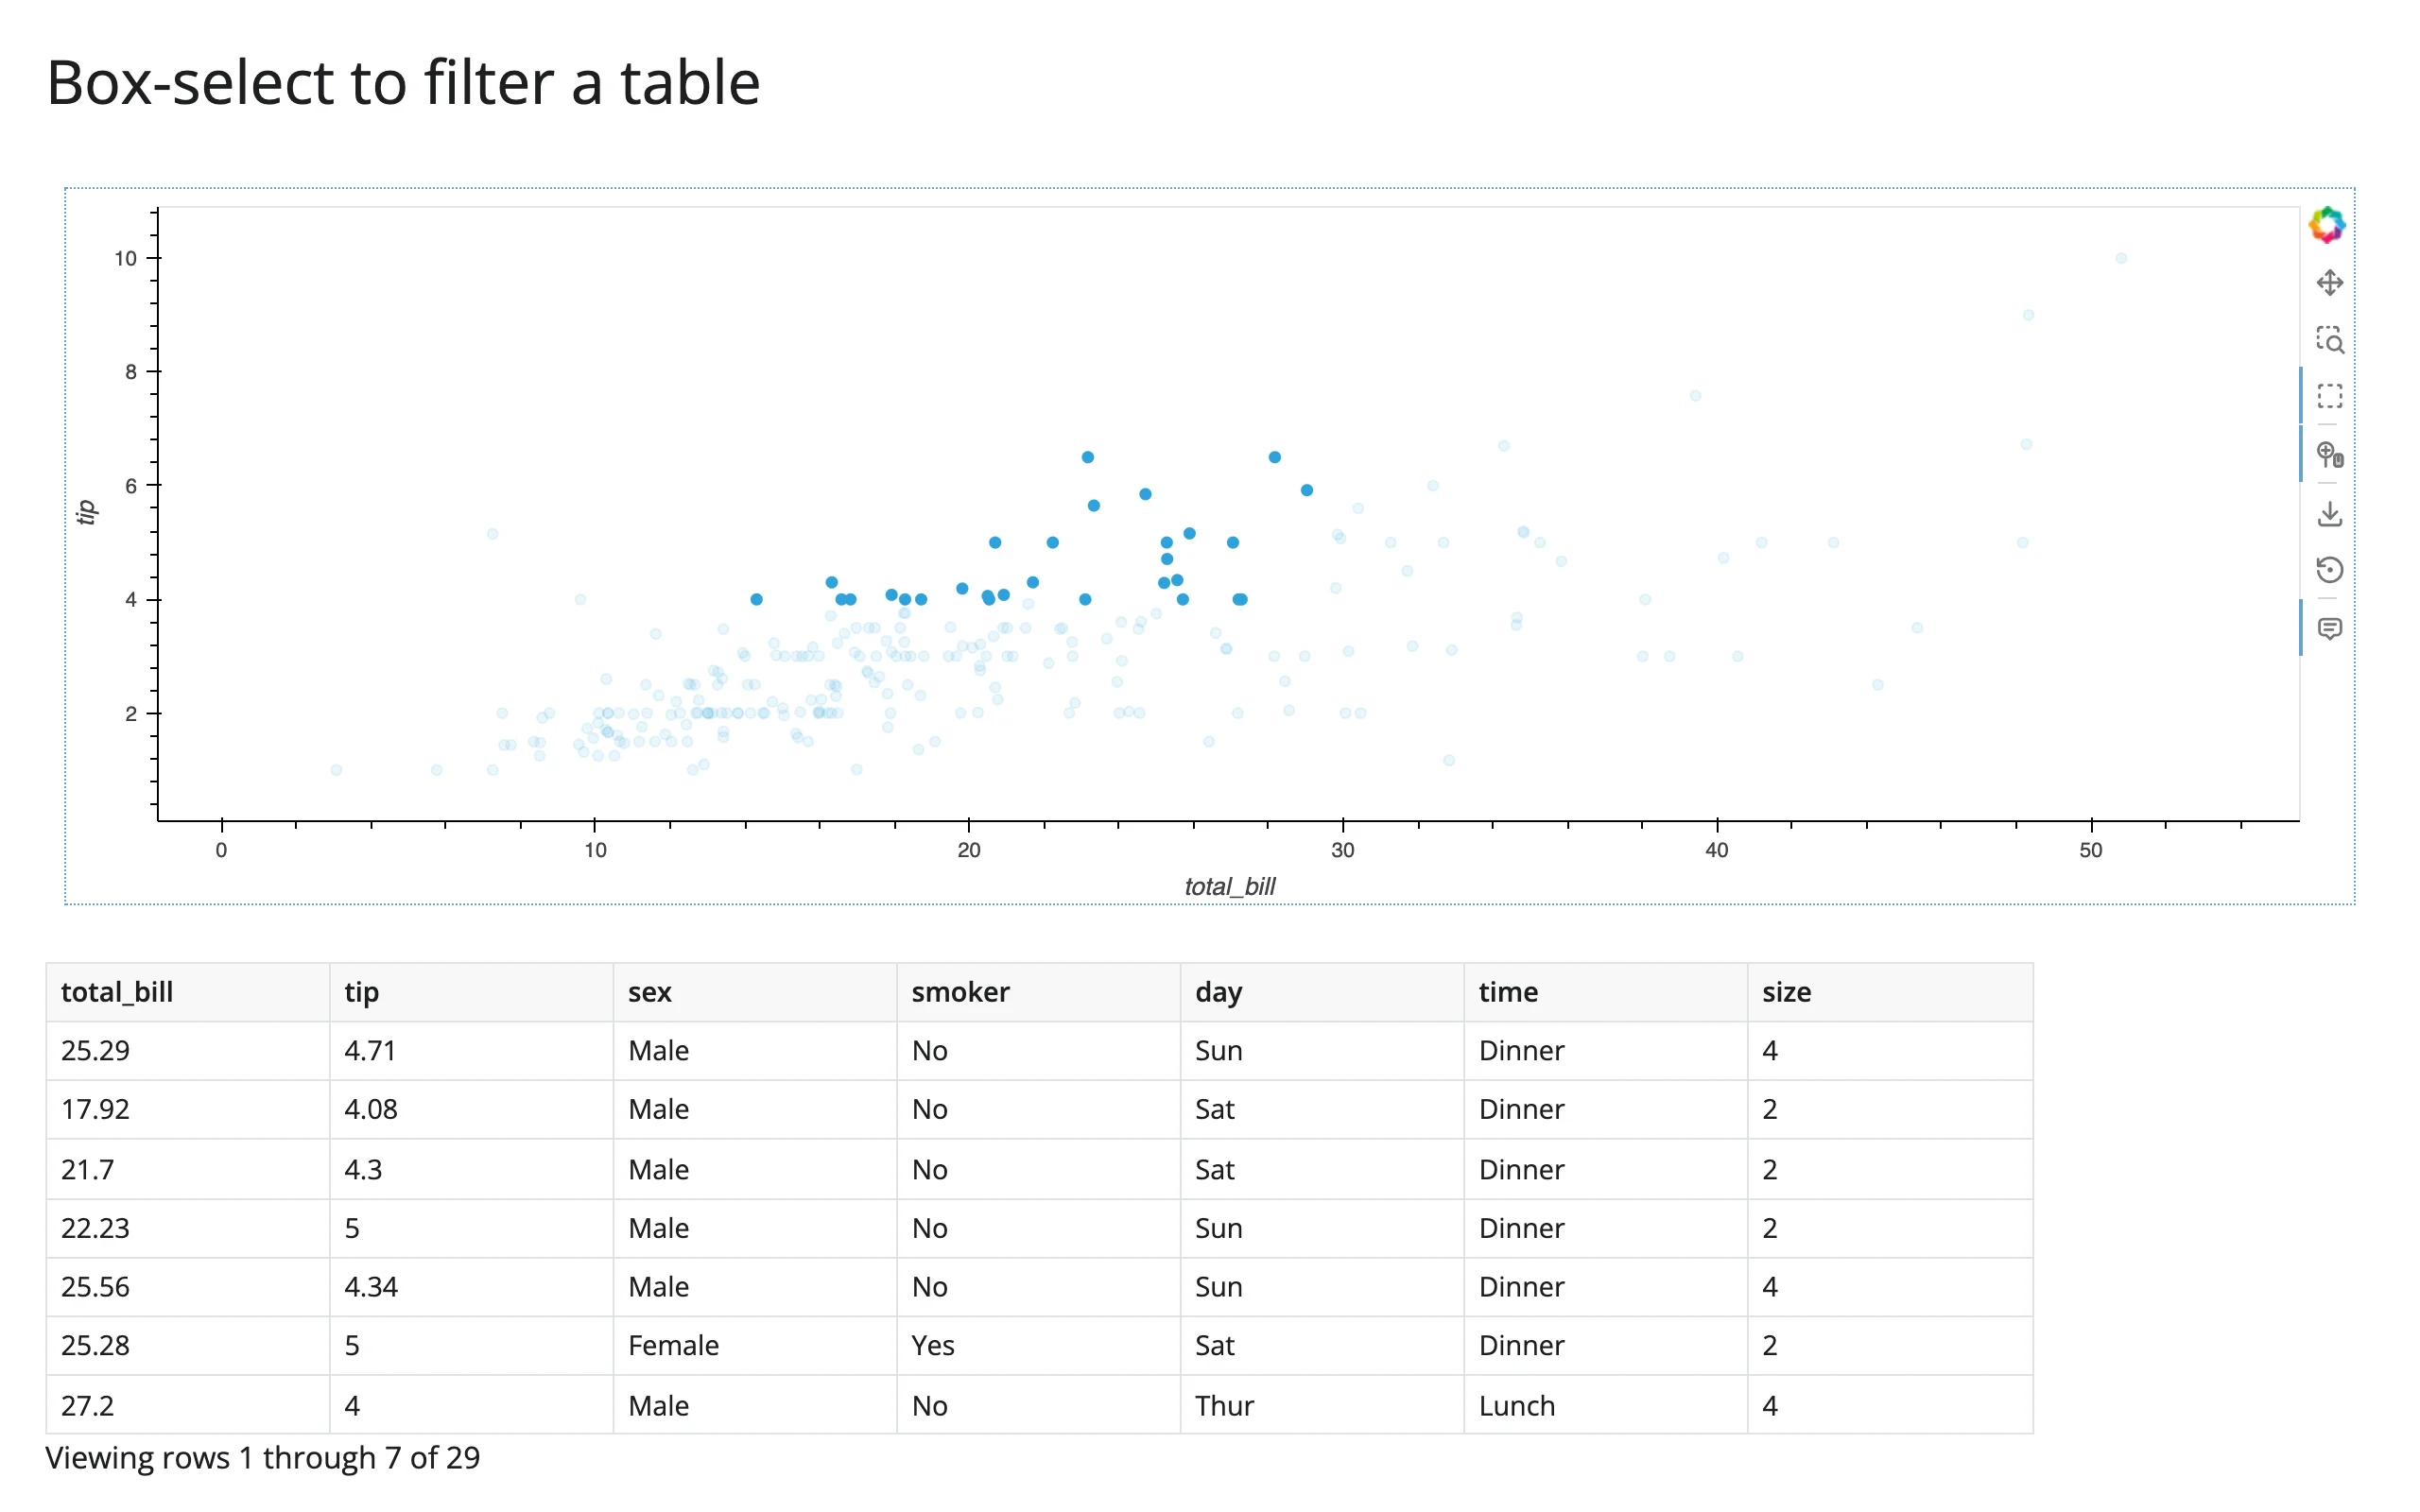
The shape is always the same: build the stream inside the render function (streams only attach to a plot while it’s being built; one created afterwards never fires), subscribe with a lambda that calls .set() on a module-level reactive.Value, and read that value from any reactive function. A few things to know:
- A fresh render starts the plot over, but not your
reactive.Value. Streams are rebuilt every time the render function runs, so the new plot shows no selection – but thereactive.Valueyou set yourself keeps whatever it last held until the user interacts with the new plot. This is the same “kept across re-render until the user interacts with the new widget” behavior accessors have elsewhere in this roster; you’re just managing it yourself here, since streams have no accessor machinery to do it for you. Noneis the normal “nothing yet” state.req(bounds_val())works if you want to wait for the first interaction instead of handlingNoneexplicitly.- It fires once per gesture, not continuously during a drag (verified for
BoundsXYandTap). hv.link_selectionsfollows the same recipe via its own param event:links.param.watch(lambda event: some_value.set(event.new), "selection_expr"). See Coordinating multiple views for a full example.- Per-session construction matters here more than anywhere else in shinywidgets: build streams and
link_selectionsinstances inside the render function (or anywhere in a Shiny Express file, which already runs per session) – never at the top level of a Shiny Core app, where one visitor’s selection would become visible to everyone.
Beyond streams: reactive_read
reactive_read() doesn’t apply here. It works by calling .observe() on an ipywidgets trait, but HoloViews streams and link_selections are plain param.Parameterized objects, not ipywidgets widgets – reactive_read raises if you try. (reactive_read(x.widget, "trait") – or the equivalent x.read("trait"), which every renderer gets – still technically works on the rendered BokehModel itself, the same as render_bokeh, but you don’t normally have a direct handle on its ColumnDataSource the way render_bokeh users do, and render_holoviews has no accessors for .read() to prefer over the trait fallback, so neither spelling is useful here.)
Rate limiting
render_holoviews accepts rate_policy/rate_delay kwargs (inherited from the base renderer class), but they do nothing for the stream recipe above – those kwargs only rate-limit accessors and reactive_read(), and this renderer has neither wired into them. In practice this is rarely a problem: verified gesture-by-gesture, Tap and BoundsXY each fire once per click or drag, not continuously, so there’s nothing to debounce. If you do attach a continuously-firing stream and need to throttle it, gate the subscriber yourself (e.g., check time.monotonic() against a module-level timestamp before calling .set()).
Continuous streams: RangeXY needs an idempotent subscriber
hv.streams.RangeXY reports the plot’s current pan/zoom range, and unlike Tap/BoundsXY it fires on mount with the default range as well as on every zoom or pan. Store the range itself, not a counter or anything else that changes on every call – reactive.Value.set() already skips invalidating readers when the new value equals the old one, so once the range stops changing, the subscriber becomes a no-op. A subscriber that always writes something new (count.set(count.get() + 1), or any other accumulator) is a pointless invalidation storm at best; on older shinywidgets versions (before coercion was reactively isolated) it caused a runaway re-render loop – see Gotchas and limitations for the mechanism. examples/10_zoom_range_summary.py shows the working pattern – the current view’s x-range drives a “how many points are visible right now” summary:
# hv.streams.RangeXY reports the plot's current pan/zoom range -- store the
# range itself (not a counter) in the reactive.Value. RangeXY fires once on
# mount with the default range and again on every zoom/pan, including
# transiently during a drag; storing an ever-changing value like a counter
# caused a runaway re-render loop on older shinywidgets versions (fixed --
# see the guide's gotchas section) and is still wasted invalidation. Storing
# the actual range is idempotent: reactive.Value.set() skips invalidation
# when the new value equals the old one, so repeats of the same range are a
# no-op and only a genuine zoom/pan triggers a recompute.
import holoviews as hv
import plotly.express as px
import hvplot.pandas  # noqa: F401
from shiny import reactive
from shiny.express import render, ui

from shinywidgets import render_holoviews

hv.extension("bokeh")

tips = px.data.tips()

ui.page_opts(title="Zoom range -> visible-point summary", fillable=True)

range_val = reactive.value((None, None))


@render_holoviews
def scatter():
    points = tips.hvplot.scatter("total_bill", "tip", responsive=True)
    hv.streams.RangeXY(source=points).add_subscriber(
        lambda x_range, y_range: range_val.set((x_range, y_range))
    )
    return points


@reactive.calc
def visible():
    x_range, y_range = range_val()
    sub = tips
    if x_range is not None:
        sub = sub[sub.total_bill.between(*x_range)]
    if y_range is not None:
        sub = sub[sub.tip.between(*y_range)]
    return sub


@render.text
def summary():
    x_range, _ = range_val()
    if x_range is None:
        return f"{len(visible())} of {len(tips)} points visible (full range)"
    lo, hi = x_range
    return f"{len(visible())} of {len(tips)} points visible (total_bill {lo:.0f}-{hi:.0f})"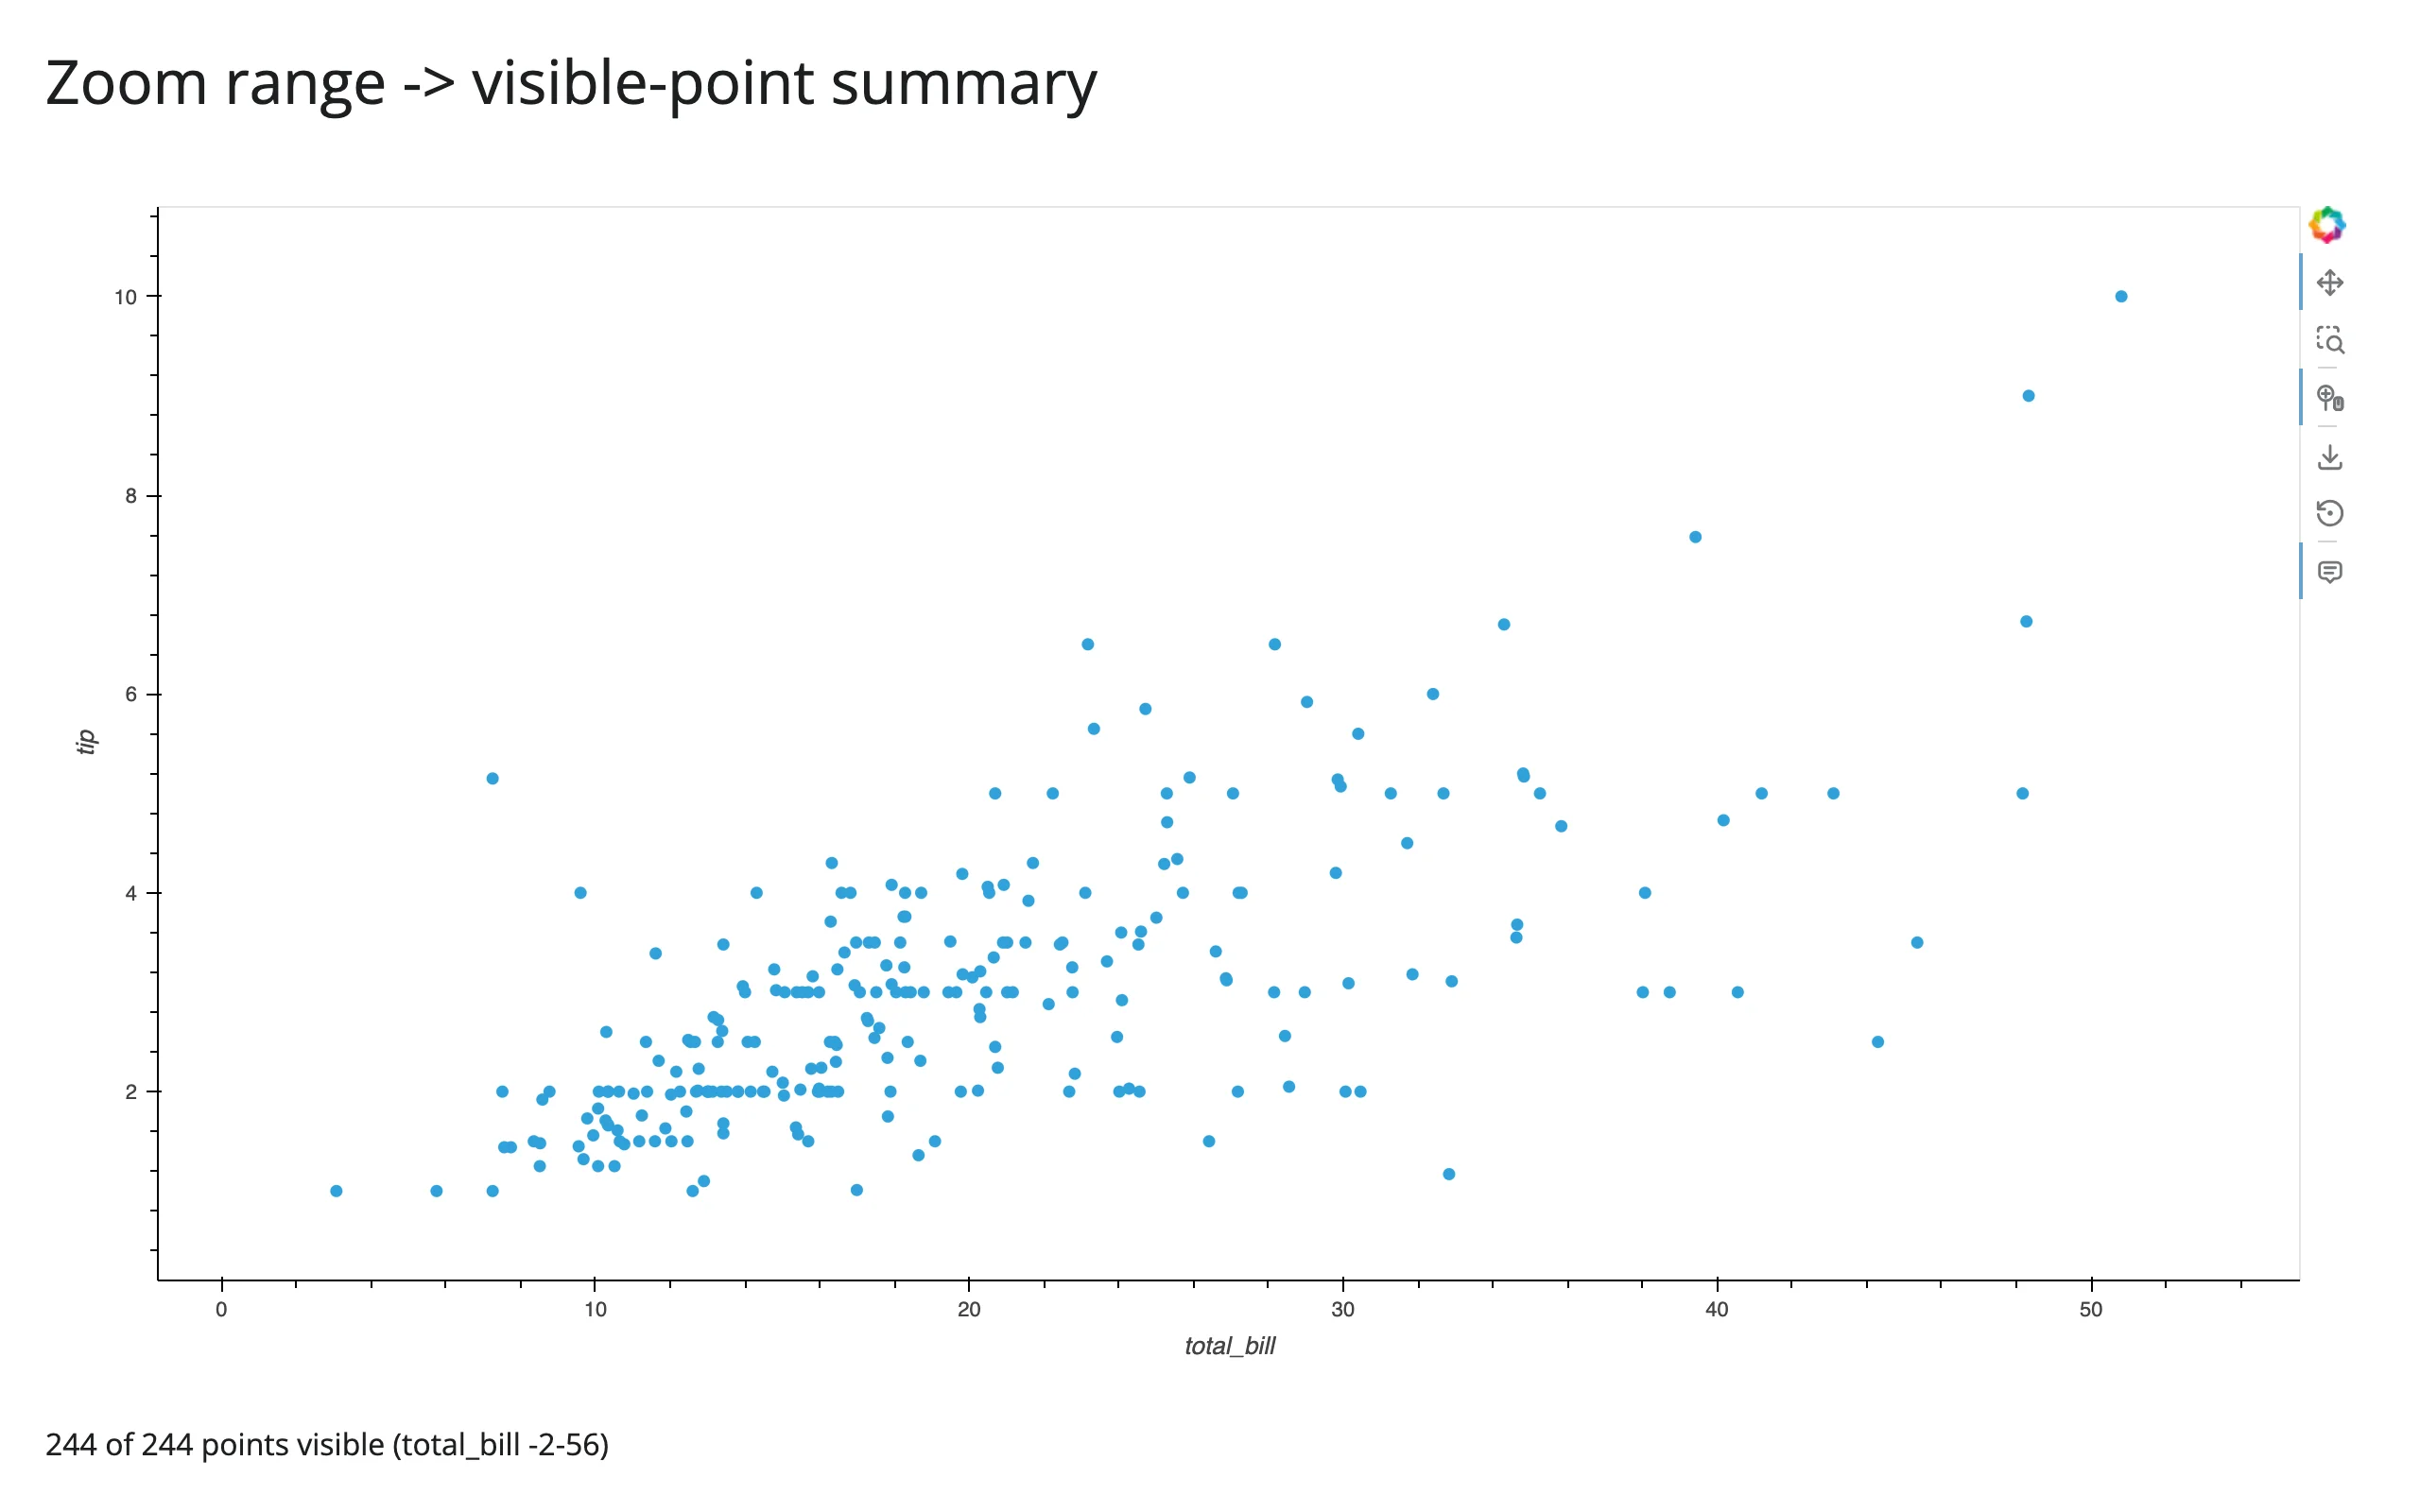
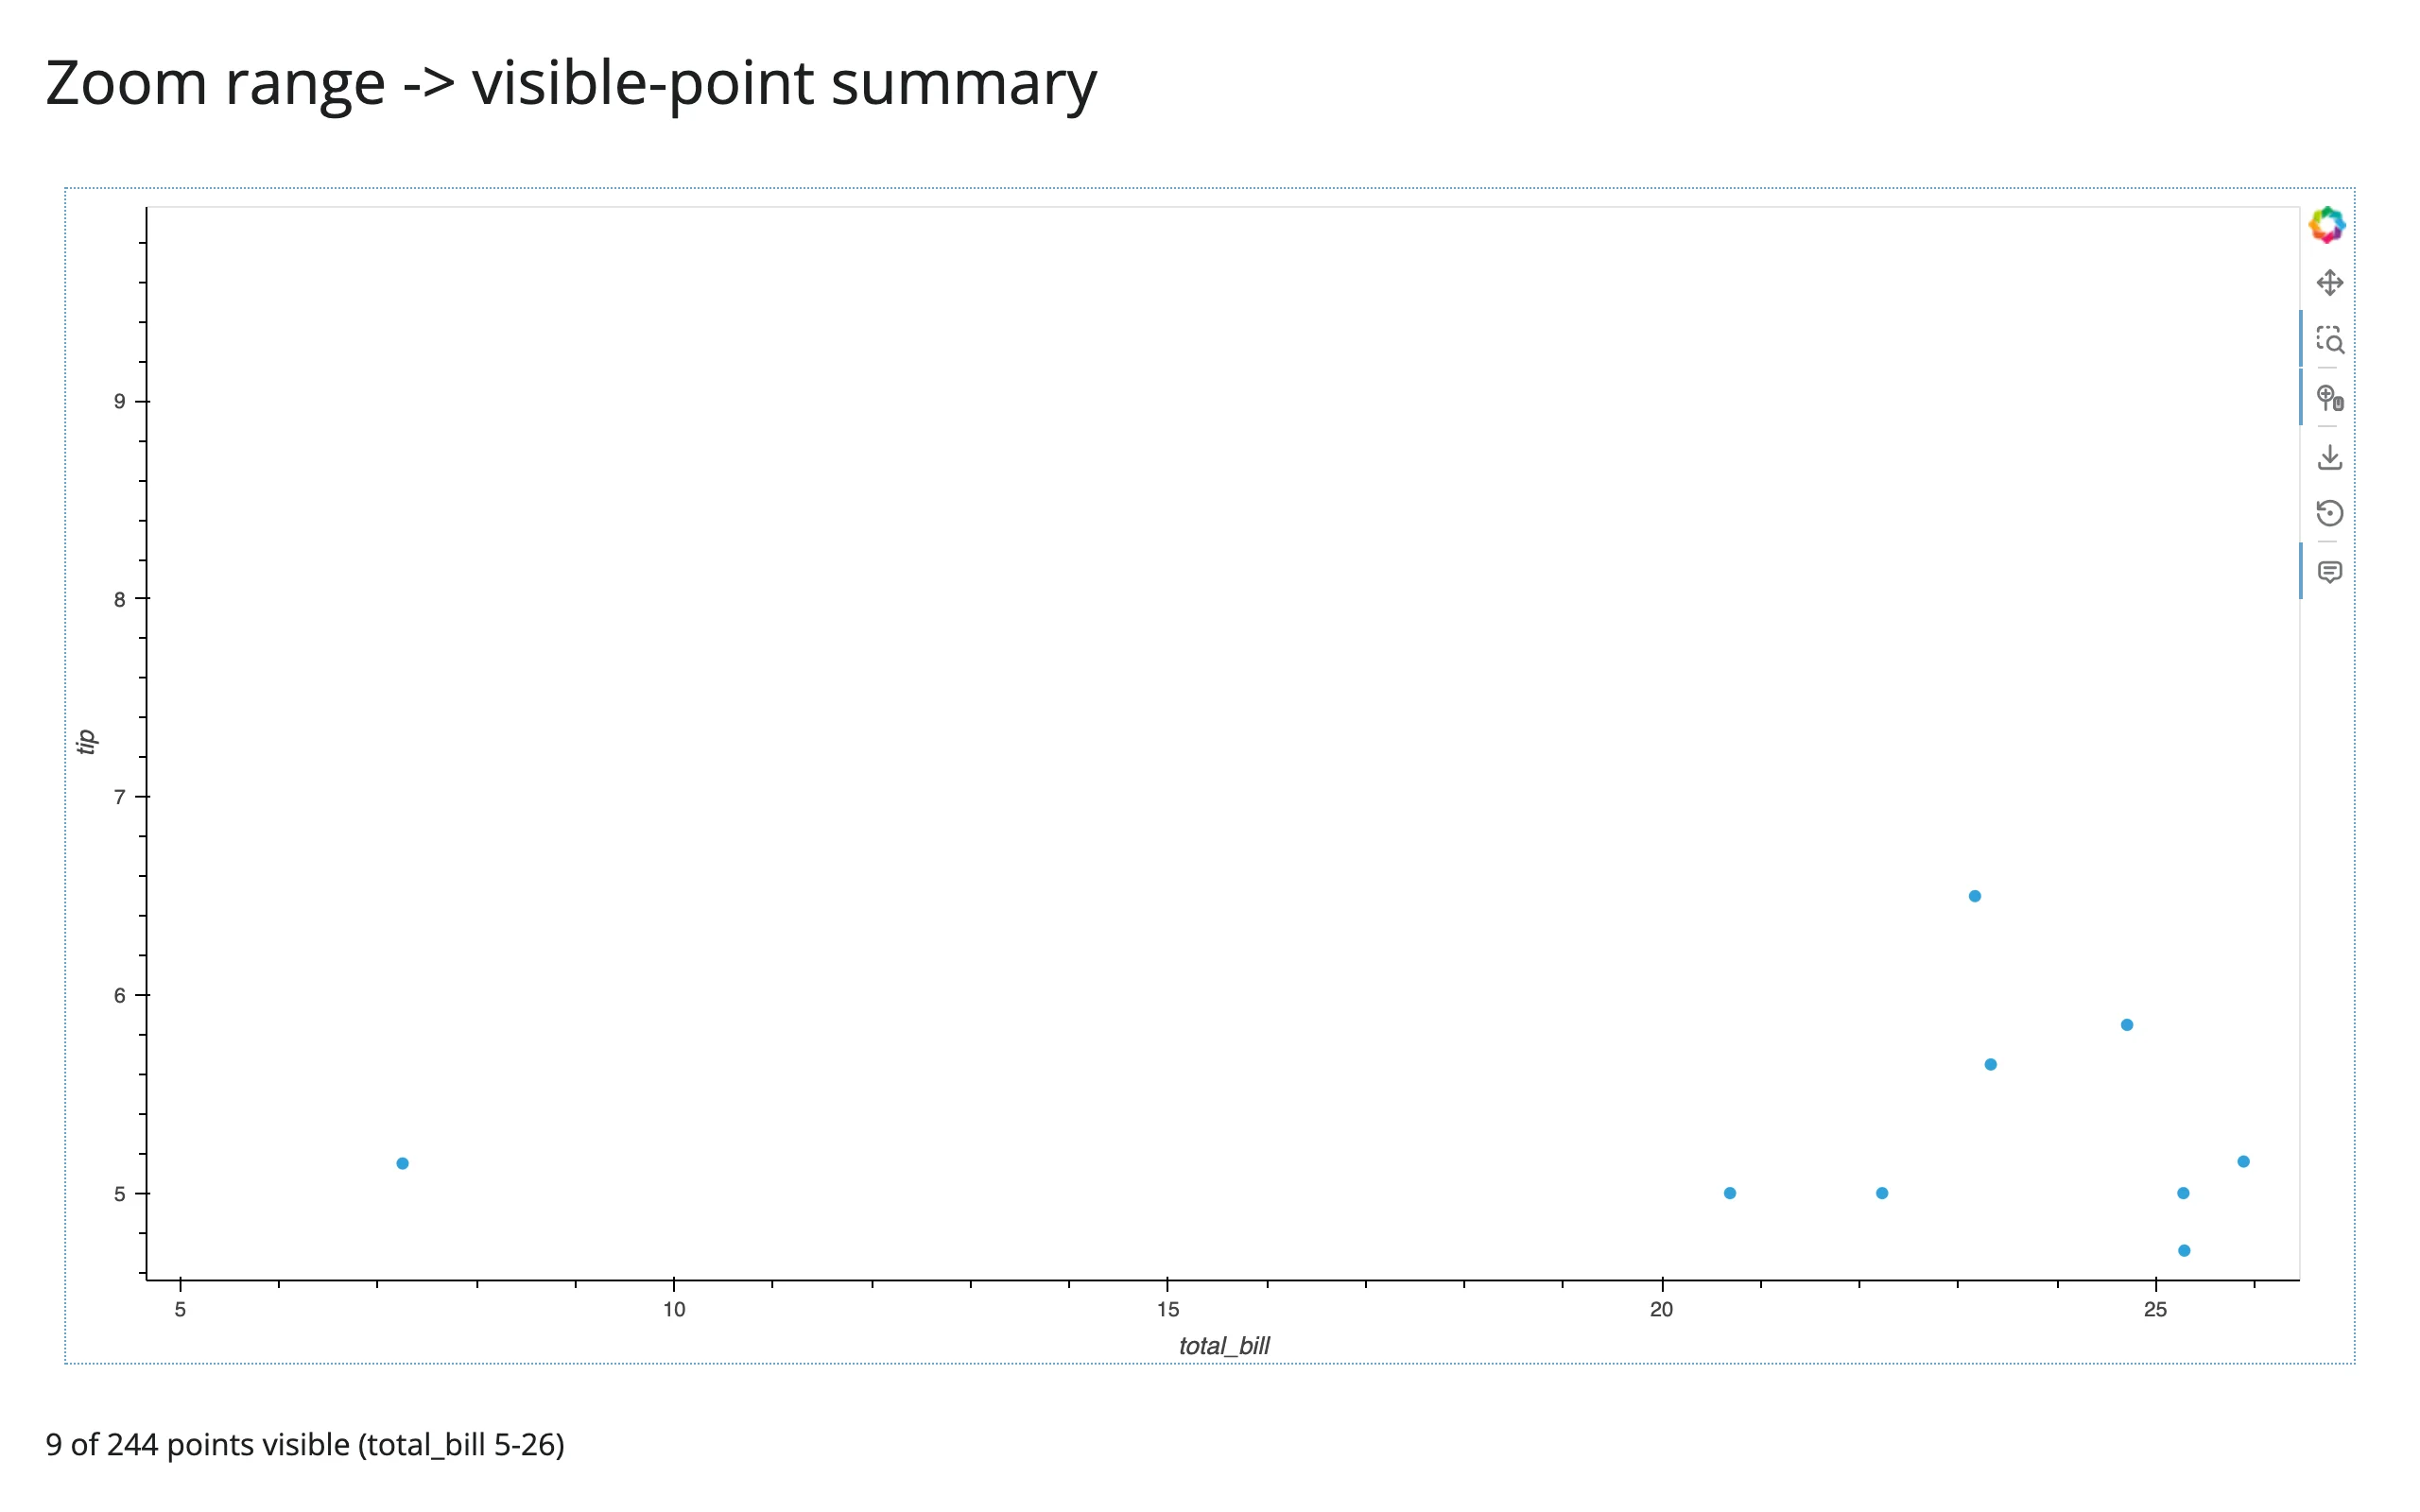
Verified with a real box-zoom gesture: the summary goes from “244 of 244 points visible” to “9 of 244 points visible”, with no re-render loop (0 RuntimeErrors in the server log across the whole session).
Updating the widget from Python
Re-rendering (as in the Gapminder slider above) is simplest, but it replaces the plot, so any zoom/pan the user made is lost. Driving a DynamicMap with a stream updates the existing plot instead – same bokeh model, same comm, so the view survives. examples/07_update_in_place.py shows both side by side:
# Driving a DynamicMap with a stream updates the existing plot: the bokeh
# model stays put, so pan/zoom state survives. Re-rendering (left as a
# contrast on the right) builds a brand-new plot every time, which resets
# the view. Click "New data" after zooming into both to see the difference.
import holoviews as hv
import numpy as np
from shiny import reactive
from shiny.express import input, render, ui

from shinywidgets import render_holoviews

hv.extension("bokeh")

rng = np.random.default_rng(0)


def random_walk(n=200):
    return np.cumsum(rng.normal(size=n))


ui.page_opts(title="In-place update vs. re-render", fillable=True)
ui.input_action_button("refresh", "New data")

pipe = hv.streams.Pipe(data=random_walk())

with ui.layout_columns():
    with ui.card(full_screen=True):
        ui.card_header("In place: hv.streams.Pipe (preserves zoom)")

        @render_holoviews
        def in_place():
            return hv.DynamicMap(
                lambda data: hv.Curve(data).opts(responsive=True), streams=[pipe]
            )

    with ui.card(full_screen=True):
        ui.card_header("Re-render: reads a reactive value directly (resets zoom)")
        data = reactive.value(random_walk())

        @render_holoviews
        def rerendered():
            return hv.Curve(data()).opts(responsive=True)


@reactive.effect
@reactive.event(input.refresh)
def _():
    new_data = random_walk()
    pipe.send(new_data)
    data.set(new_data)
Both plots zoomed in, then “New data” clicked once:
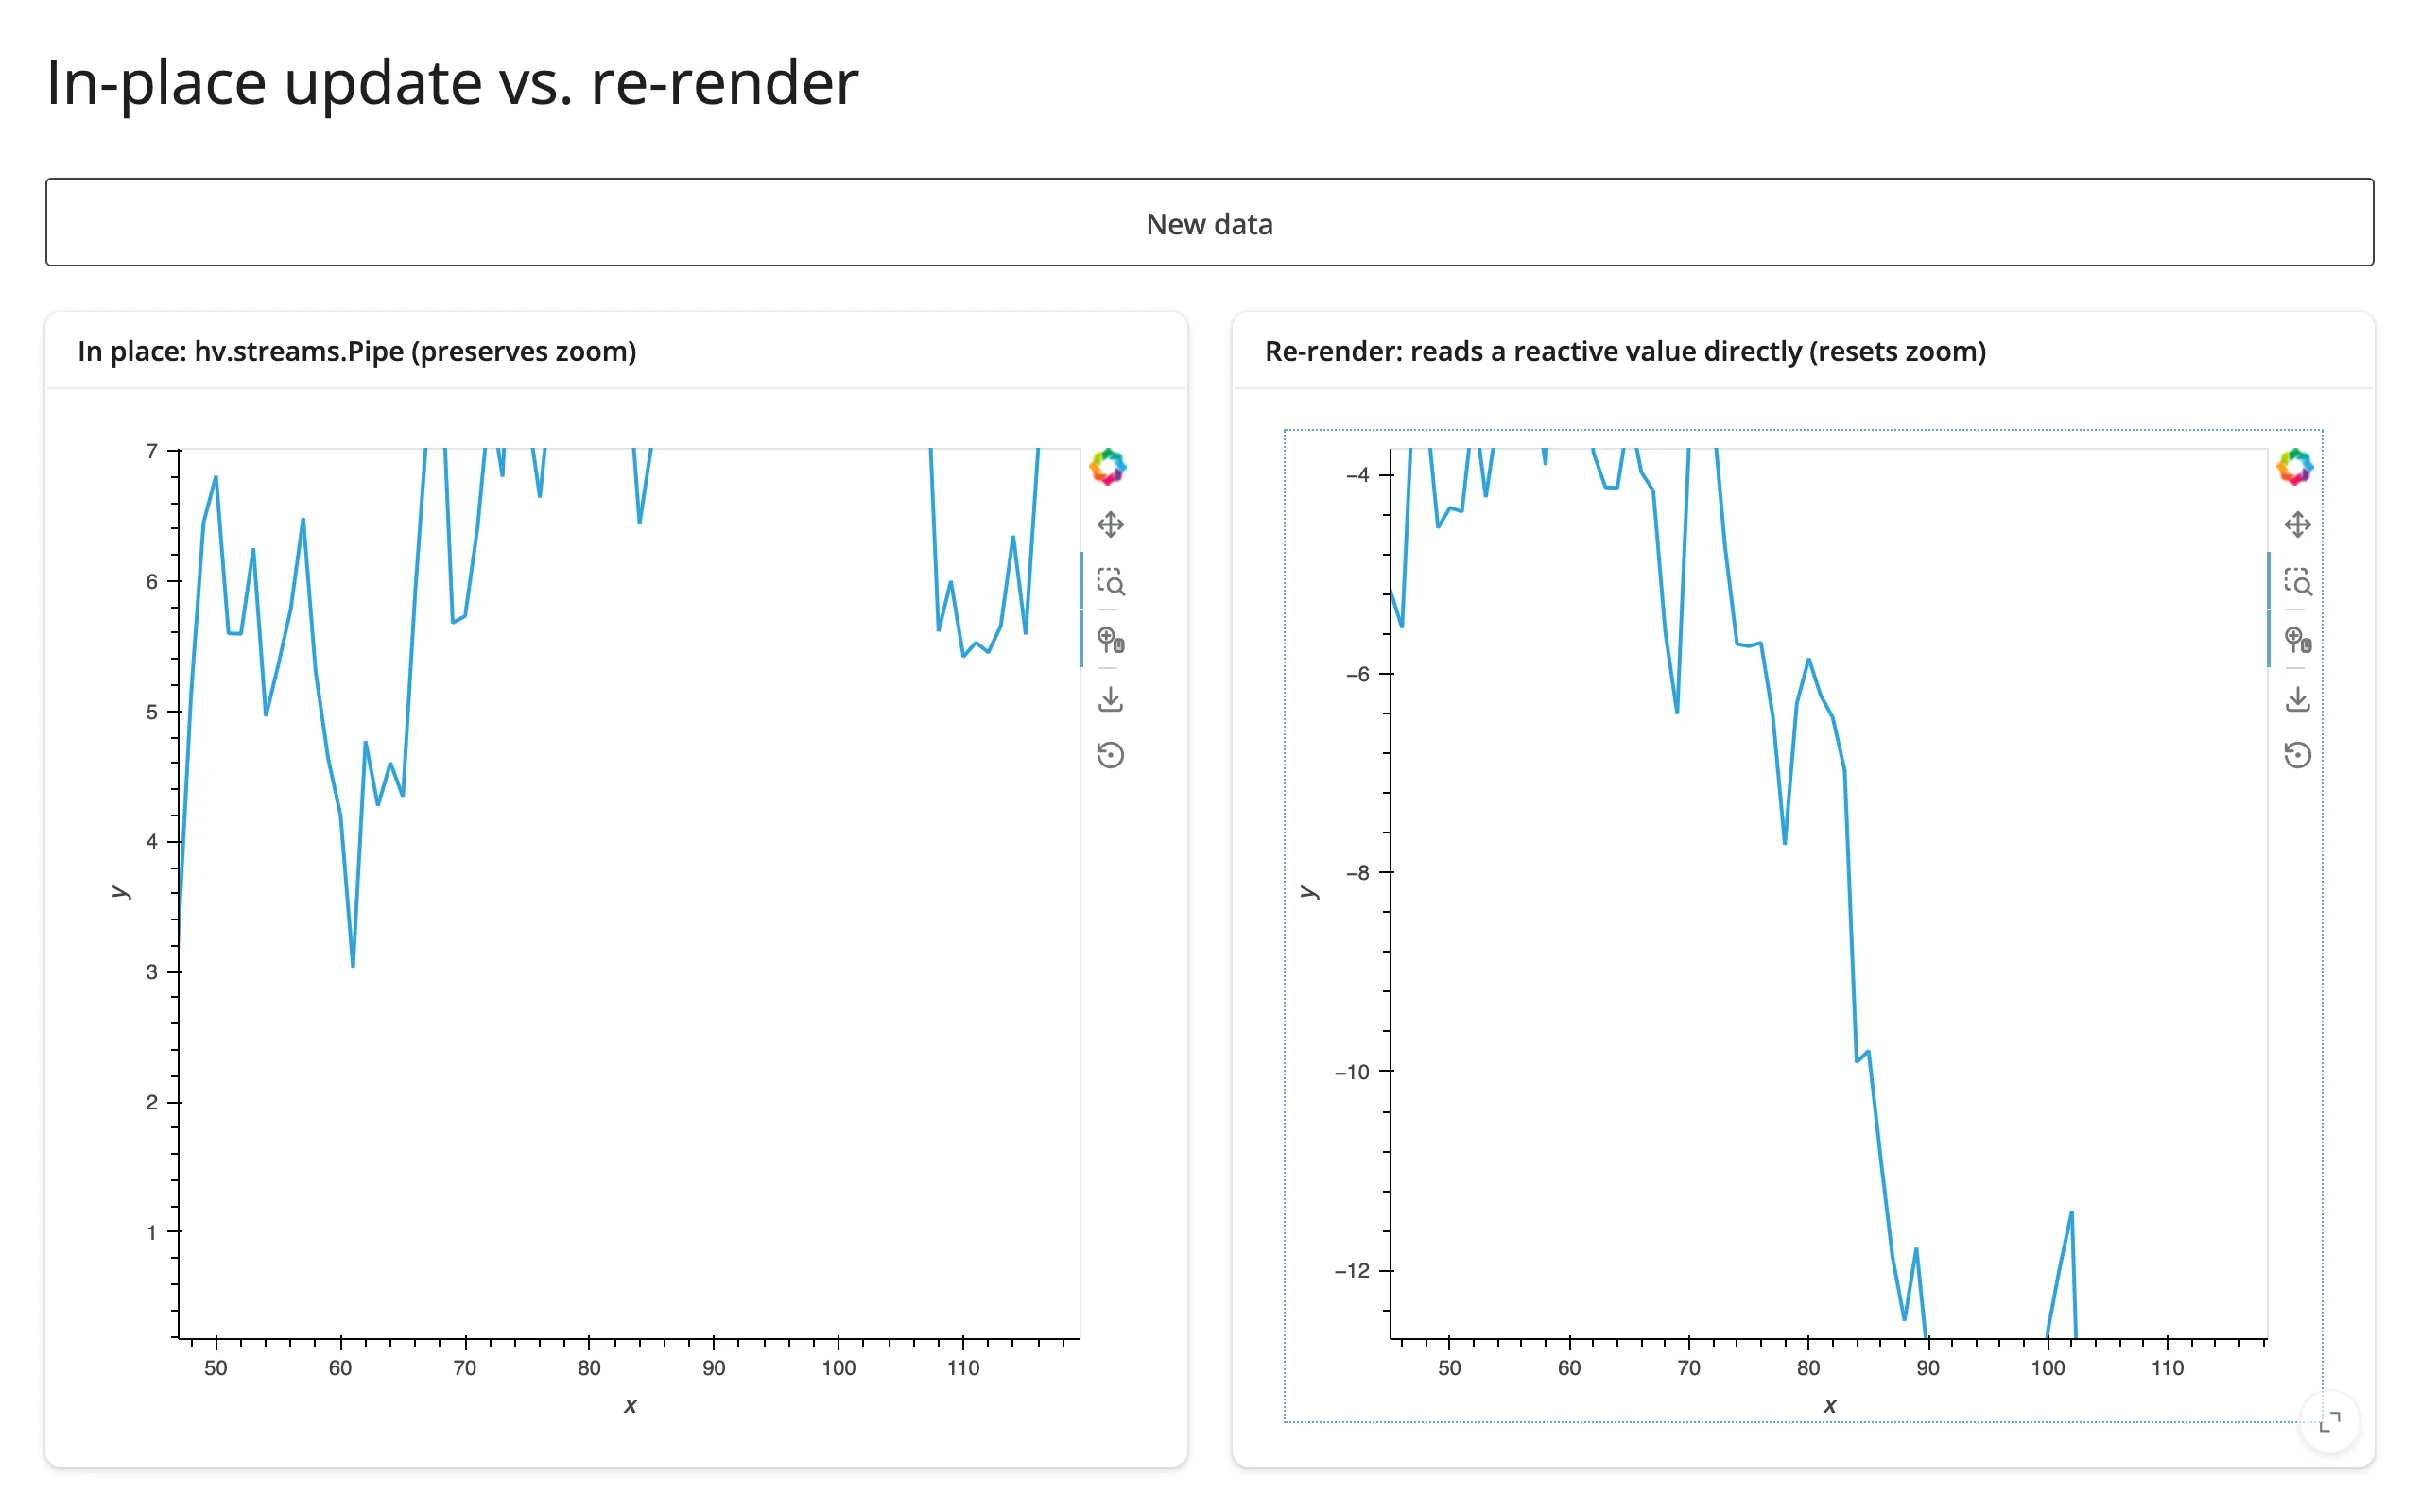
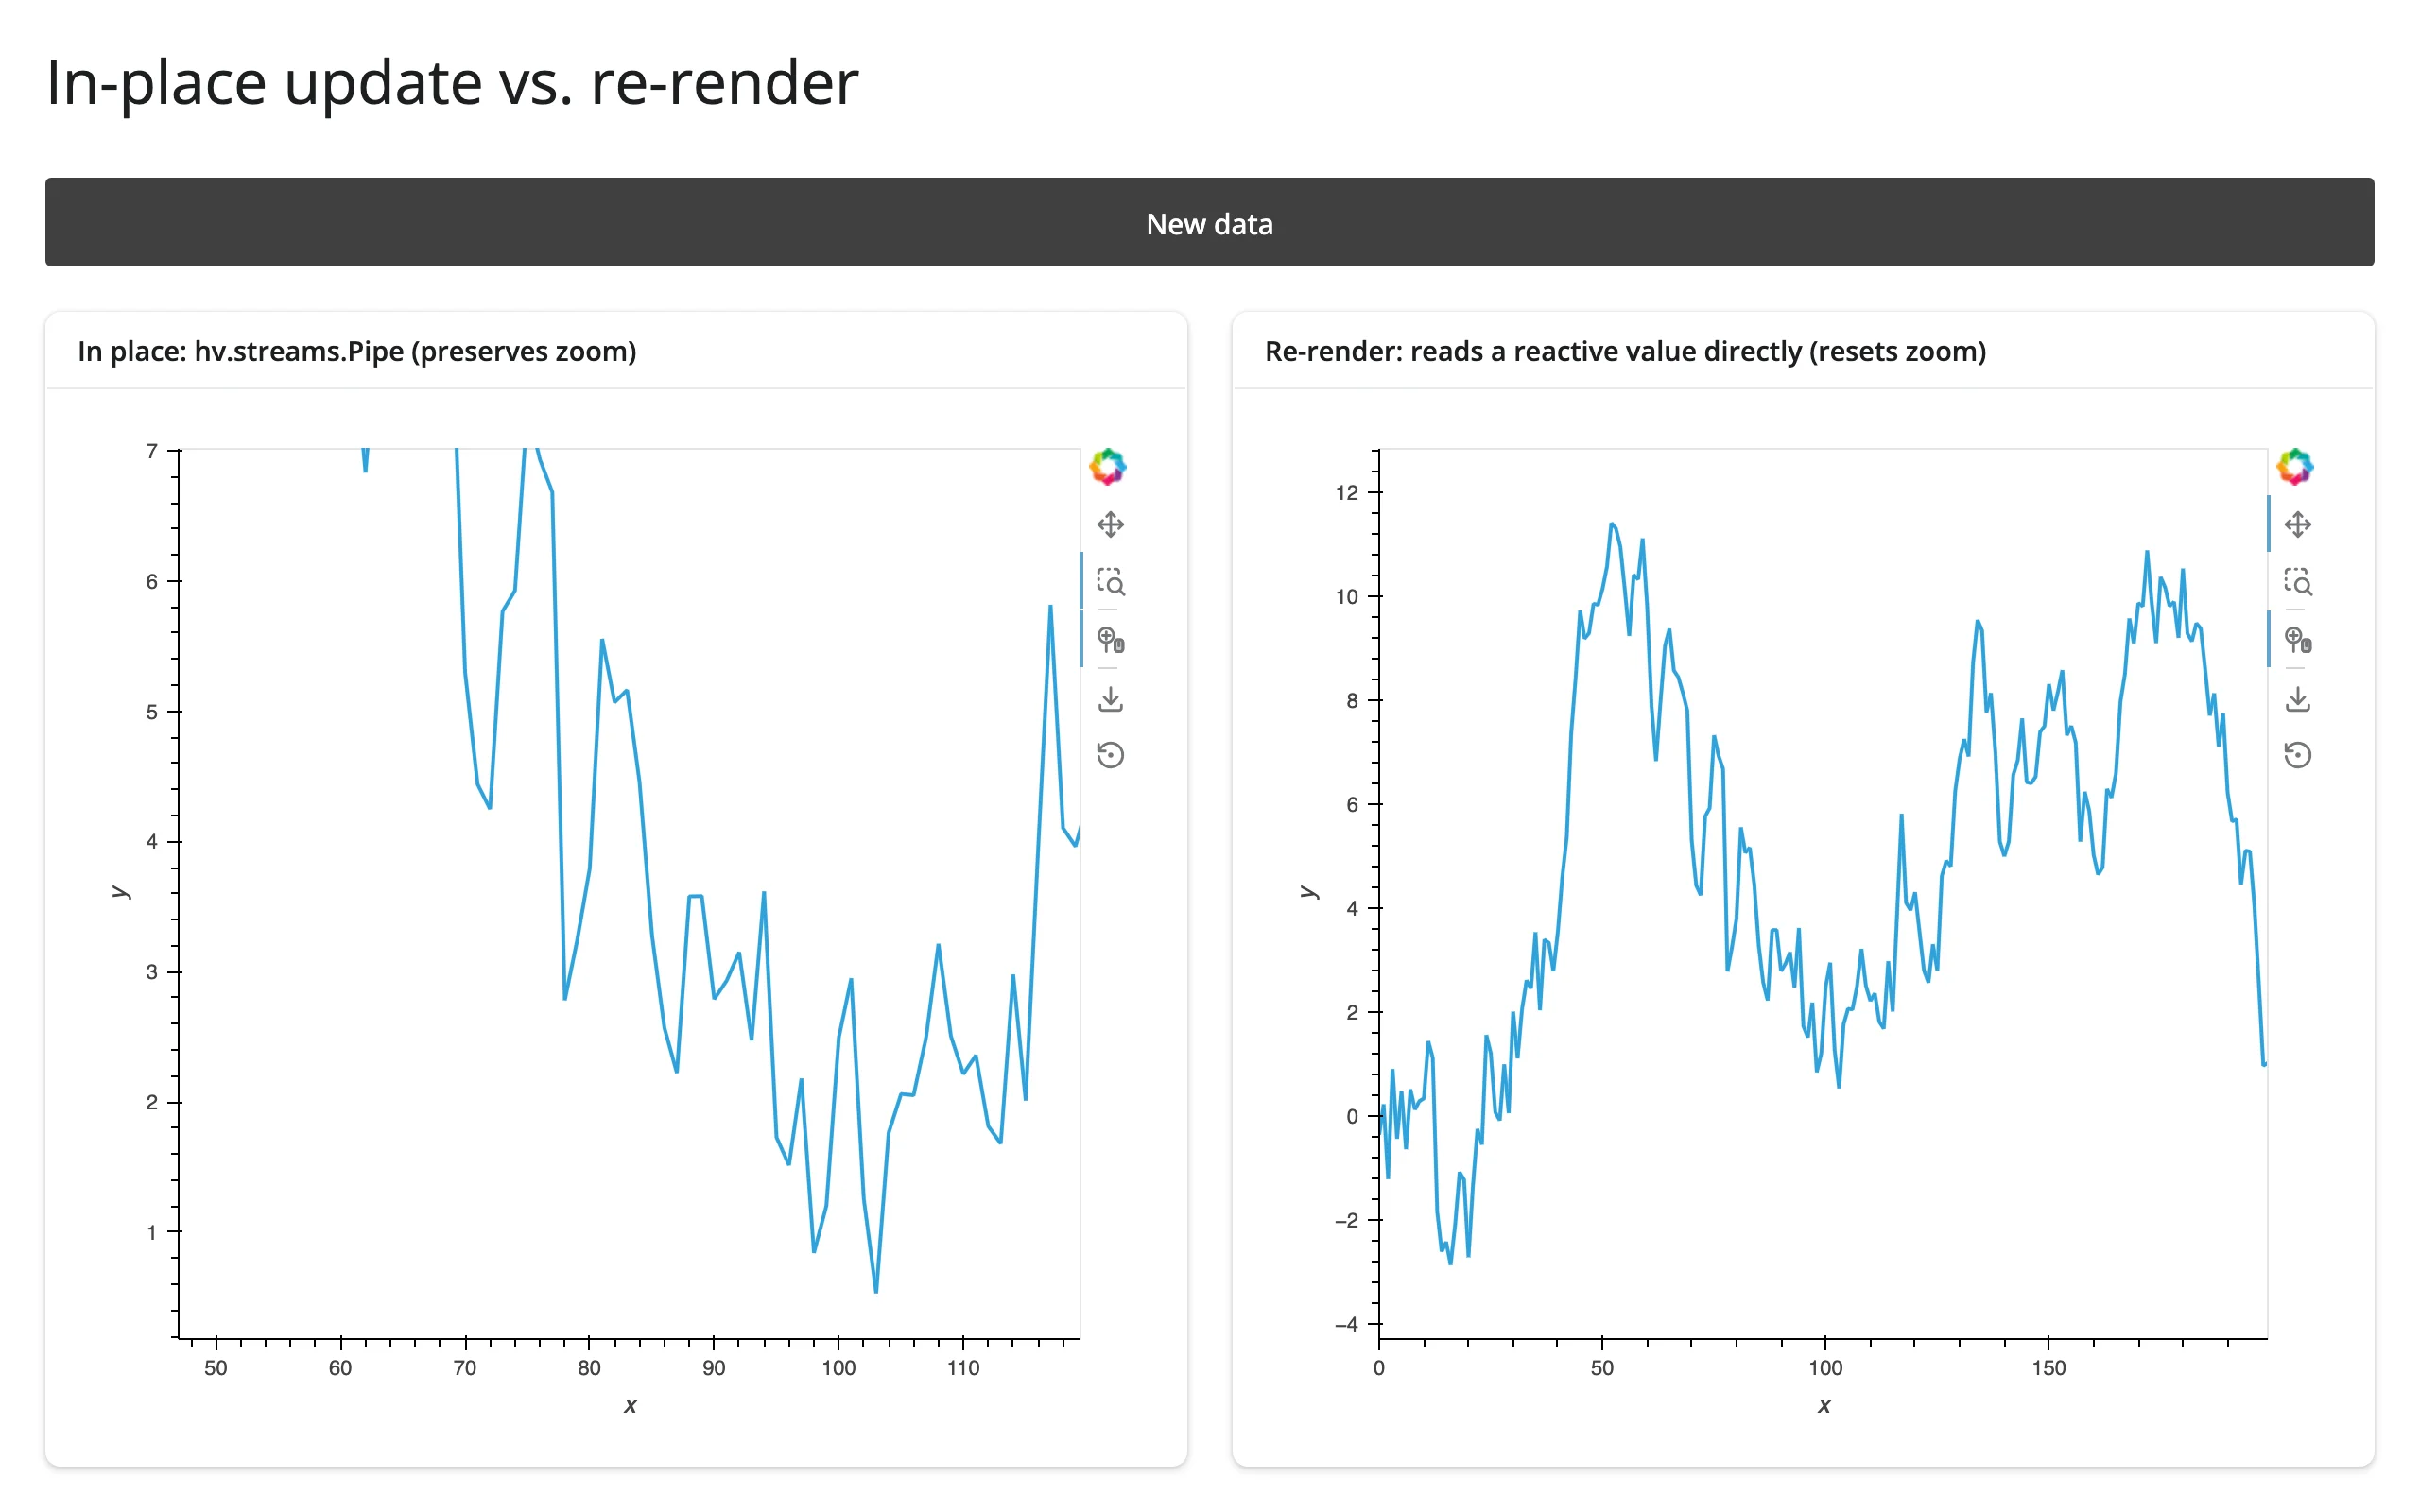
The left plot (driven by pipe.send()) keeps its zoomed x-range; the right plot (plain re-render) snaps back to the full default range. Use the in-place form whenever preserving view state – zoom, pan, a link_selections selection – across updates matters more than the simplicity of just reading an input directly. stream.event(...) works the same way for a custom hv.streams.Stream subclass; Pipe.send(data) is the shortcut for “replace the data entirely.”
Coordinating multiple views
Pattern 1: box-select -> filtered table
Covered above in The recipe (examples/06_boxselect_table.py): a BoundsXY stream’s bounds become a pandas boolean mask, and a @render.data_frame shows the matching rows.
Pattern 2: click -> detail card
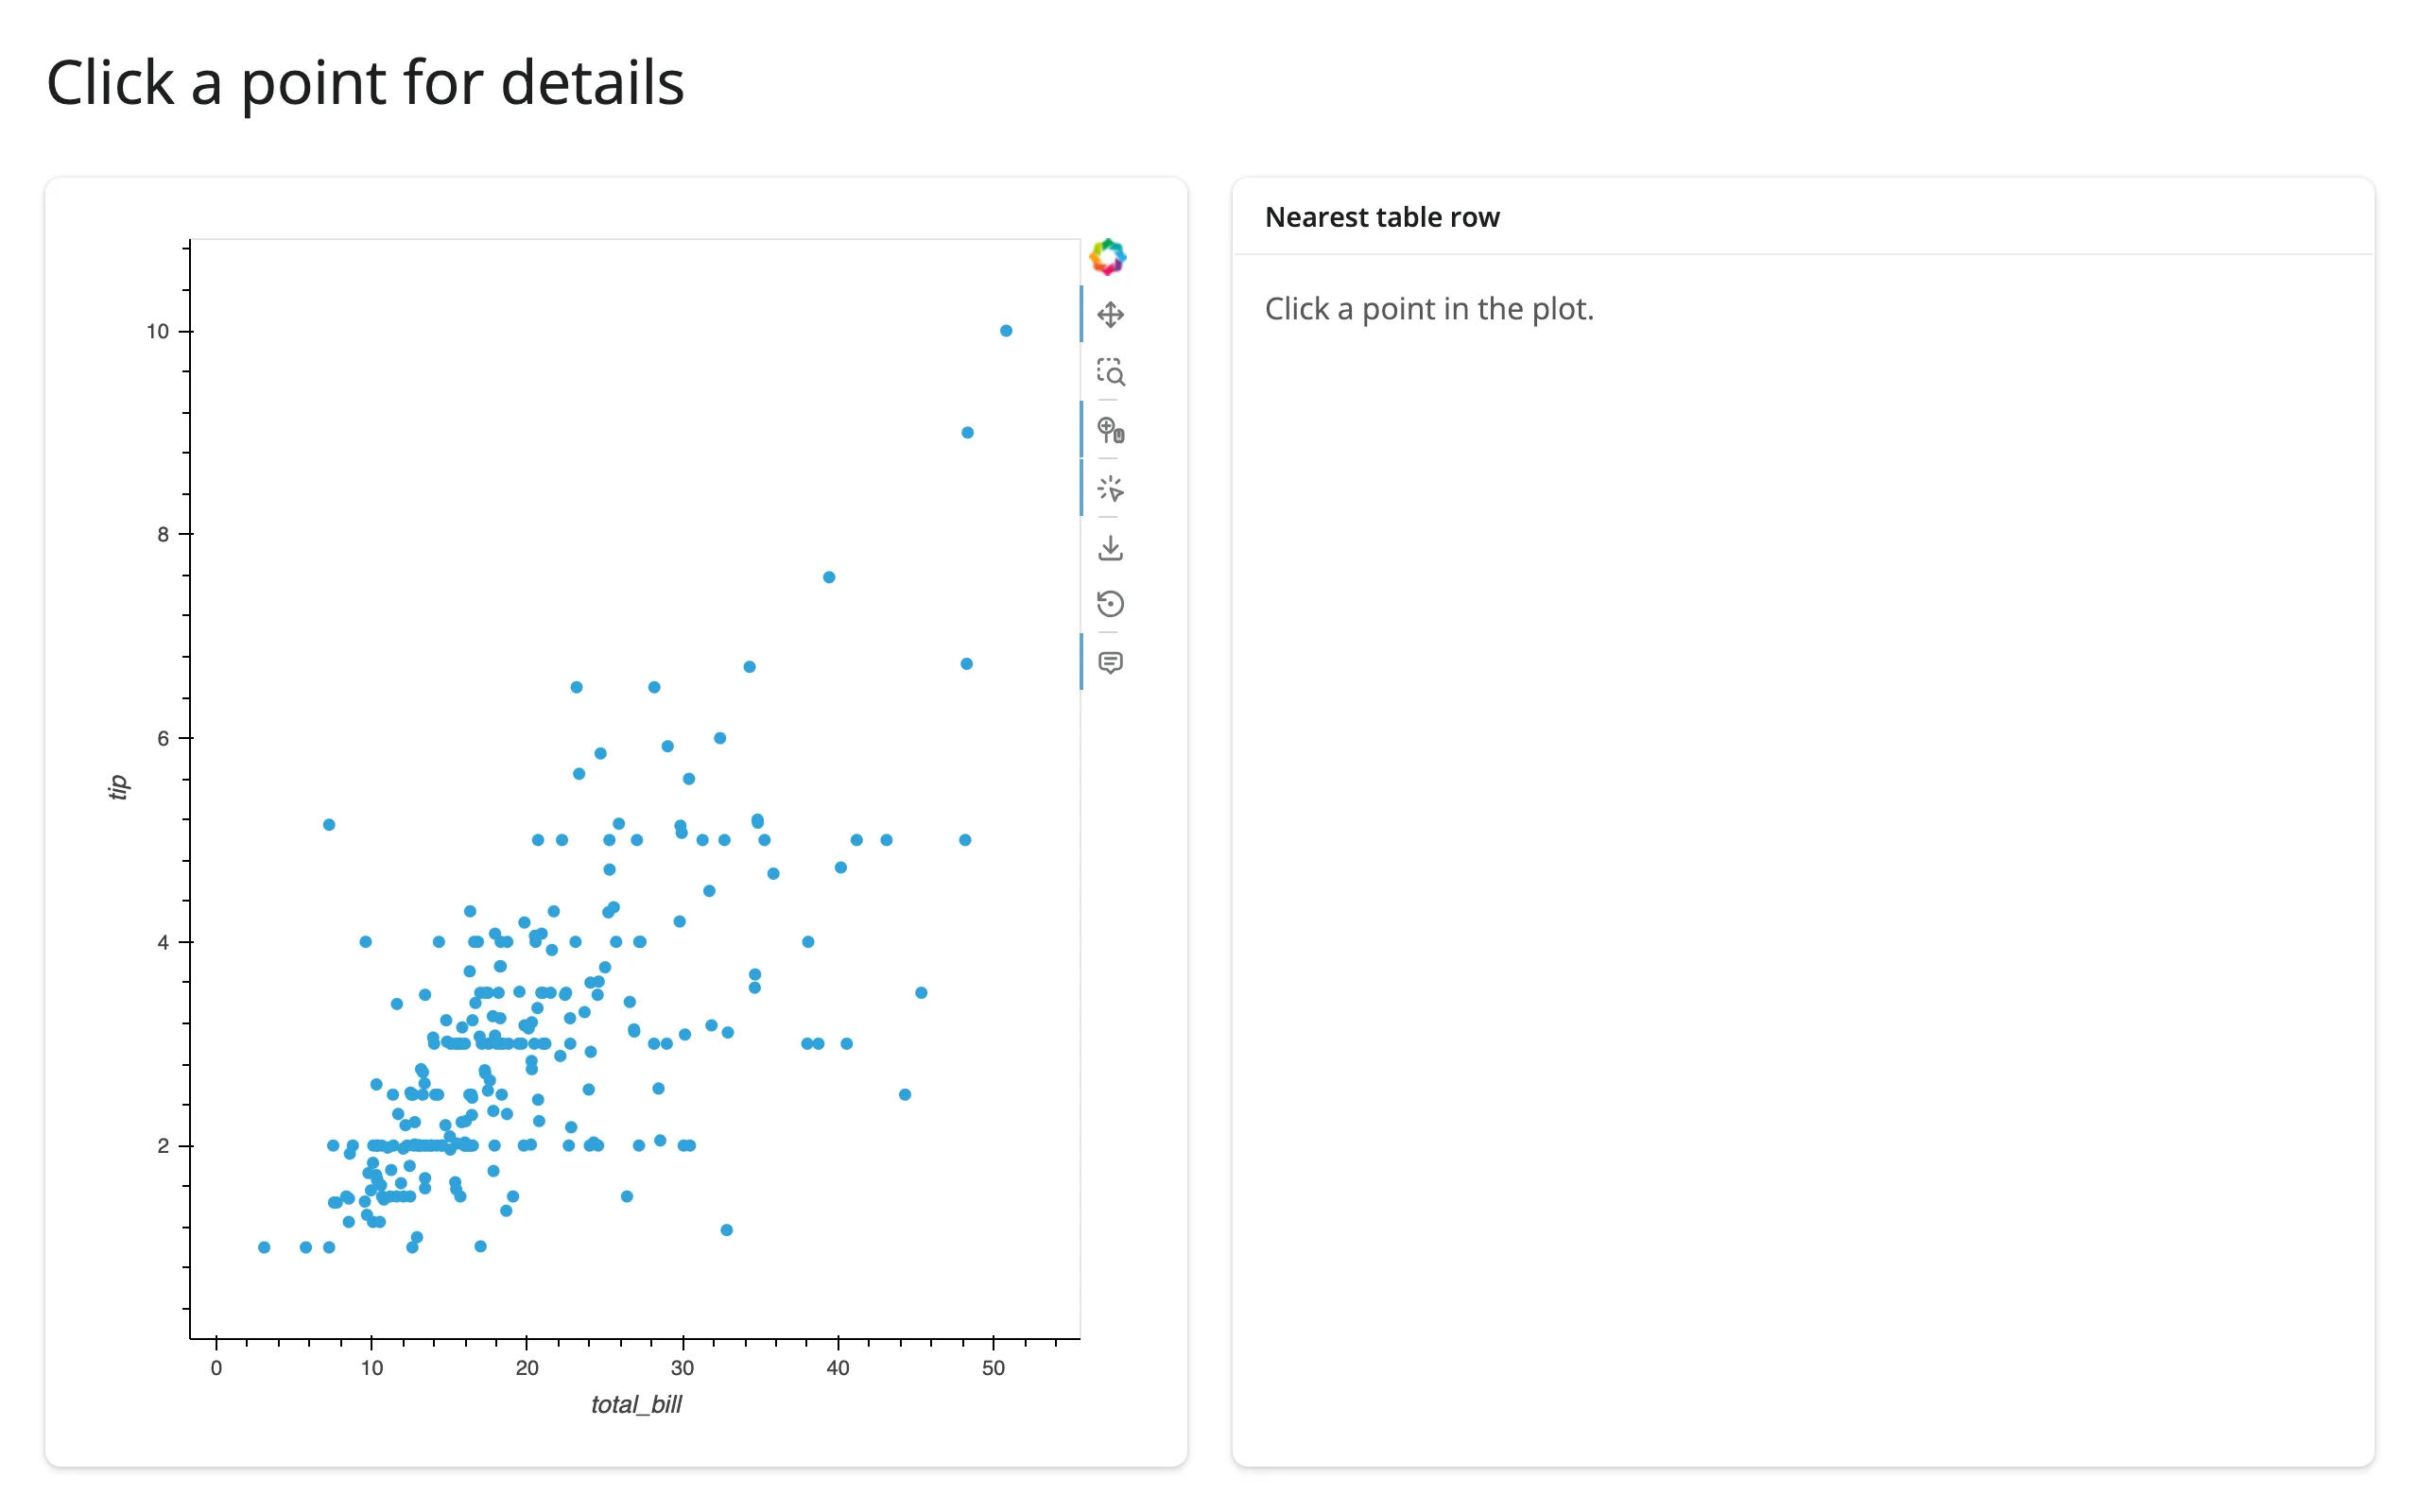
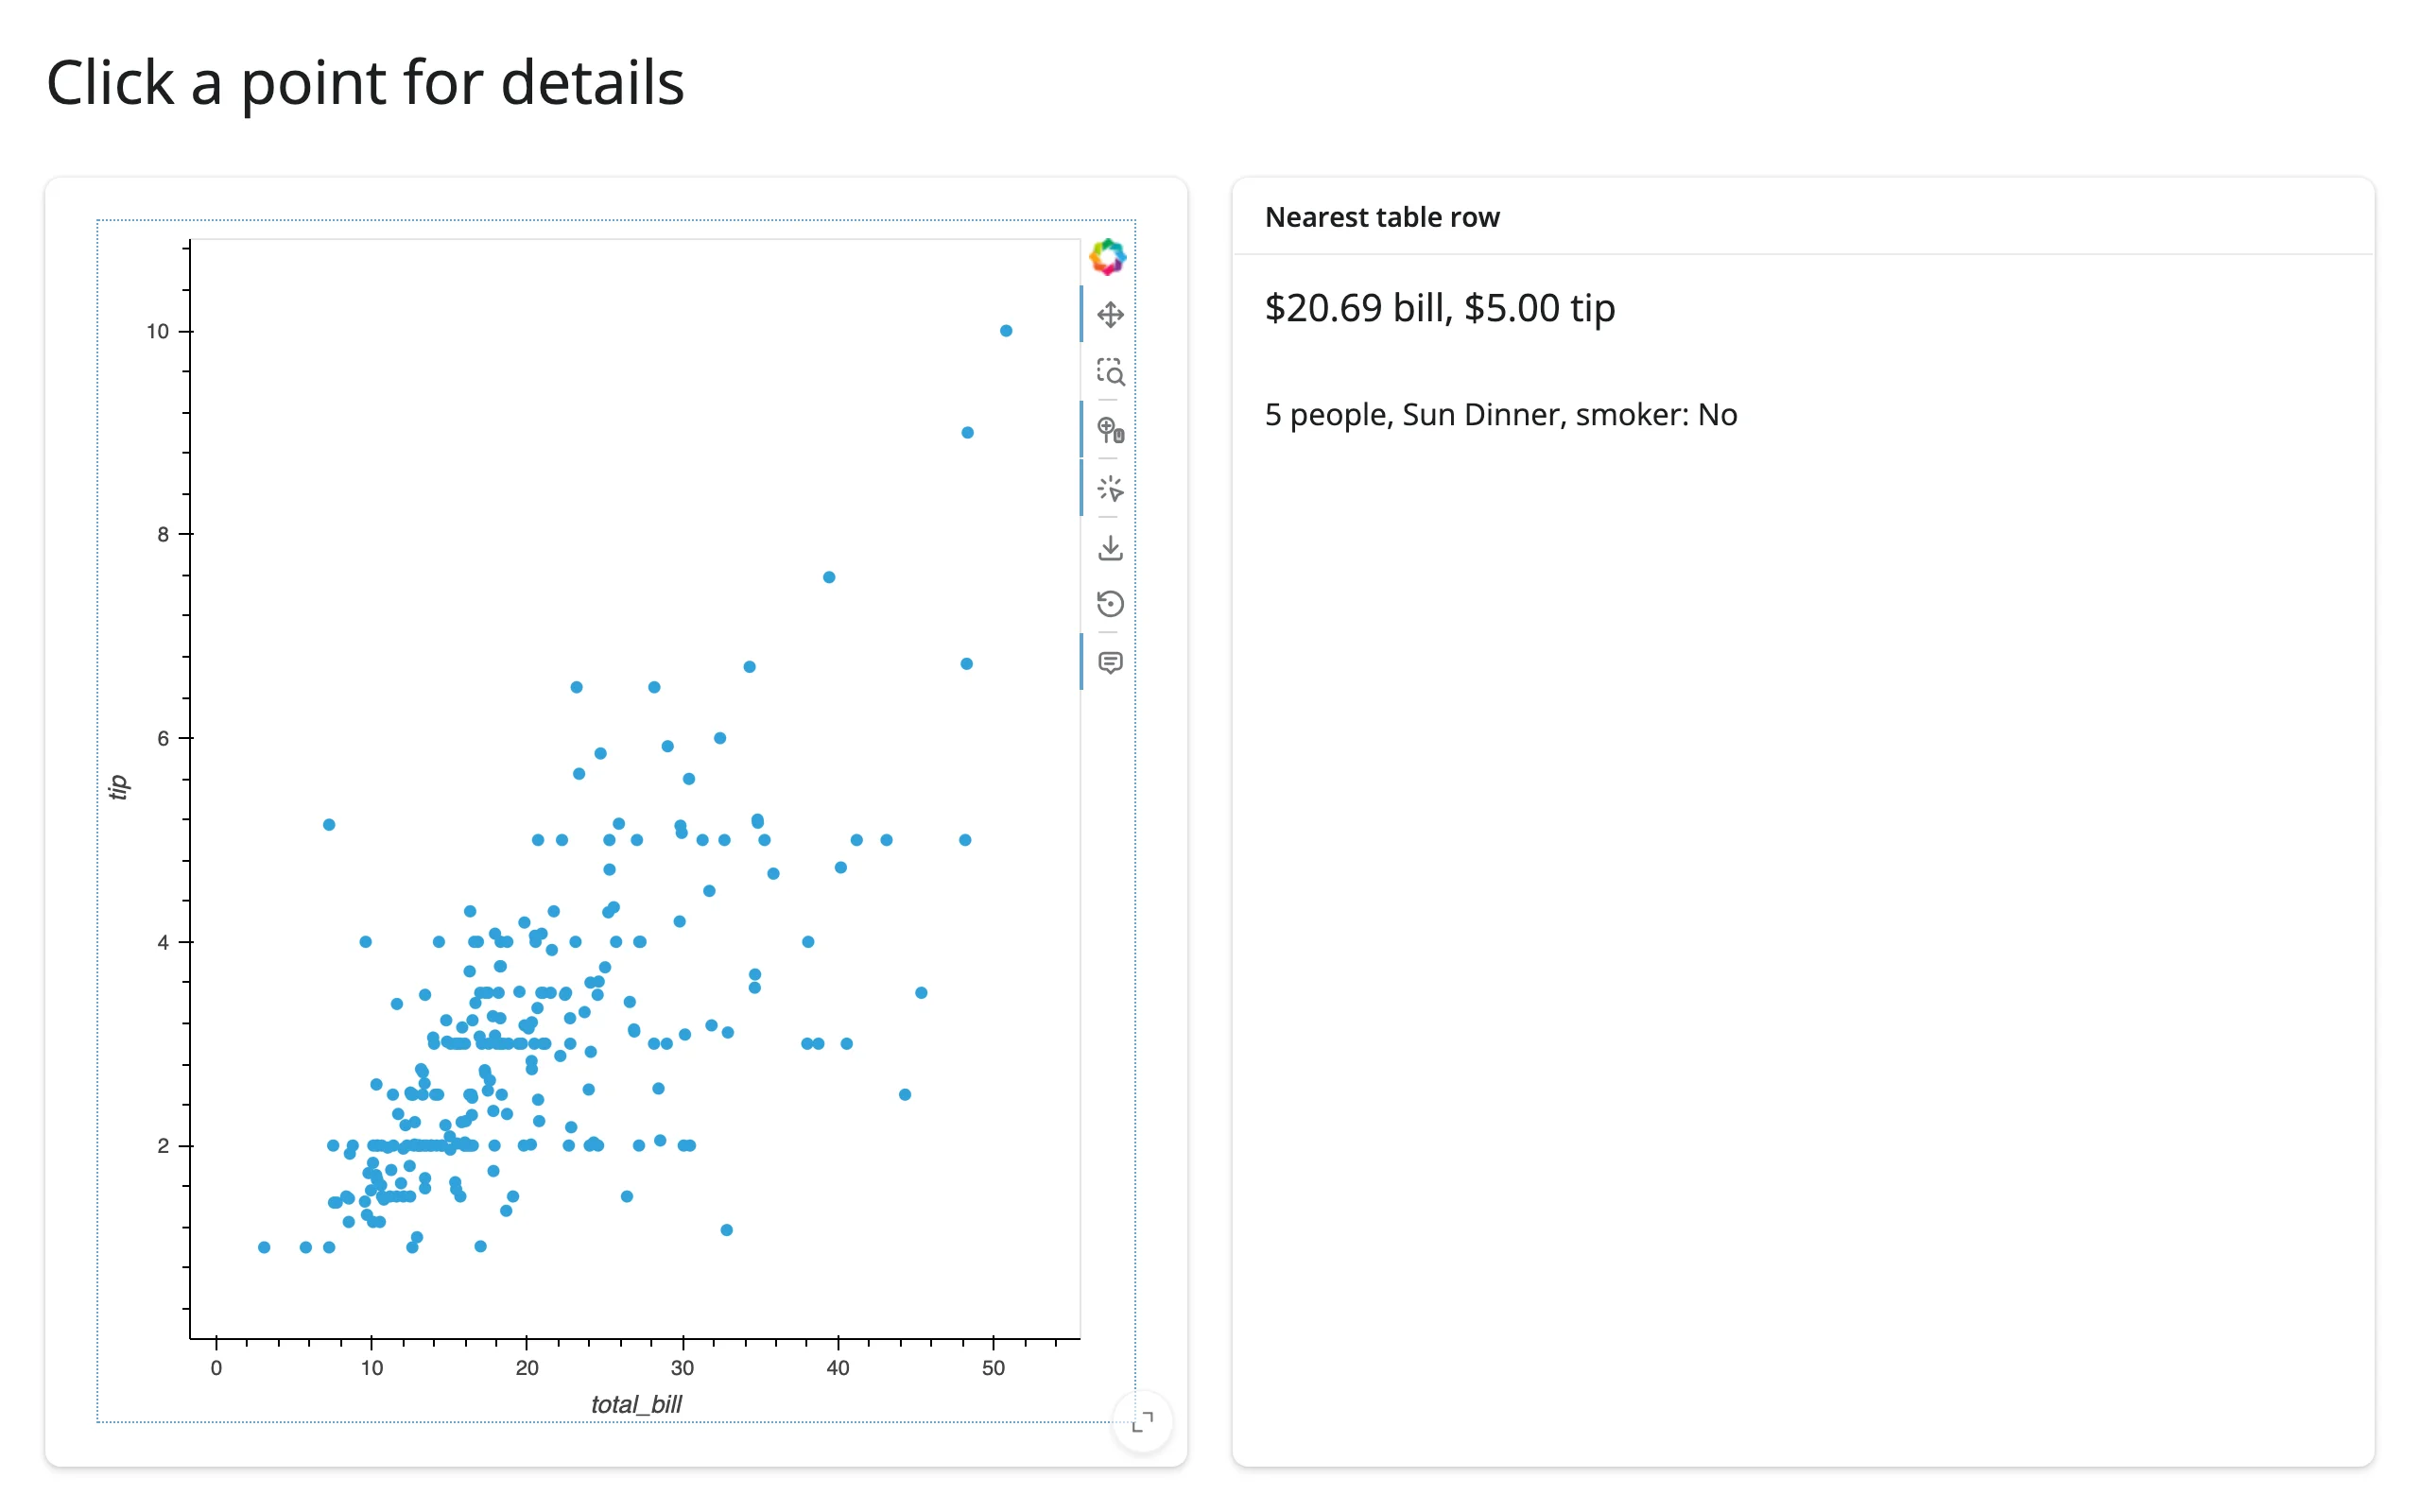
examples/08_tap_detail.py – hv.streams.Tap reports the clicked point in data coordinates; look up the nearest row and show its details:
# Click a point to show its full row in a detail card. hv.streams.Tap reports
# the data-space (x, y) of the click; the nearest row is looked up on the
# Shiny side, same recipe as the box-select example.
import holoviews as hv
import plotly.express as px
import hvplot.pandas  # noqa: F401
from shiny import reactive
from shiny.express import render, ui

from shinywidgets import render_holoviews

hv.extension("bokeh")

tips = px.data.tips()
tap_xy = reactive.value(None)

ui.page_opts(title="Click a point for details", fillable=True)

with ui.layout_columns():
    with ui.card(full_screen=True):

        @render_holoviews
        def scatter():
            points = tips.hvplot.scatter(
                "total_bill", "tip", responsive=True, tools=["tap"]
            )
            hv.streams.Tap(source=points).add_subscriber(
                lambda x, y: tap_xy.set((x, y))
            )
            return points

    with ui.card():
        ui.card_header("Nearest table row")

        @render.ui
        def detail():
            xy = tap_xy()
            if xy is None:
                return ui.p("Click a point in the plot.", class_="text-muted")
            x, y = xy
            dist = (tips.total_bill - x) ** 2 + (tips.tip - y) ** 2
            row = tips.loc[dist.idxmin()]
            return ui.TagList(
                ui.h5(f"${row.total_bill:.2f} bill, ${row.tip:.2f} tip"),
                ui.p(f"{row['size']} people, {row.day} {row.time}, smoker: {row.smoker}"),
            )
Pattern 3: crossfilter dashboard, bridged into ordinary Shiny outputs
link_selections crossfilters its own plots with no callback, but its selection is also a param event – watch it to bring the same selection into ordinary Shiny outputs (value boxes, tables, anything). examples/09_link_selections_dashboard.py:
# link_selections crossfilters the plots on its own, but its selection is
# also a param event -- watch it to bring the same selection into ordinary
# Shiny outputs (here, two value boxes).
import holoviews as hv
import plotly.express as px
import hvplot.pandas  # noqa: F401
from shiny import reactive
from shiny.express import render, ui

from shinywidgets import render_holoviews

hv.extension("bokeh")

tips = px.data.tips()

ui.page_opts(title="Crossfilter dashboard", fillable=True)

links = hv.link_selections.instance()
selection_expr = reactive.value(None)
_watcher = links.param.watch(
    lambda event: selection_expr.set(event.new), "selection_expr"
)


@reactive.calc
def selected():
    expr = selection_expr()
    return tips if expr is None else links.filter(tips, selection_expr=expr)


with ui.layout_columns(fill=False):
    with ui.value_box():
        "Rows selected"

        @render.text
        def n_selected():
            return f"{len(selected())} of {len(tips)}"

    with ui.value_box():
        "Average tip %"

        @render.text
        def avg_pct():
            sel = selected()
            if not len(sel):
                return "-"
            return f"{(sel.tip / sel.total_bill).mean():.1%}"

with ui.card(full_screen=True):

    @render_holoviews
    def crossfilter():
        scatter = tips.hvplot.scatter(
            "total_bill", "tip", responsive=True, title="Bill vs. tip"
        ).opts(active_tools=["box_select"])
        tip_hist = tips.hvplot.hist(
            "tip", responsive=True, title="Tip distribution"
        ).opts(active_tools=["box_select"])
        return links(scatter + tip_hist).opts(shared_axes=False)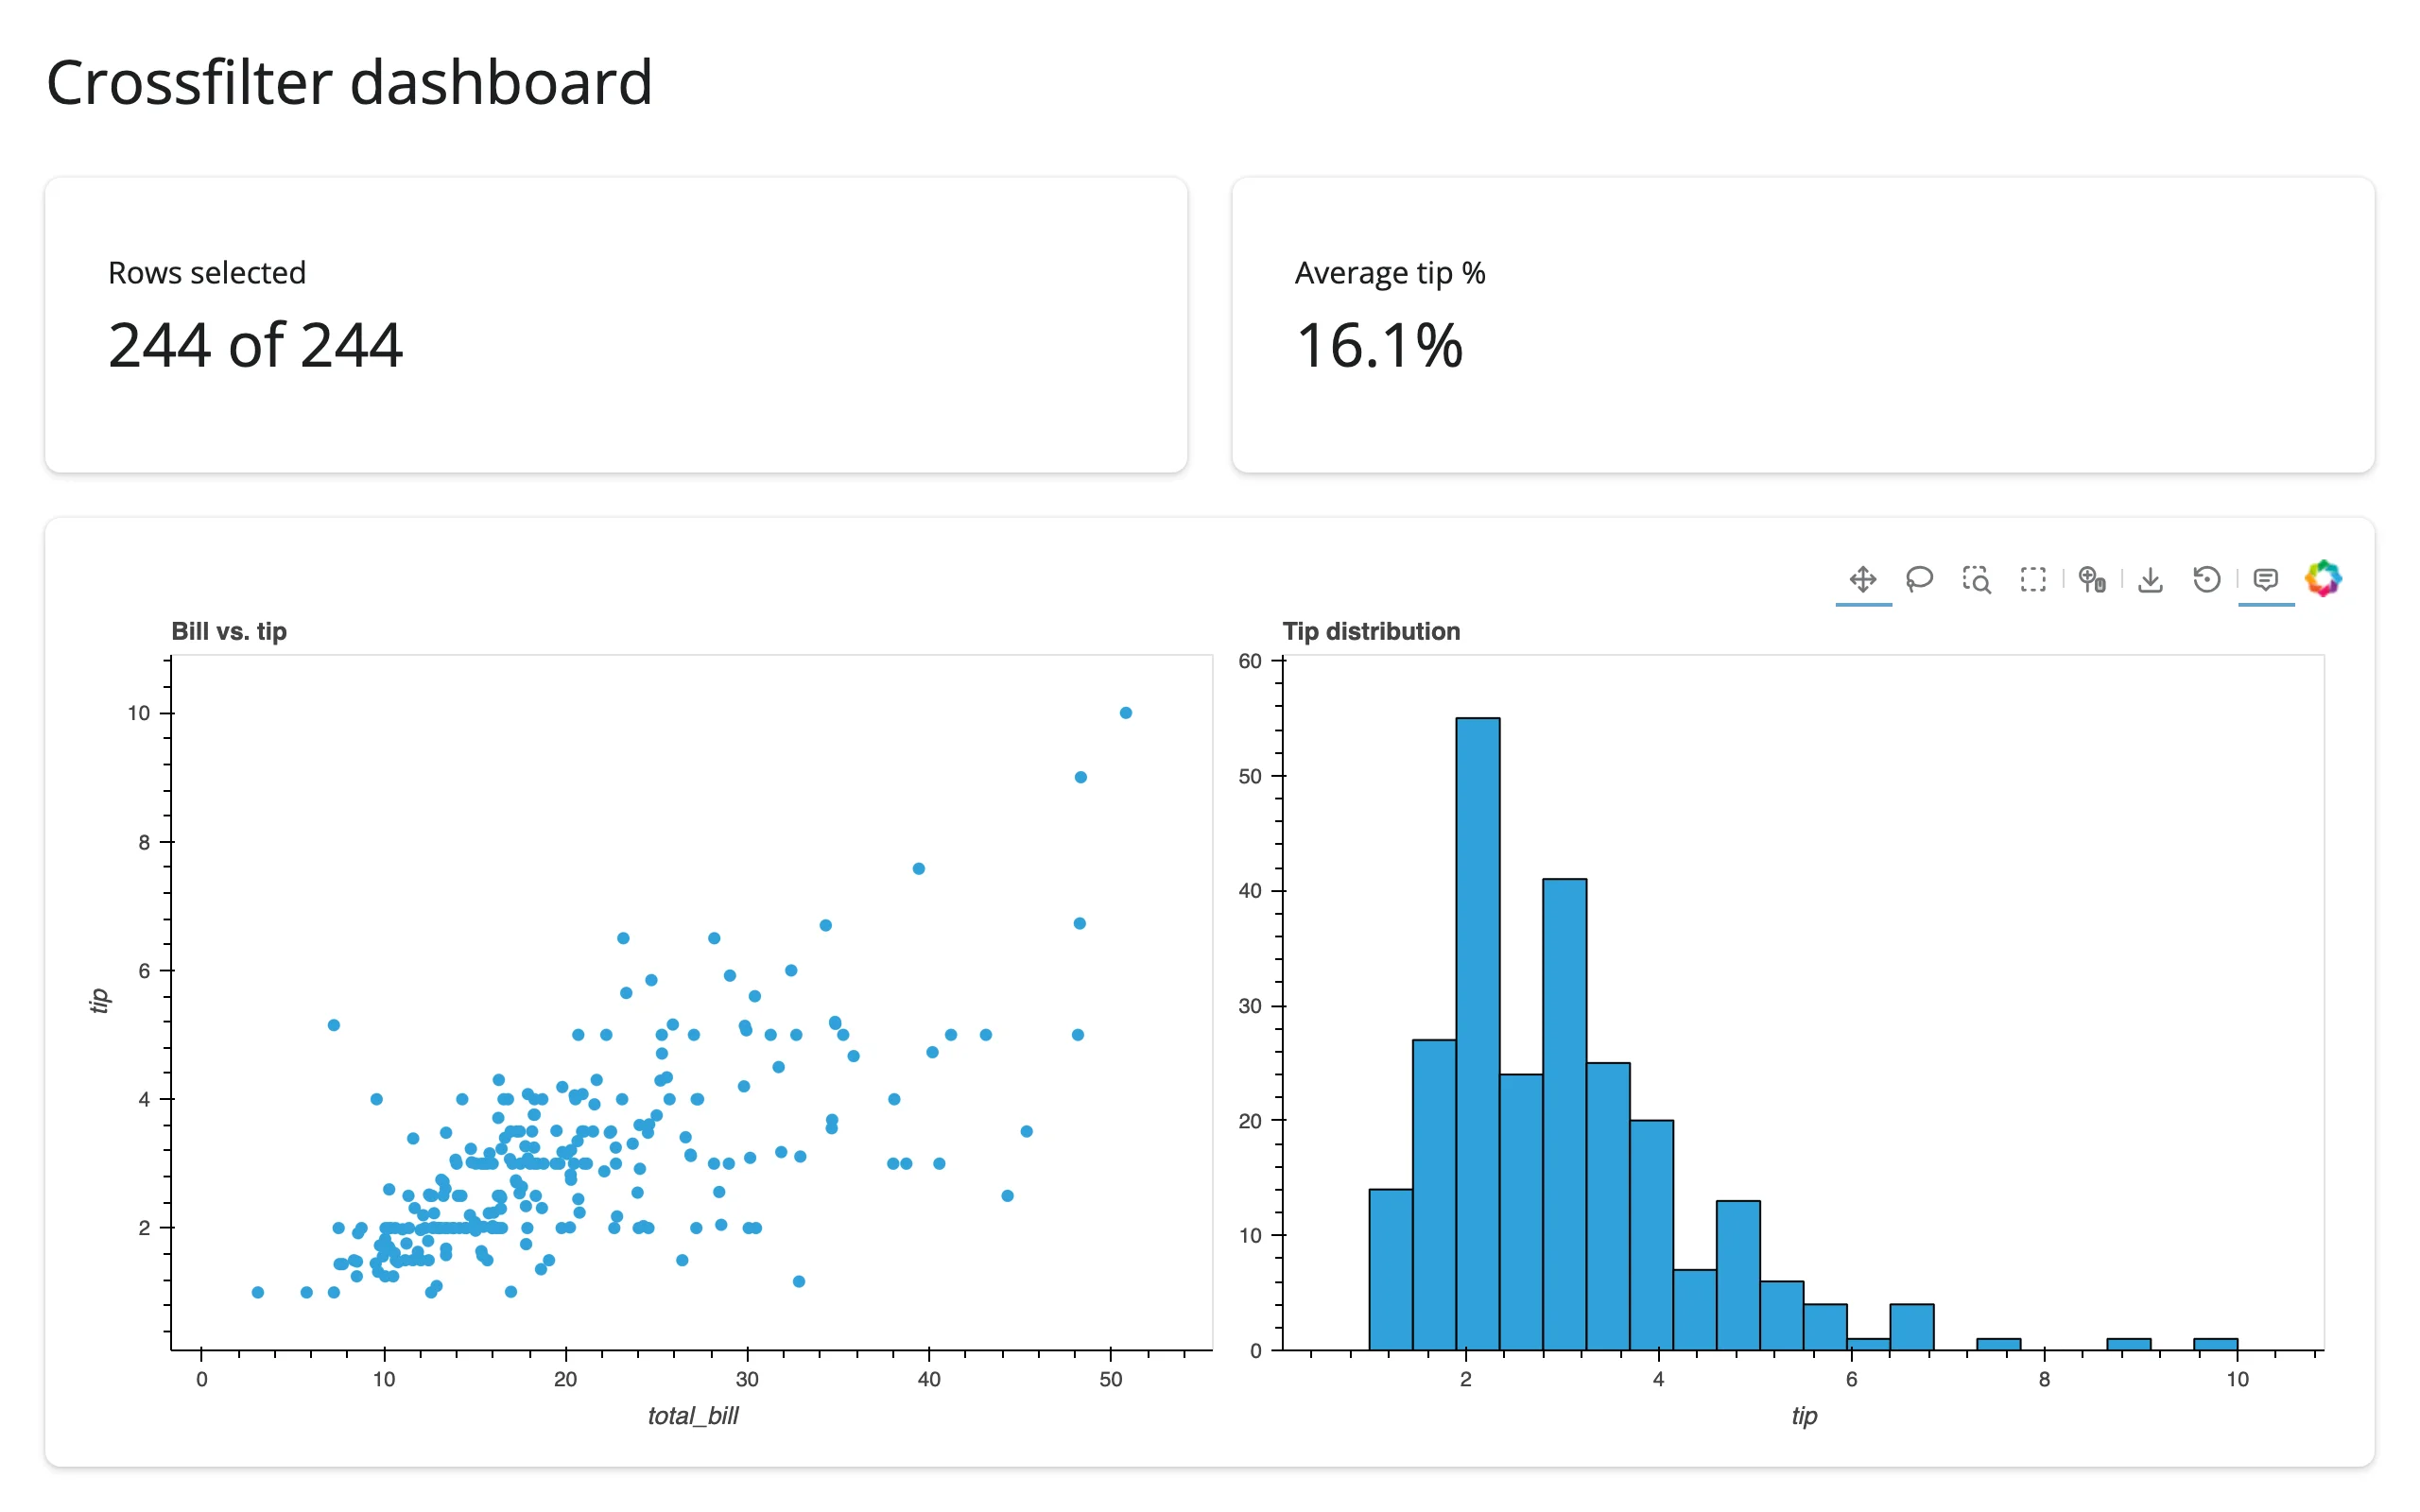
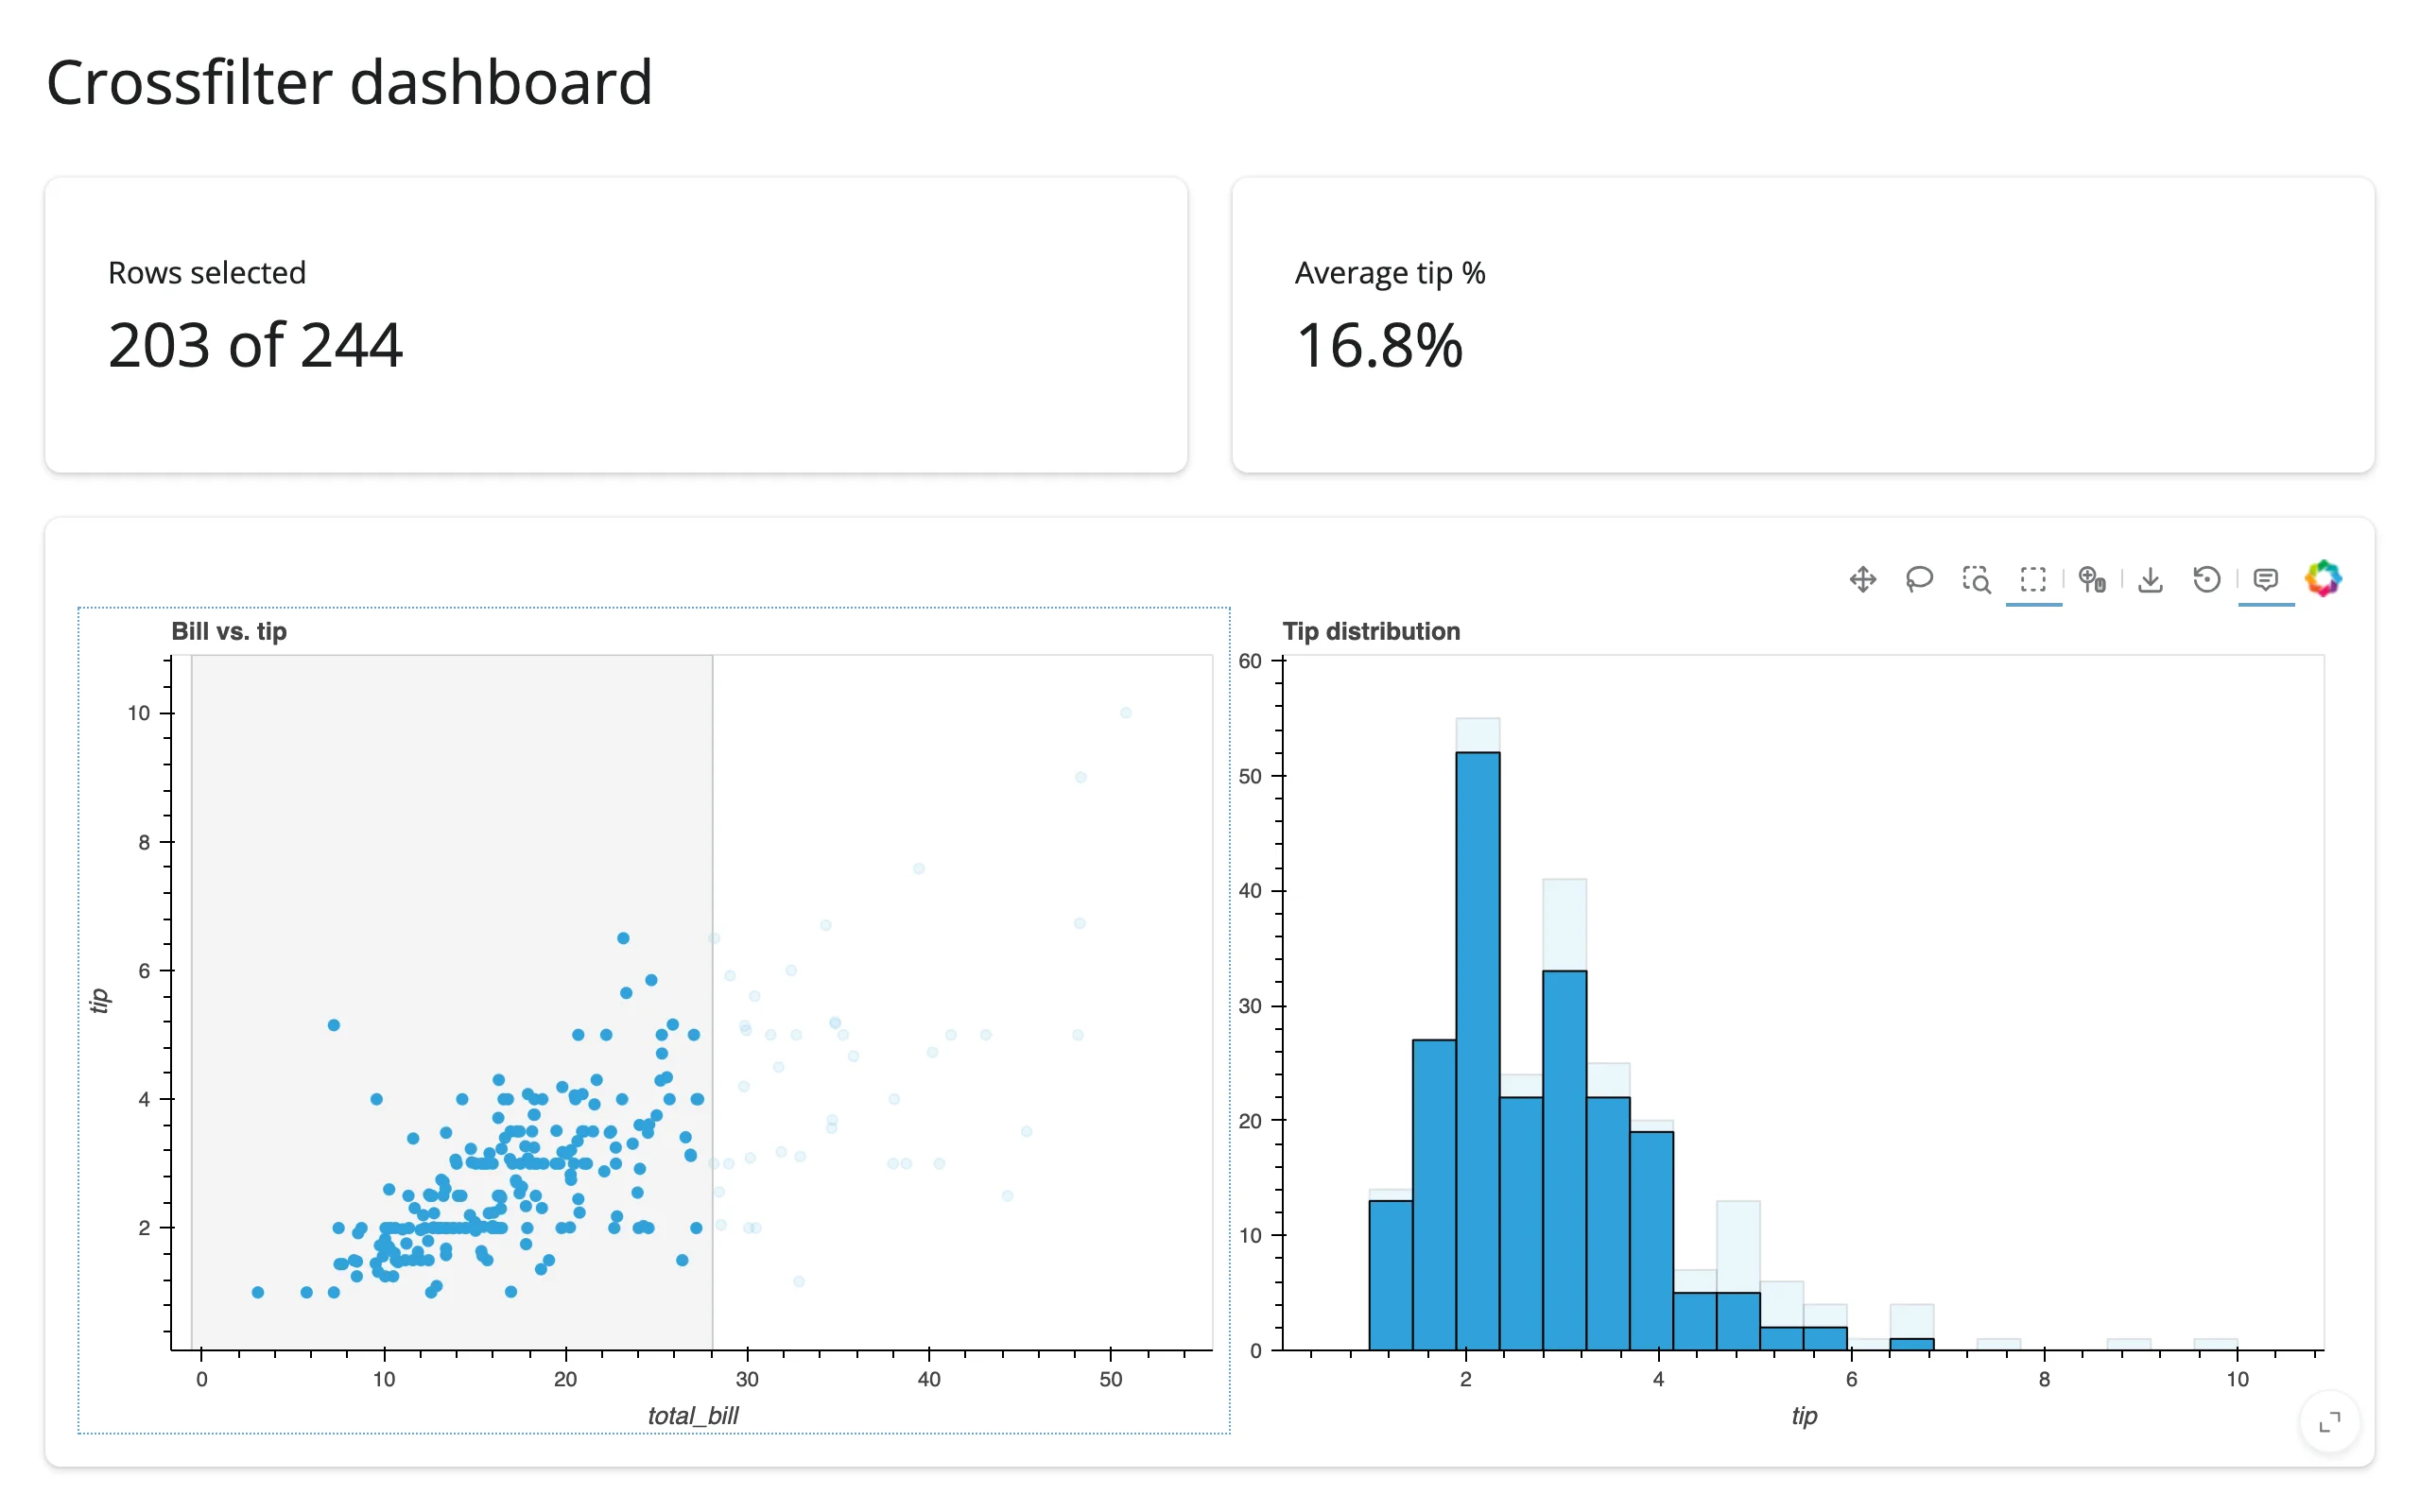
links.filter(df, selection_expr=expr) reproduces the selection as a pandas filter, so the same expr drives both the restyled plots (via link_selections itself) and any ordinary Shiny output that needs the matching rows.
Note: a composite Layout wrapped in link_selections defaults its drag tool to Pan, not Box Select, at any width – set .opts(active_tools=["box_select"]) on each element before combining them, as every crossfilter example in this guide does, so box-select is ready to use without an extra toolbar click. A ui.sidebar(), a narrow column, and a second, independent @render_holoviews output elsewhere on the page are all fine and don’t need to be avoided – see Gotchas and limitations.
Large data
HoloViews’ own large-data mode is Datashader: hvPlot’s rasterize=True, or HoloViews’ rasterize() operation (see Datashader and GeoViews above), bins millions of rows into a fixed-size image server-side through this same @render_holoviews decorator, so message size and render cost are set by screen resolution, not row count. See the Datashader guide’s own Large data section for the measured numbers. This is the “summarize on the server” approach from Large data & performance. Without rasterize(), a plain HoloViews/Bokeh element (a Scatter, a Points layer) has no scale story of its own beyond bokeh’s output_backend="webgl", which also applies here since HoloViews renders through Bokeh.
Layout and sizing
HoloViews and hvPlot elements are a fixed size by default – 300x300 for a bare HoloViews element, 700x300 for hvPlot – and get clipped by a smaller container rather than scaled down. Pass responsive=True (as an hvPlot kwarg, or .opts(responsive=True) for plain HoloViews) to make a plot fill its output instead; see examples/05_responsive_sizing.py:
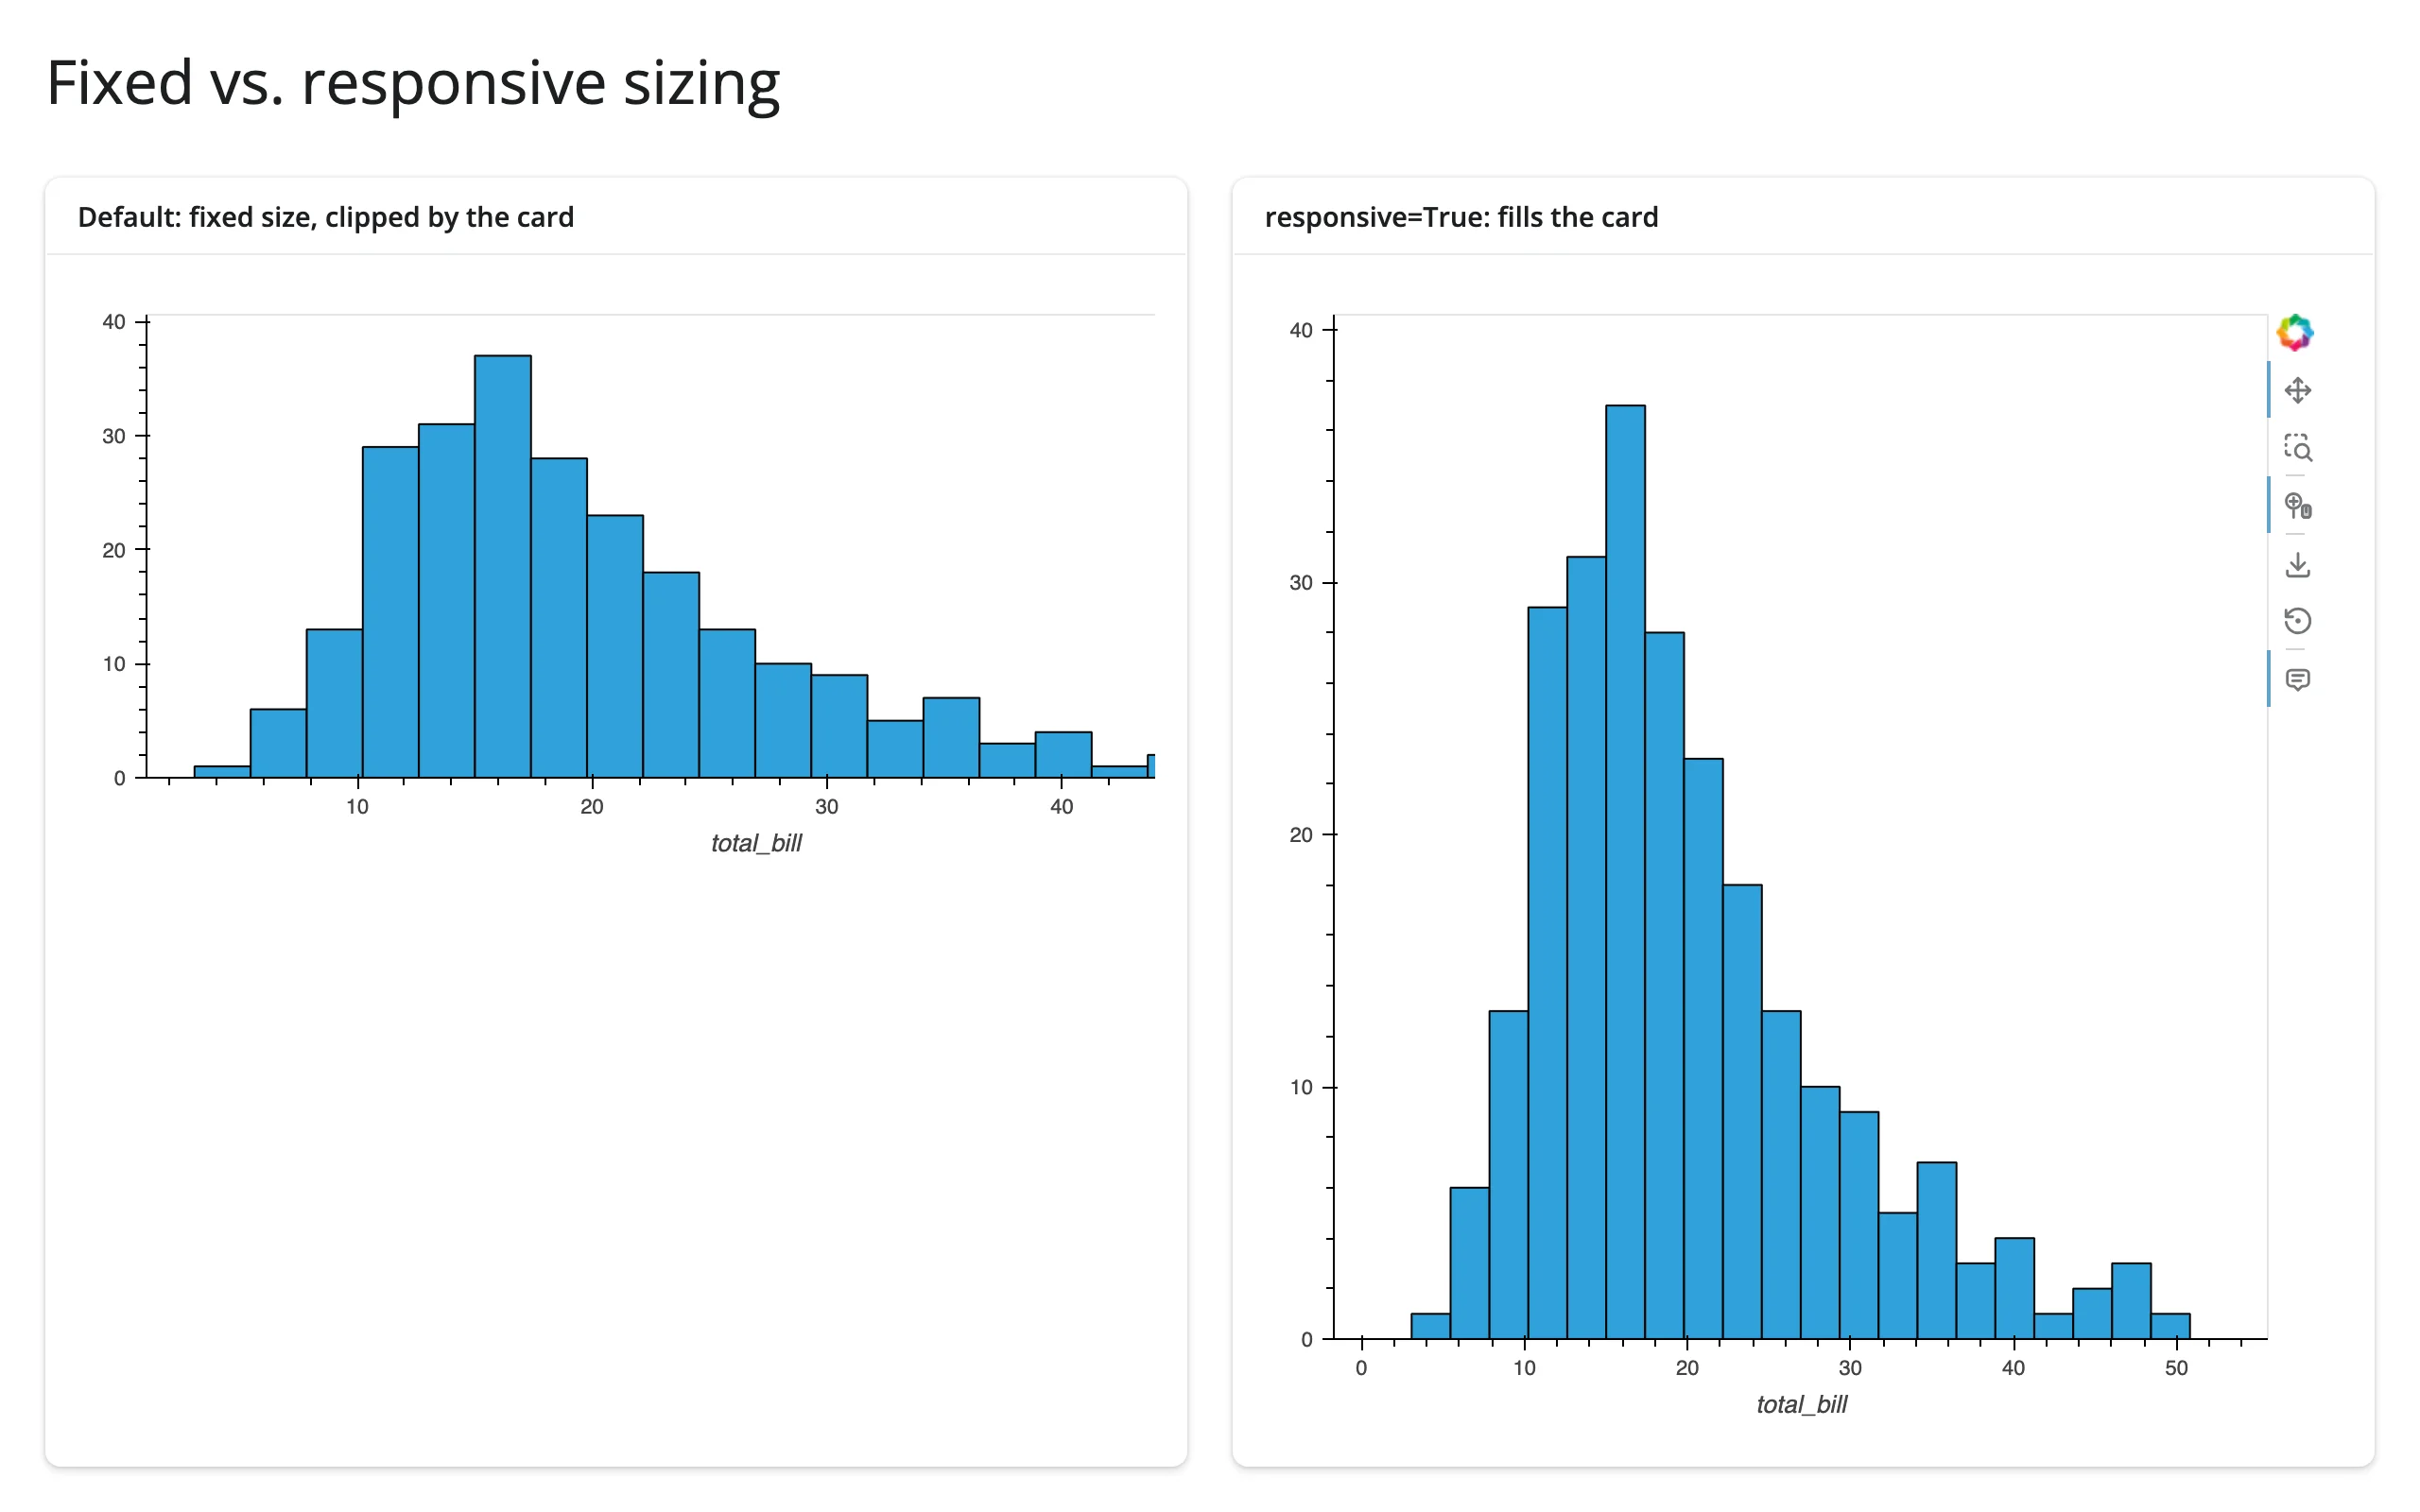
Giving the output an explicit height works as expected – @render_holoviews(height="300px") (or output_widget(id, height="300px") in Shiny Core) sizes a responsive plot to that height without needing fillable=True as well (verified on current main; an older report described a collapse-to-sliver bug here, which is fixed). full_screen=True on the enclosing ui.card() works the same as any other shinywidgets output.
Layouts (+) and overlays (*) made of responsive elements fill their container as a group; set .opts(shared_axes=False) if you don’t want HoloViews to link every subplot’s axes together (usually desired for a + of unrelated plots, usually not for a crossfilter).
Gotchas and limitations
Verified on current main (shiny 1.9.0, holoviews 1.23.2, hvplot 0.12.2, panel 1.10.0, bokeh 3.10.1, jupyter_bokeh 4.1.0).
- A composite
Layoutwrapped inlink_selectionsdefaults its drag tool to Pan, not Box Select – at any width. An earlier revision of this guide blamed this on narrow panels (a card squeezed below roughly 300px); a follow-up investigation found that was a test-methodology artifact (the repro’s Playwright drag never clicked the box-select toolbar icon first, unlike this guide’s own working examples, which do – see../investigations/narrow-canvas-and-subclass/INVESTIGATION.md). Panel width is not the variable. The real, width-independent fix: set.opts(active_tools=["box_select"])on each element before combining them withlinks(...), as every crossfilter example in this guide does, so box-select is the default drag tool from the first render – no toolbar click needed for a real interactive user. (A scripted/headless client that setsactive_toolsand then drags without ever having clicked the toolbar may still need one explicit click first to arm the gesture on a composite, multi-panelLayout– an upstream Bokeh/HoloViews quirk, not something a real user hits.) - A
Tapstream on an element that’s also wrapped bylink_selectionsreportedly never fires (unverified). An earlier revision reported the tap-select tool showing up in the toolbar but clicks doing nothing; a follow-up investigation downgraded the neighboringlink_selectionsbug reports to false positives but did not re-verify this one with the corrected methodology, so treat it as a plausible wiring quirk, not a confirmed bug. AttachingTap(or any stream you need alongside crossfiltering) to a separate, unlinked plot – asexamples/08_tap_detail.pyand the showcase gallery app do – avoids it either way. hv.streams.RangeXYwith a non-idempotent subscriber caused an infinite re-render loop on older shinywidgets versions – fixed in shinywidgets, but the idempotent pattern is still the right recipe.RangeXYfires on mount (with the default range) and again on every zoom/pan. The mount-time fire happens synchronously inside the render: holoviews’get_plot()callsStream.trigger()while shinywidgets is coercing the element into a widget, so the subscriber runs mid-render. On older versions, the subscriber’s reactive read (e.g.count()incount.set(count() + 1)) registered the in-progress render as a dependent, and its write invalidated that render – looping forever, visible as a flood ofRuntimeError: BokehModel was closedfrom a single page load with zero user interaction. shinywidgets now runs widget coercion underreactive.isolate(), so such callbacks can no longer hijack the render’s dependencies (verified: one render, no errors, plus a unit regression test). Still, prefer storing the stream’s actual value (e.g.,range_val.set((x_range, y_range))):reactive.Value.set()already skips invalidation when the new value equals the old one, and a counter subscriber is a pointless invalidation storm on every zoom/pan. See Continuous streams:RangeXYneeds an idempotent subscriber for the recommended pattern;BoundsXYandTapdon’t need this care since they only fire on a real user gesture, never on mount.- hvPlot silently drops
active_tools=passed as a plotting kwarg.df.hvplot.scatter(..., active_tools=["box_select"])adds nothing – pan stays the default drag tool. Chain.opts(active_tools=["box_select"])after the hvPlot call instead, and make sure the tool itself is present (tools=["box_select"]as an hvPlot kwarg, or rely onlink_selectionsto add it automatically, which it does for every plot it wraps). - A box-select on a
link_selections-wrapped multi-panel layout logs a harmless exception. After a successful drag (the selection and every downstream output are correct), the server log shows one or morebokeh.core.serialization.UnknownReferenceError: can't resolve referencetracebacks fromBokehModel._sync_model. This doesn’t affect correctness in any verified case – just log noise from what looks like a duplicate or late property-change message. Not seen with a single, unlinked plot (e.g., the box-select table recipe). - Pure HoloViews needs
hv.extension("bokeh")before.opts(). Skipping it (when you aren’t also importinghvplot.pandas, which registers the extension as a side effect) raisesValueError: No plotting extension is currently loadedin the output. Harmless to call even when hvPlot already registered it. - Build streams and
link_selectionsper session. A module-level instance in a Shiny Core app is shared by every visitor, so one person’s selection becomes visible to everyone (this follows directly from normal Shiny Core semantics – any shared mutable object at the top level of a Core app has this problem, not something specific to HoloViews). In Express, top-level code already runs per session, so this isn’t a trap there. - Offline rendering needs
jupyter_bokeh>=4.1, which theshinywidgets[holoviews]extra already requires – olderjupyter_bokehfalls back to a CDN for its widget JS and renders blank with no network. Not an issue if you installed via the extra.
Gallery candidates
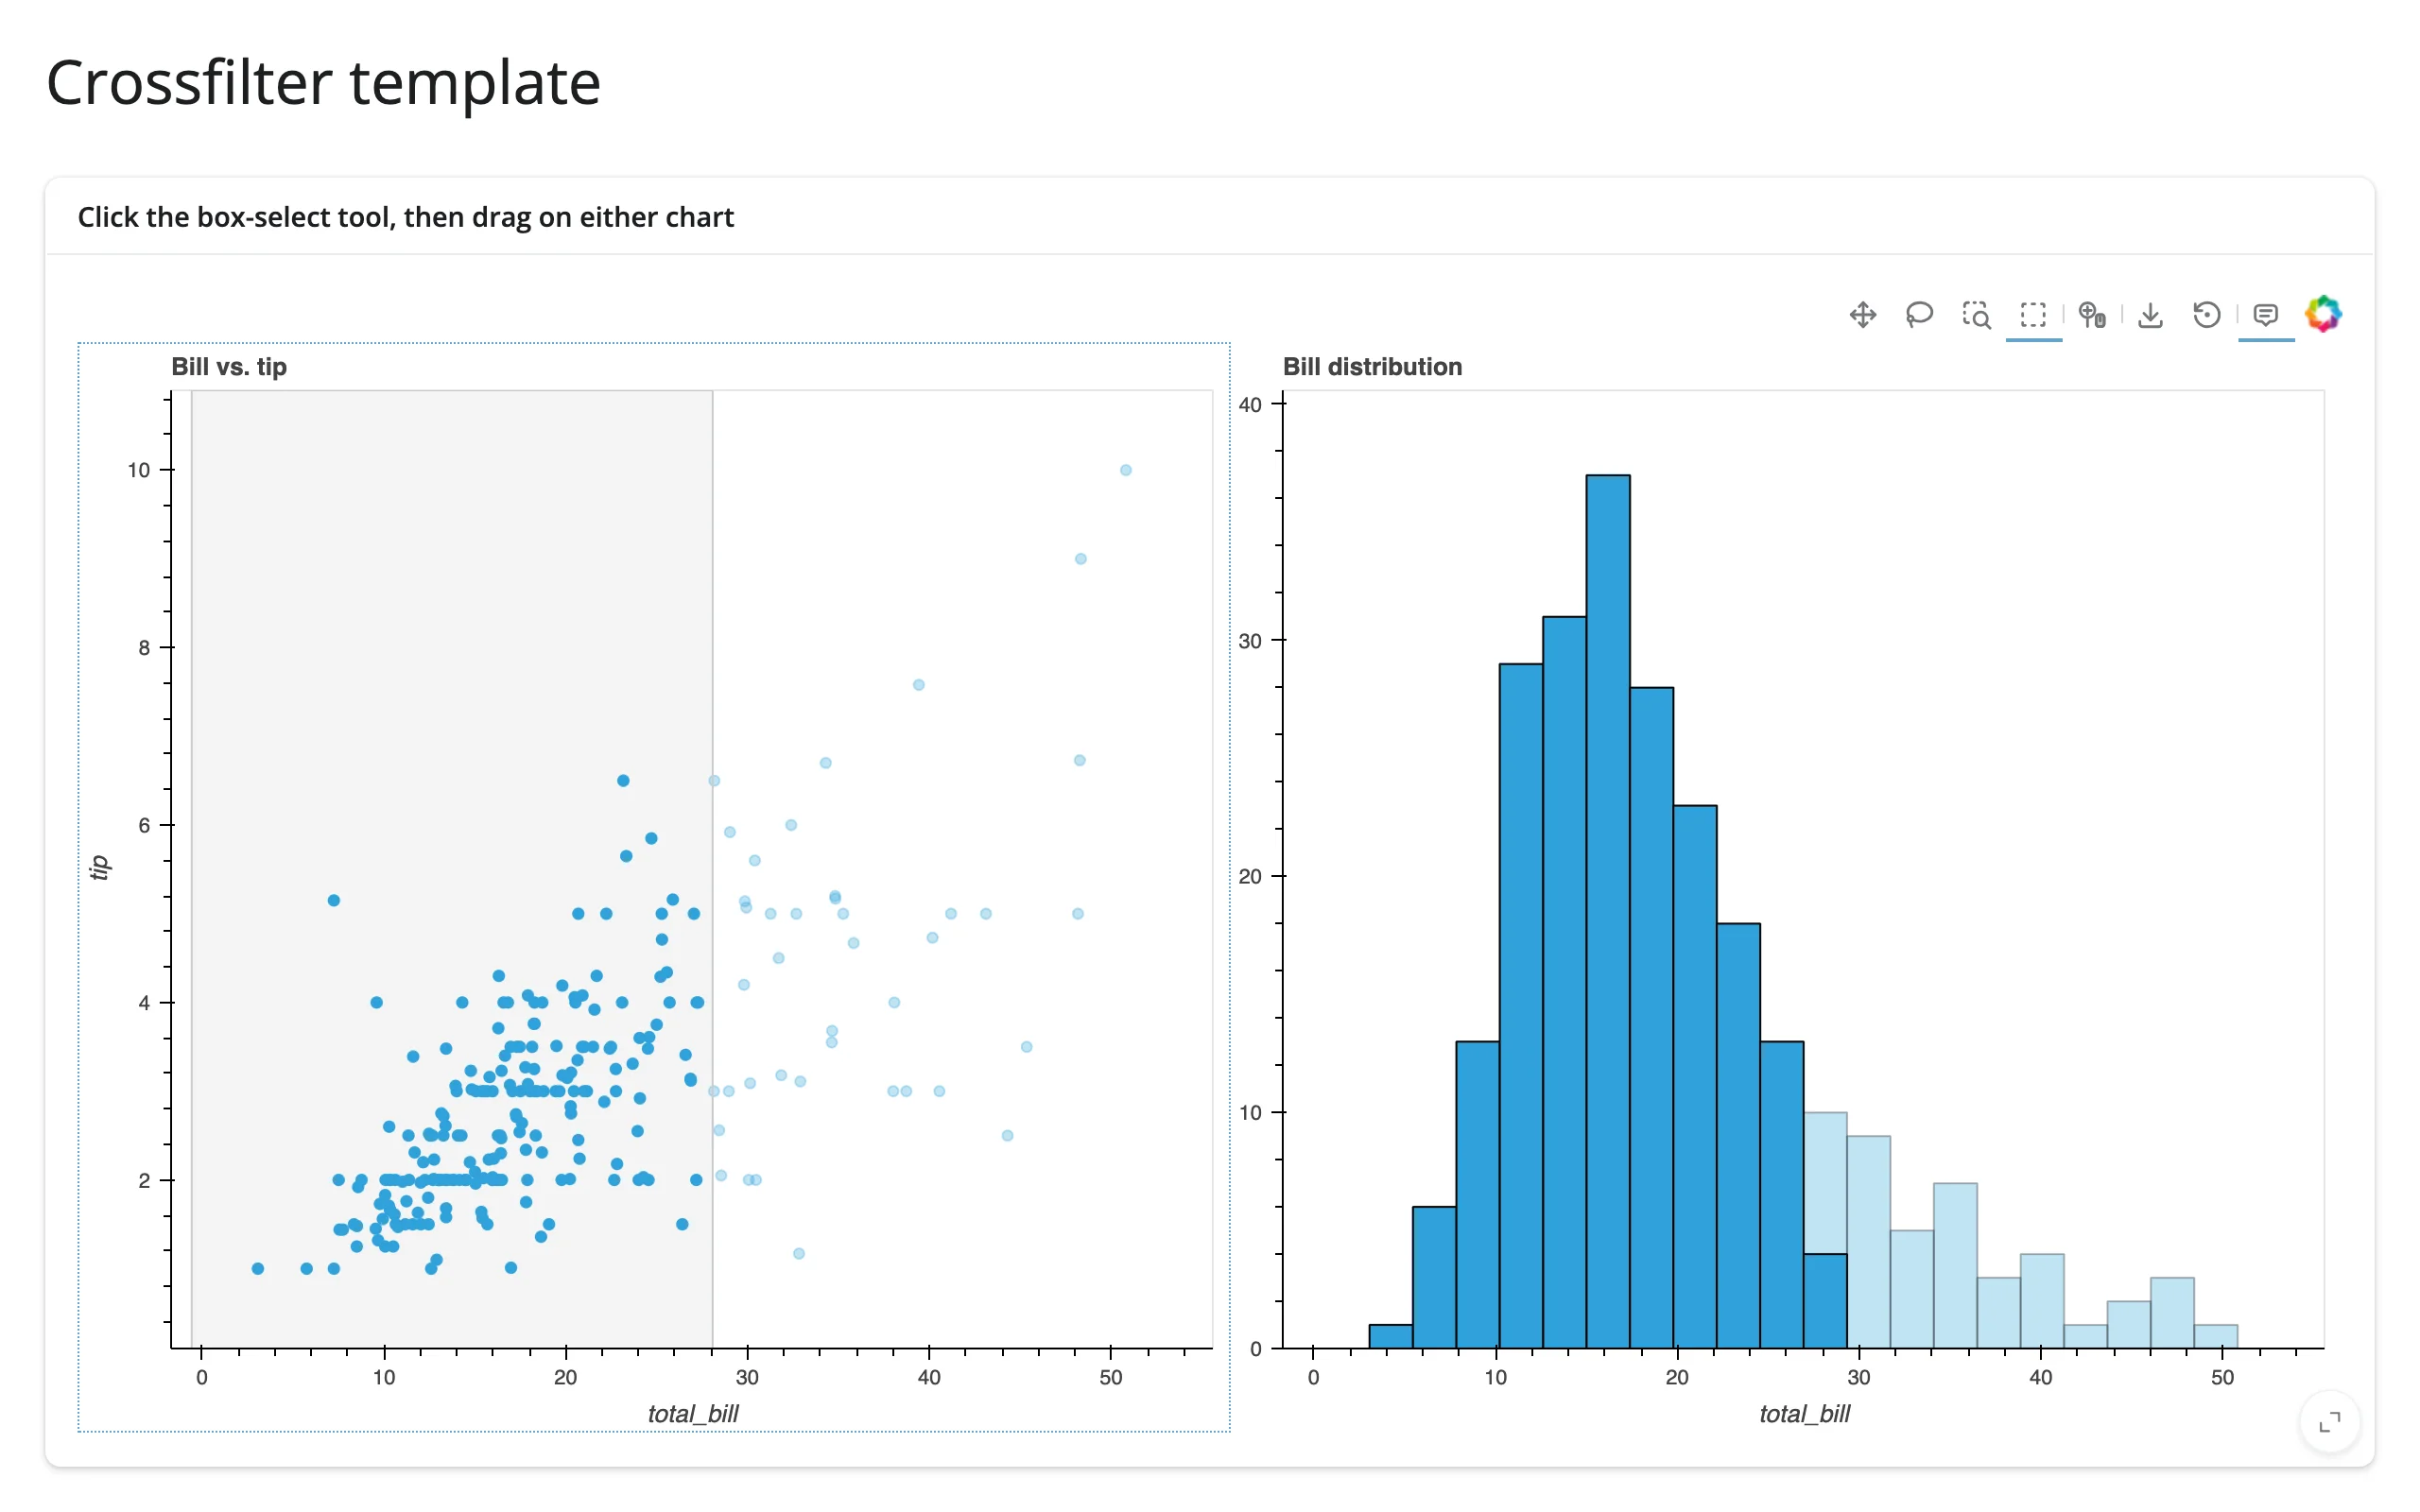
gallery/template_crossfilter.py (template)
A minimal, adaptable two-plot crossfilter starter – the smallest version of the link_selections pattern, ready to drop your own data and plots into.
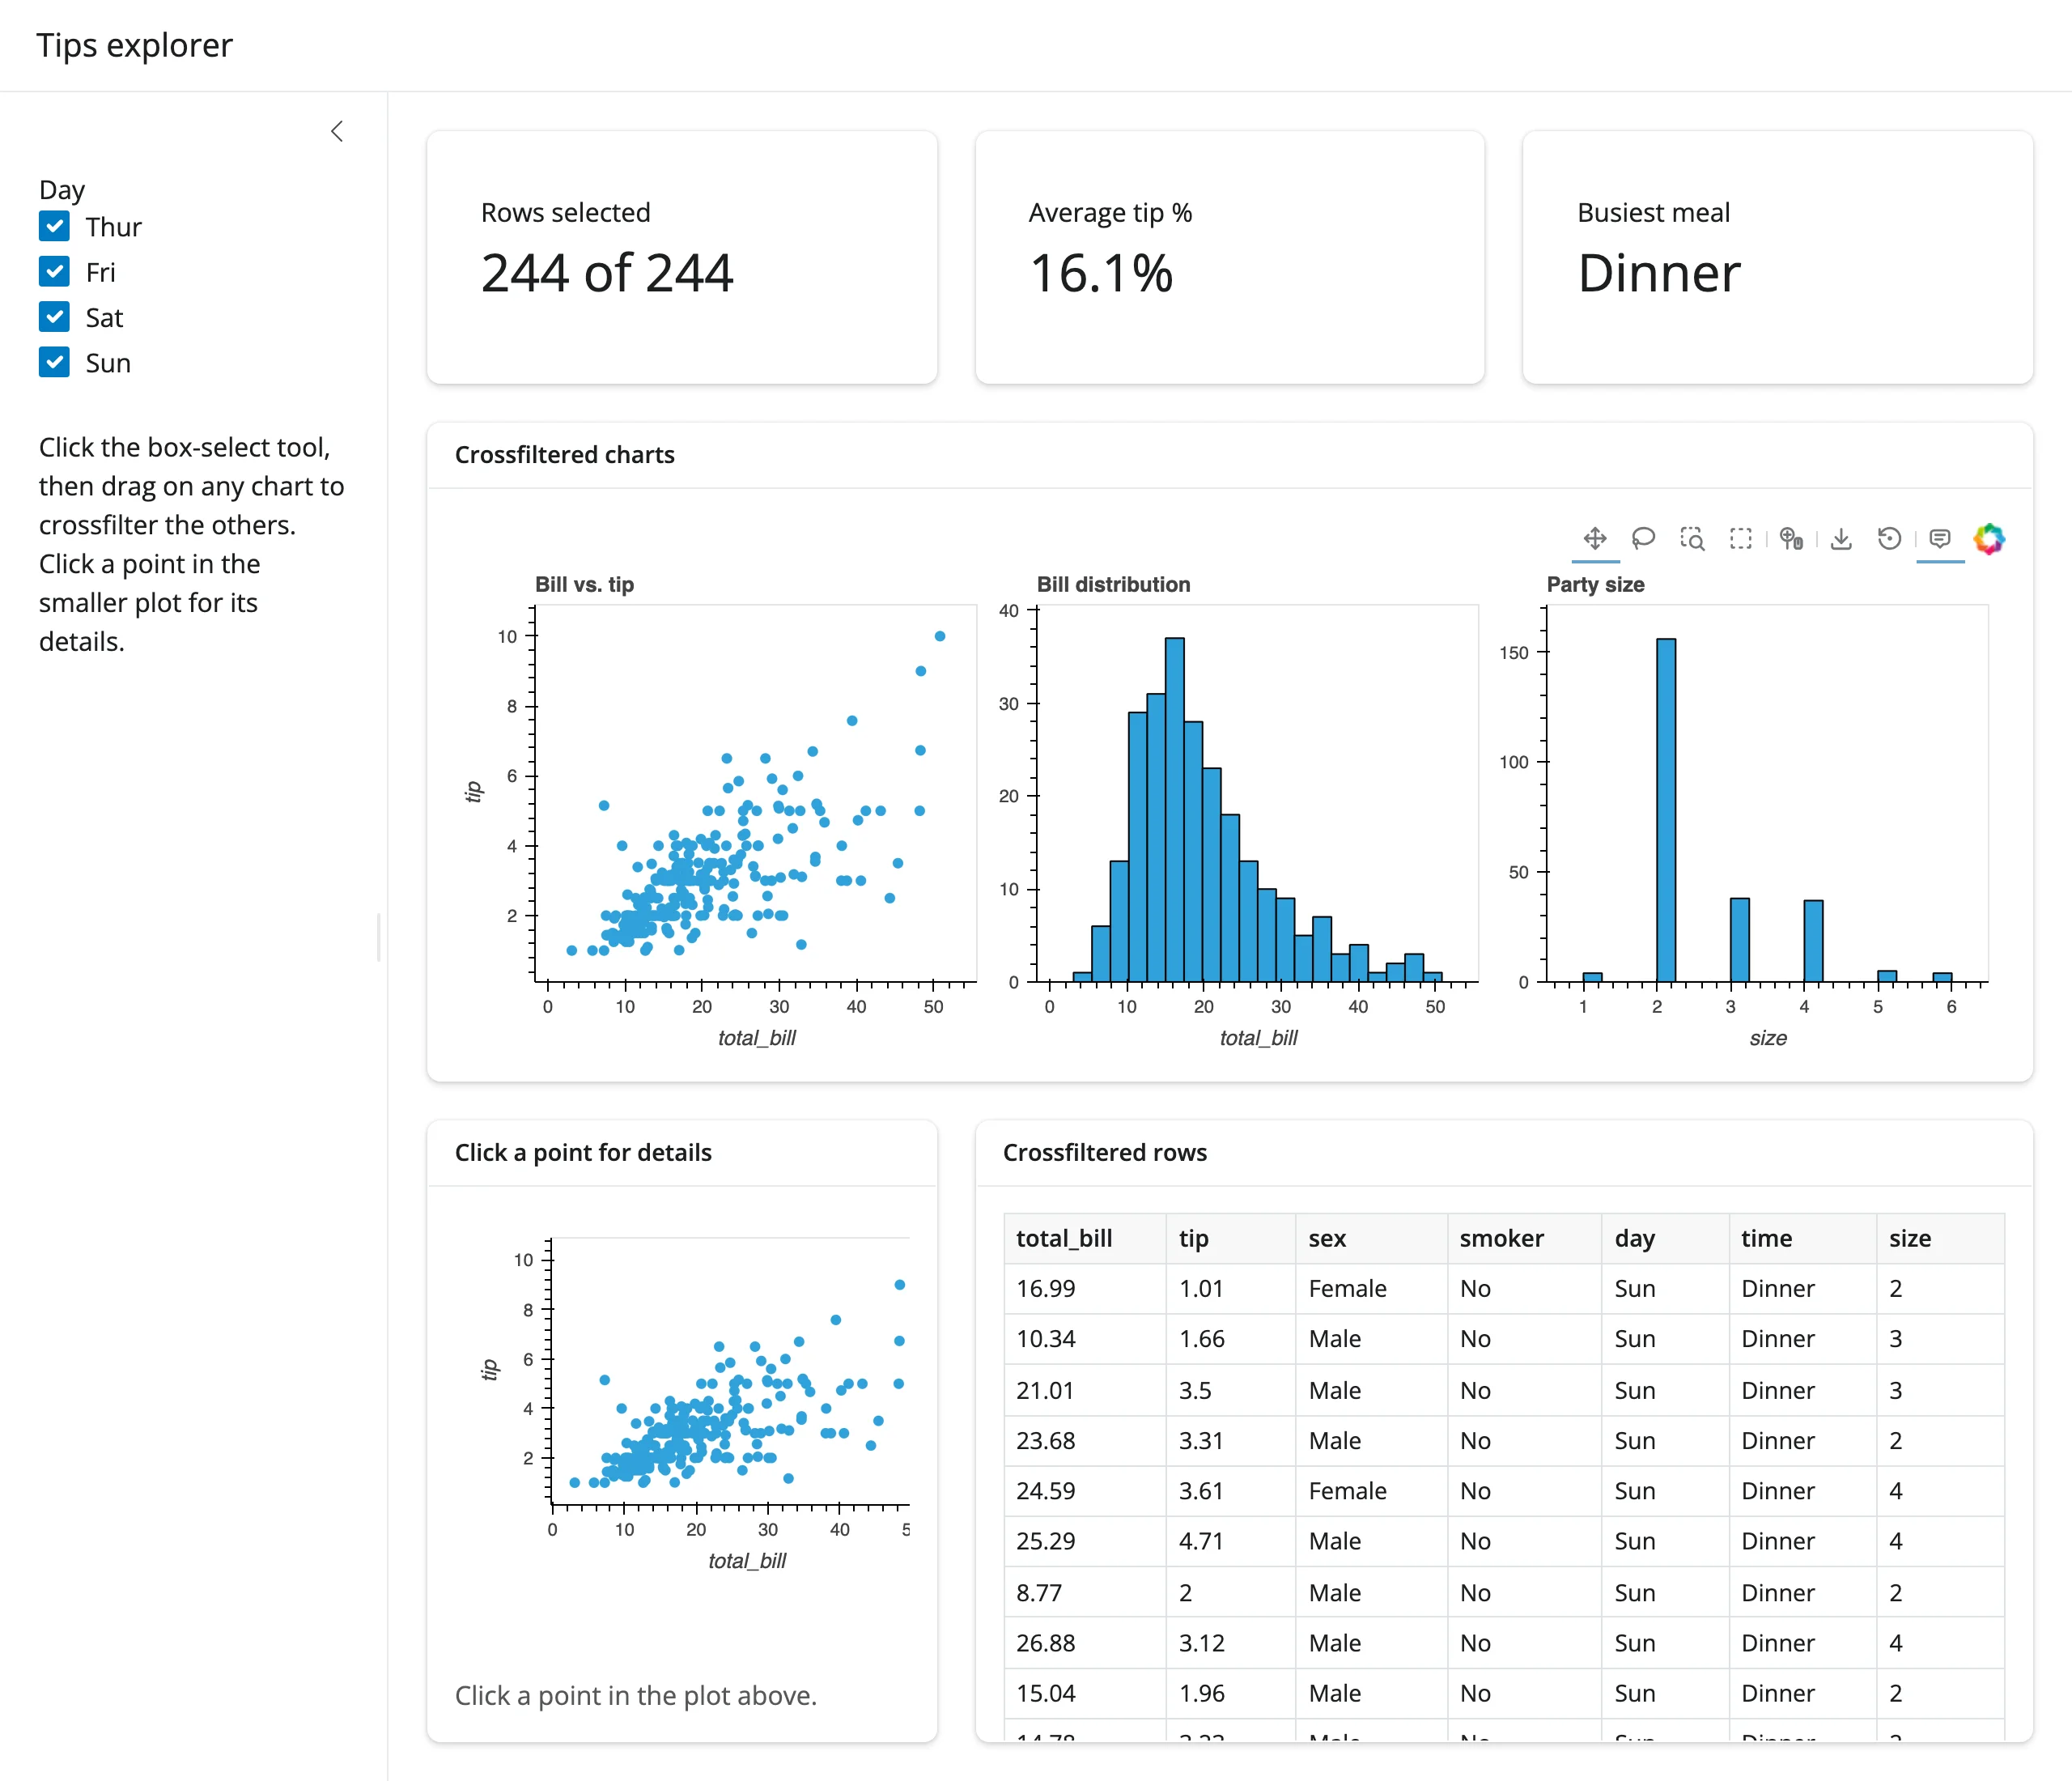
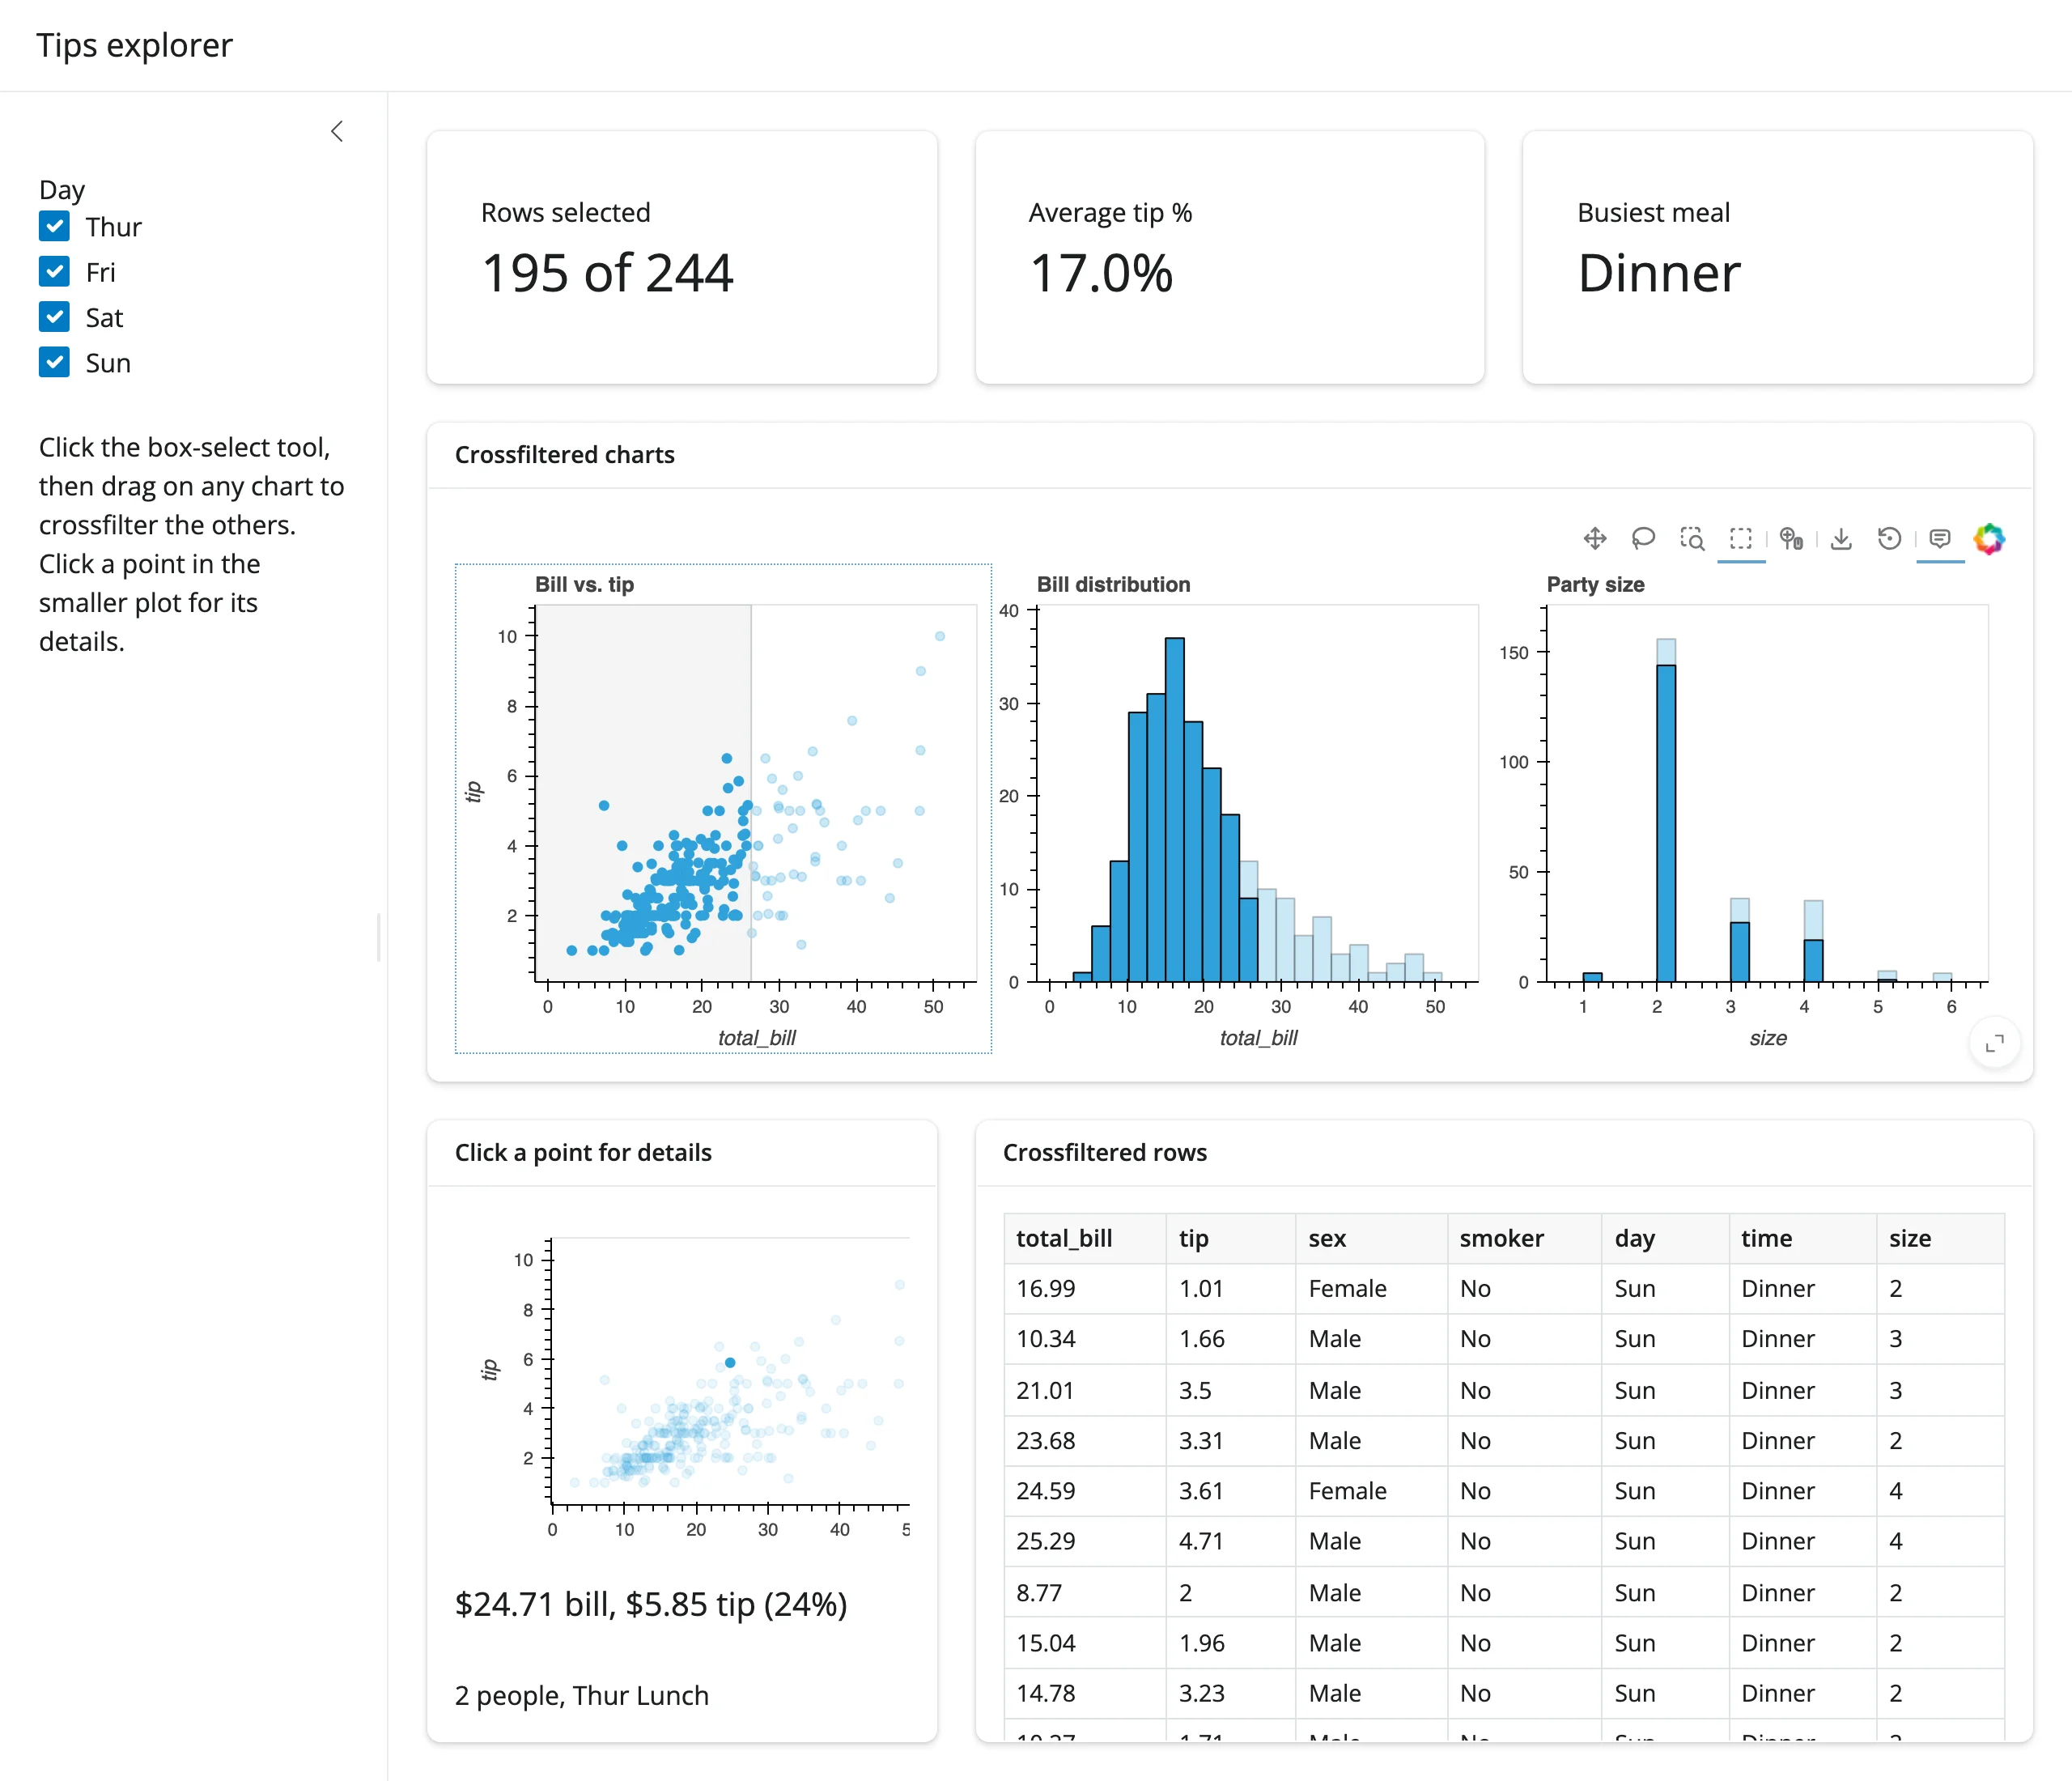
gallery/showcase_tips_explorer.py (showcase)
A fuller dashboard: a sidebar with a day-of-week filter, three linked charts (scatter plus two histograms) crossfiltered with link_selections at full row width, a separate click-for-detail plot, and a data table – the value boxes and table both driven by the same selection.
Learn more
- HoloViews documentation – element types, containers, streams, operations
- hvPlot documentation – the
.hvplotaccessor API - Linked Brushing /
link_selectionsuser guide - Custom Interactivity (streams) user guide
- Related guides in this roster: bokeh, panel, datashader, geoviews