Molecule grid explorer
Scientific
A searchable molecule grid plus a reactive readout of the checkbox selection, as a DataFrame.
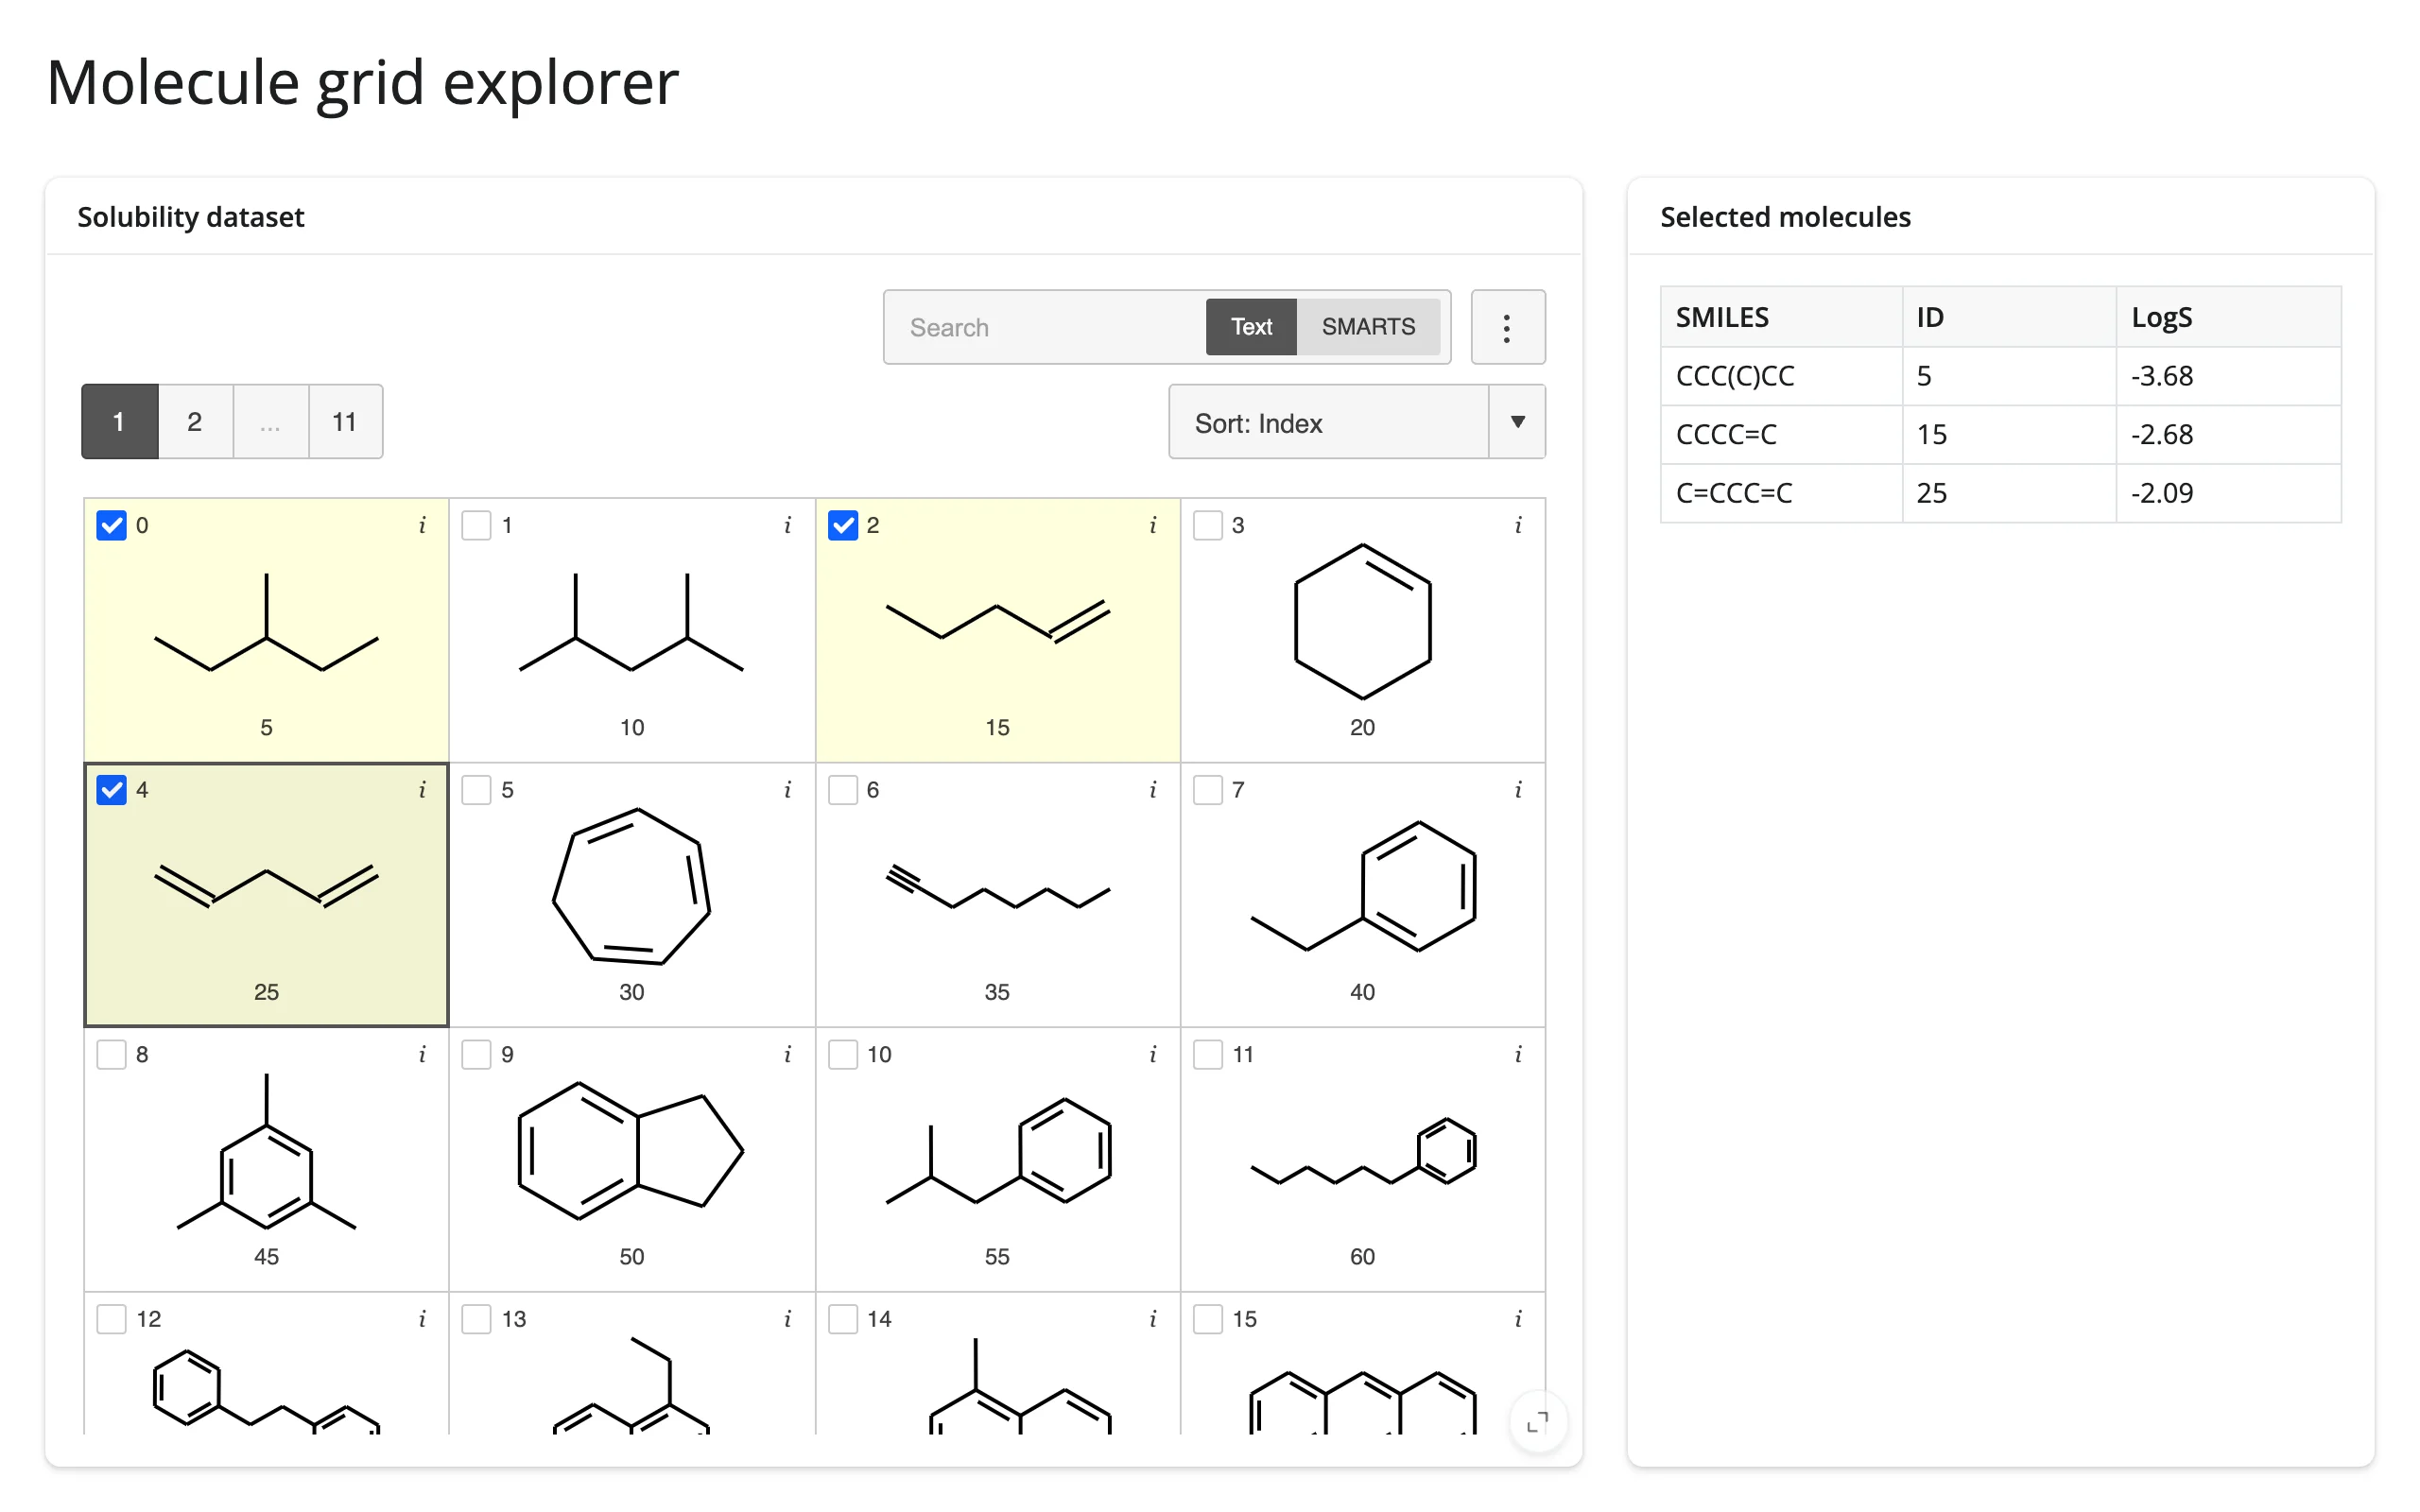
A mols2grid grid of chemical structures with per-cell checkboxes, paired with a render.data_frame table that reflects the current selection – the basic shape for any “browse structures, keep a worklist” cheminformatics app.
Run it
git clone --depth 1 https://github.com/posit-dev/py-shinywidgets
cd py-shinywidgets/website/gallery/templates/mols2grid-grid-explorer
uv run shiny run app.py
Source: app.py · Open in Shinylive
Try it
- Check a few molecule cards (click the card or its checkbox).
- Watch the “Selected molecules” table on the right fill with the SMILES/ID/LogS of exactly the checked structures.
- Use the Search box (Text or SMARTS mode) to narrow the grid, then check from the filtered set.
Accessors demonstrated
grid.selected()– a dict mapping row index (as a string key) to SMILES, for every currently checked structure. Empty dict when nothing is checked.
What to change for your own data
- Swap
MOLSfor your own DataFrame; it needs aSMILEScolumn (mols2grid derives the structure images from it). subset=andtooltip=control which columns show on the card face vs. on hover.
Known limitation
rate_policy/rate_delay have no effect on grid.selected() or grid.clicked(): neither accessor declares a default rate policy, and reactive_read’s own rate limit applies to the composite Box, not the inner .grid.widget. See docs/widget-guides/mols2grid/NOTES.md.