Table as input
Tables & grids
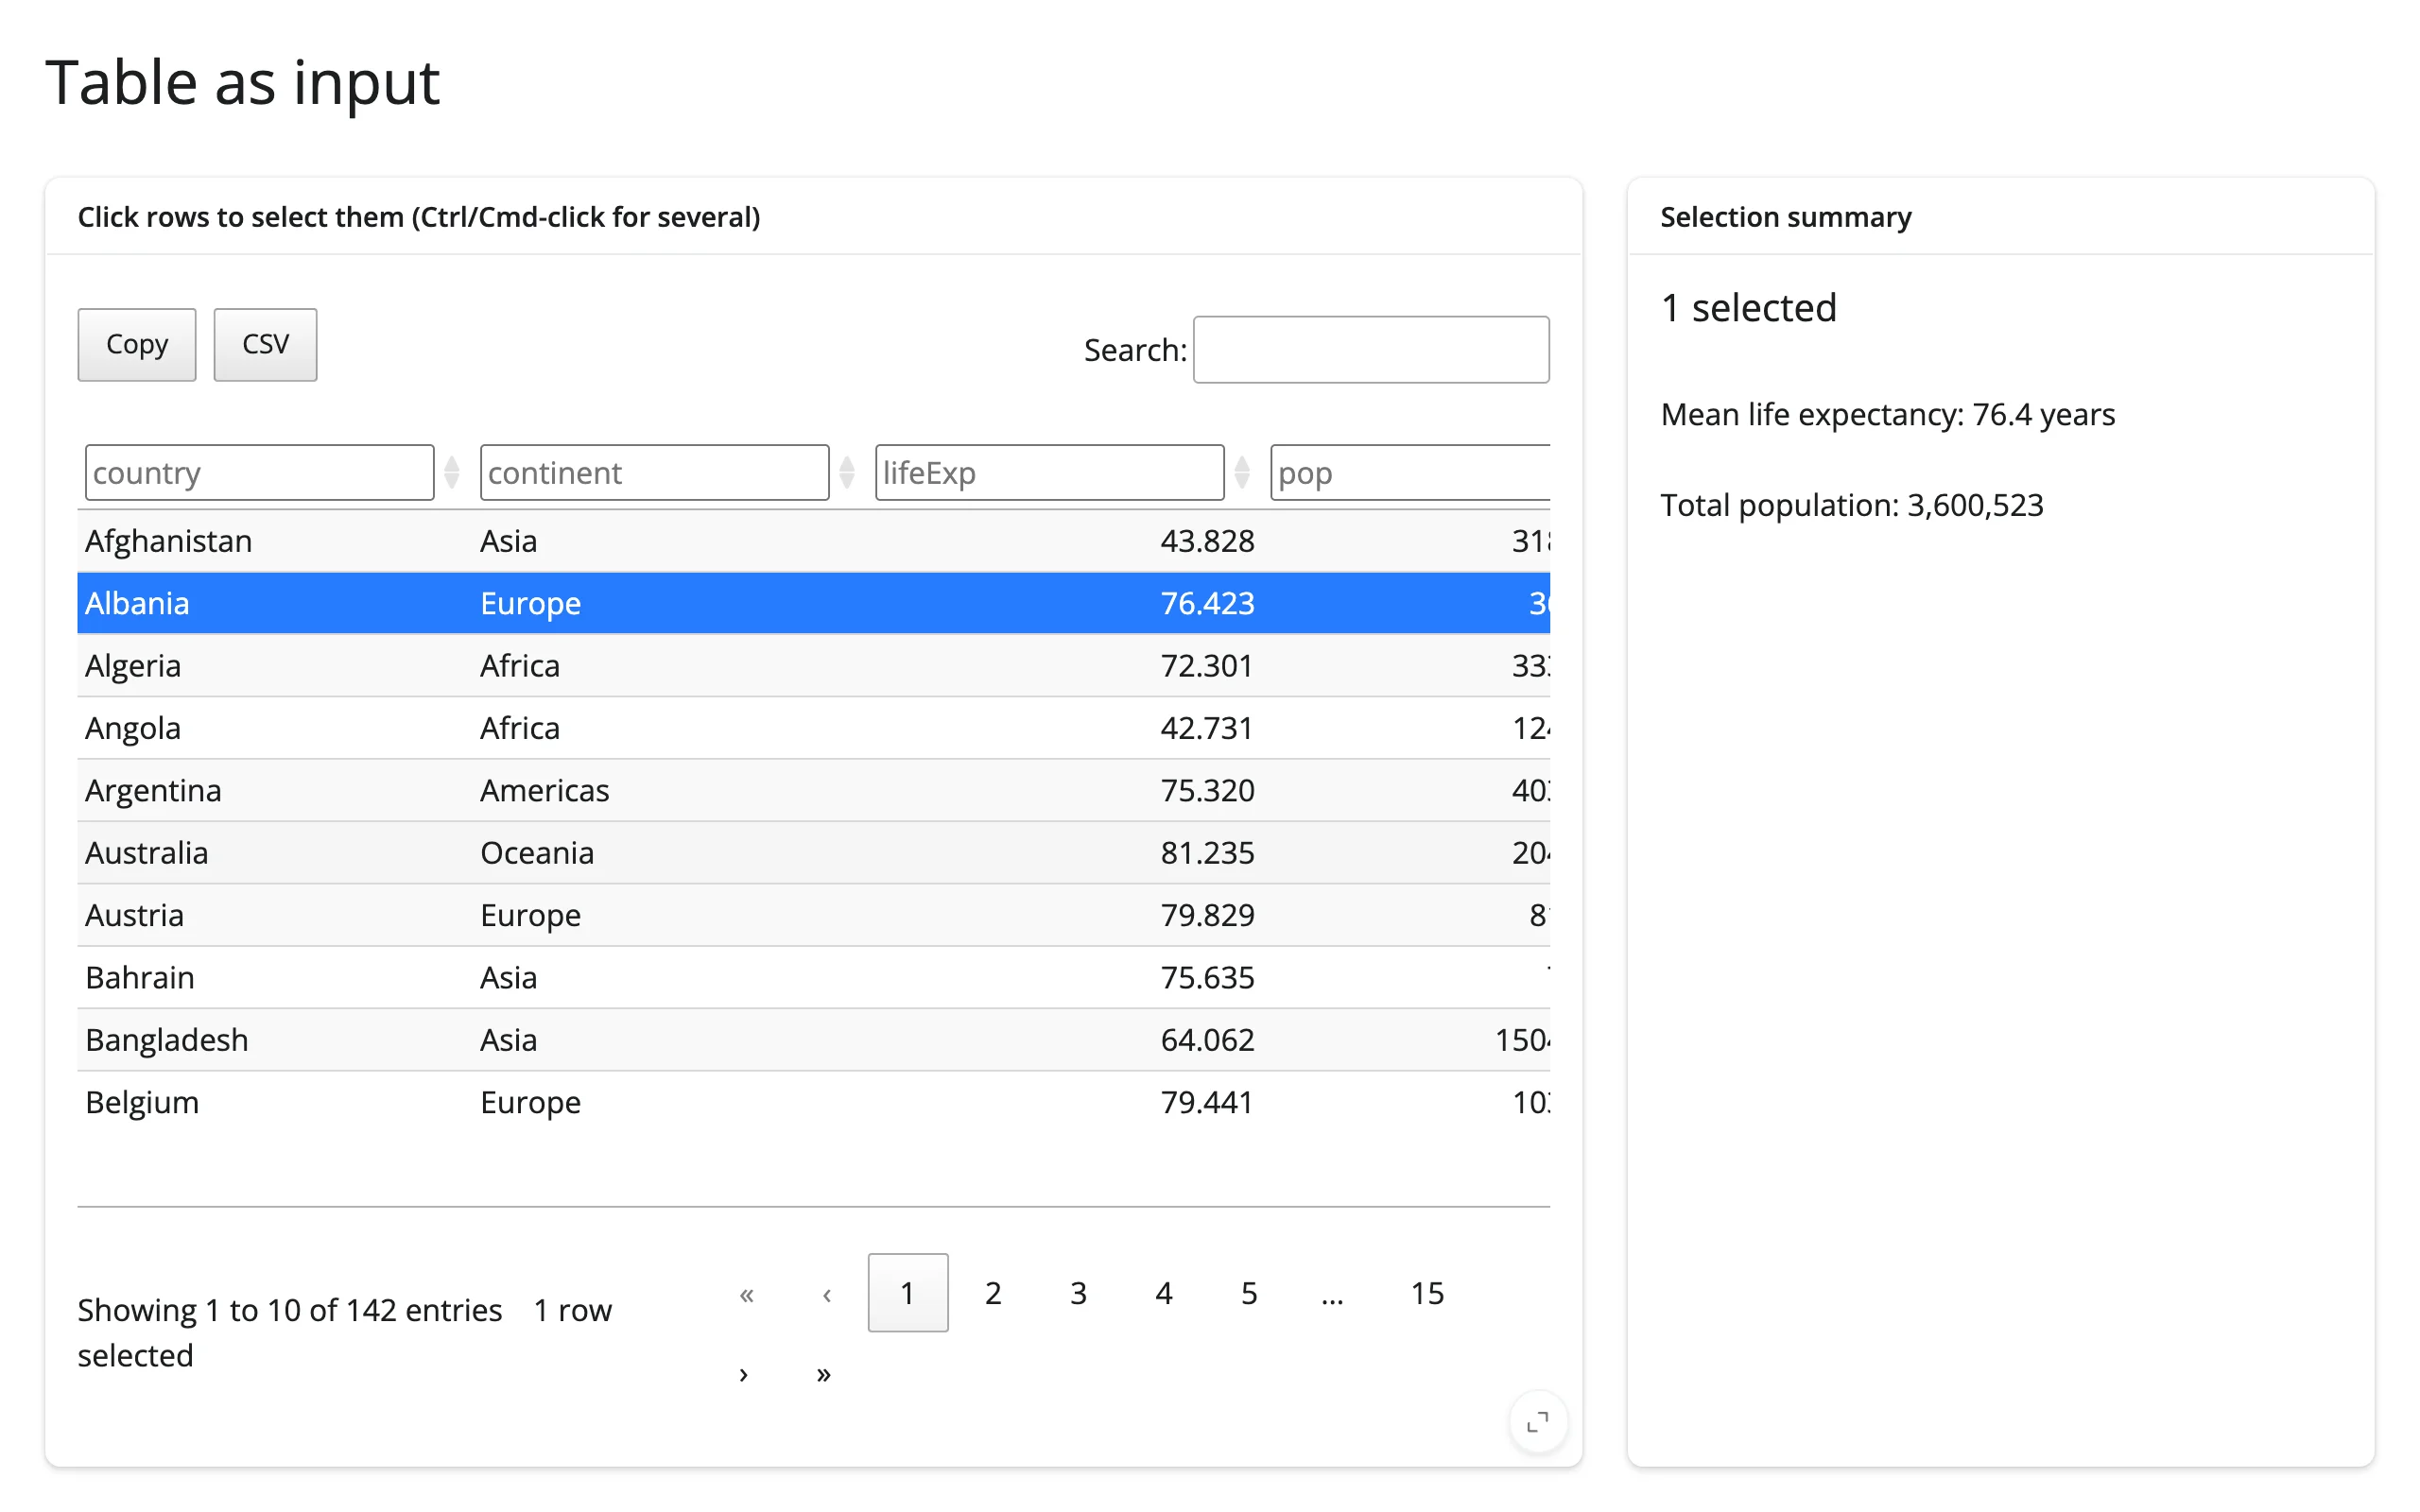
A searchable, sortable, exportable table whose row selection drives a summary panel.
The simplest version of “selection drives a downstream view”: one itables table with select=True, and a summary panel that recomputes from whichever rows are selected (or the whole table when nothing is selected).
Run it
git clone --depth 1 https://github.com/posit-dev/py-shinywidgets
cd py-shinywidgets/website/gallery/templates/itables-table-as-input
uv run shiny run app.py
Source: app.py · Open in Shinylive
Try it
- Click a row to select it; Ctrl/Cmd-click (or Shift-click) to extend the selection.
- Watch the summary panel’s mean life expectancy and total population recompute.
- Use the search box or column filters to narrow the table, then select from the filtered set.
- Try the Copy/CSV export buttons on the selected rows.
Accessors demonstrated
table.selected_rows()– a list of the currently selected row positions (not labels). Empty list when nothing is selected.
What to change for your own data
- Swap
countriesfor your own DataFrame. - Replace the two
ui.p(...)stats insummary()with whatever your selection should drive: a plot, a model re-fit, a download handler, and so on. buttons=["copyHtml5", "csvHtml5"]andcolumn_filters="header"are itables conveniences; drop either if you don’t need them.