Data file explorer
Charts
Input & drawing
Tables & grids
Pick a CSV from a sandboxed data directory and preview it as a table and a plot.
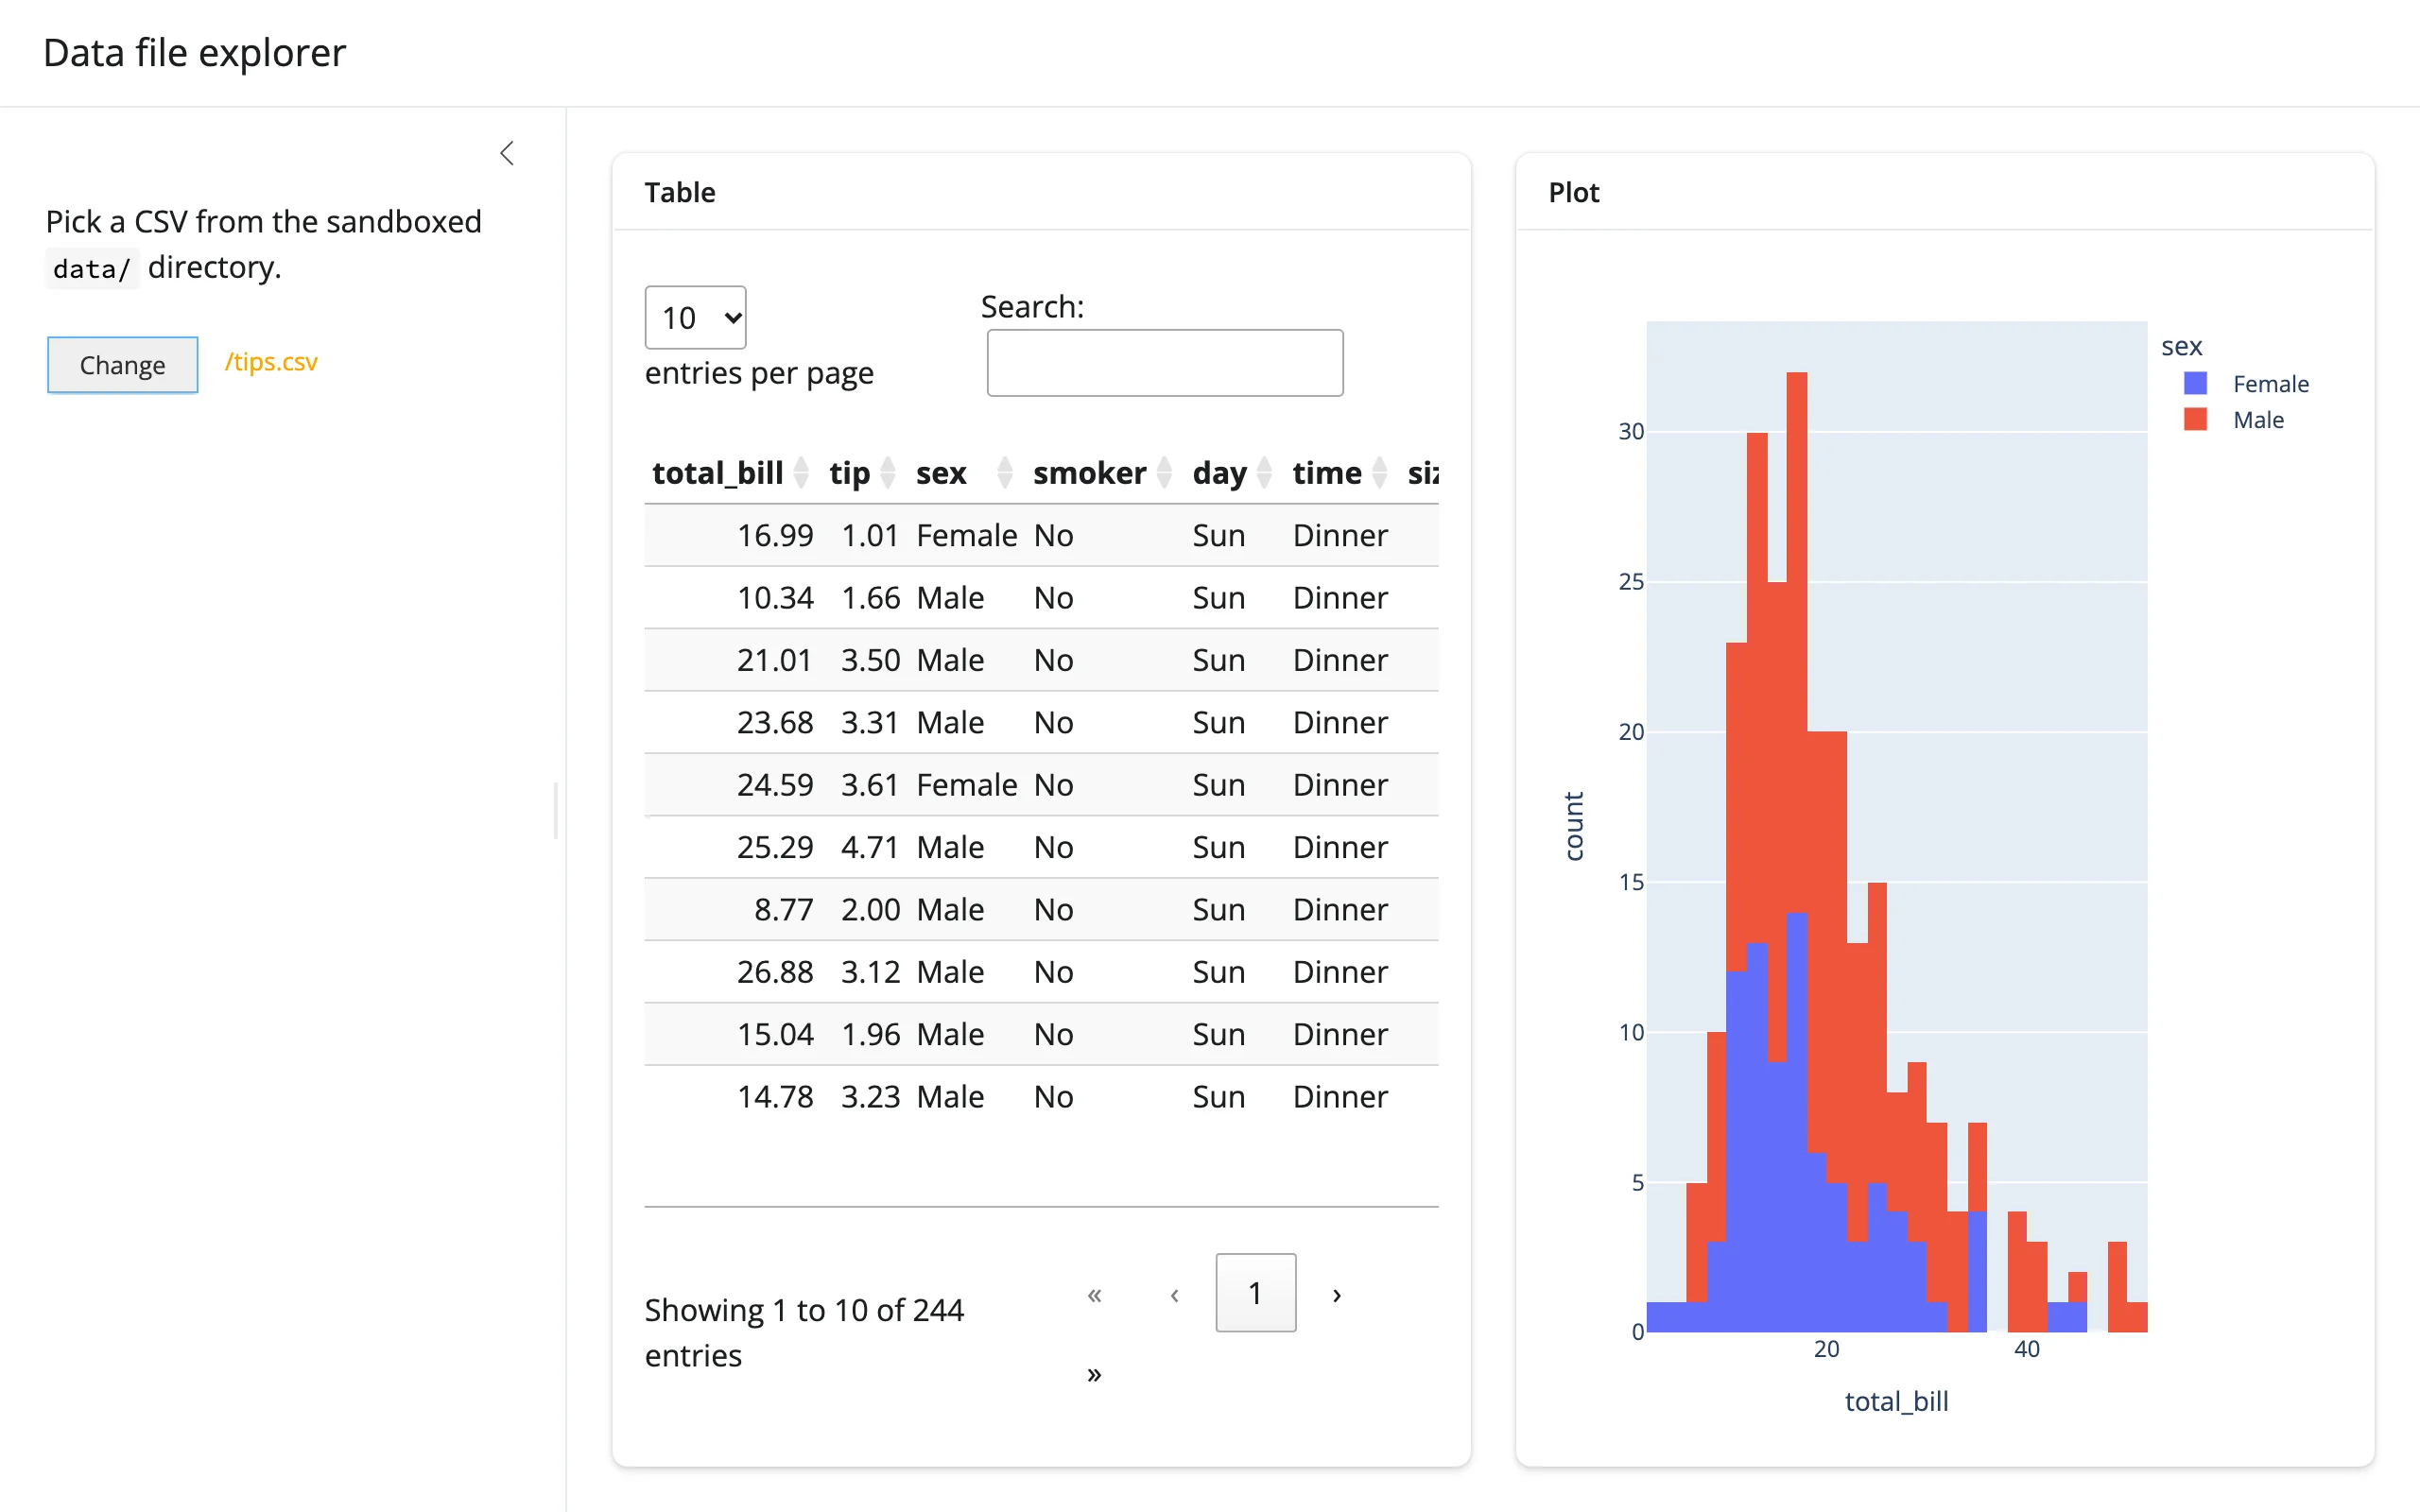
An ipyfilechooser scoped to a sandboxed directory (sandbox_path=), with a register_callback() bridge into a reactive.value that drives both an itables preview table and a plotly plot chosen based on the file’s columns.
Run it
git clone --depth 1 https://github.com/posit-dev/py-shinywidgets
cd py-shinywidgets/website/gallery/templates/ipyfilechooser-data-explorer
uv run shiny run app.py
Source: app.py · Open in Shinylive
Try it
- Click “Select” to open the file dialog.
- Pick a CSV from the sandboxed
data/directory (two are seeded at startup:gapminder.csvandtips.csv). - Click “Select” again to confirm; the table and plot both populate.
- Click “Change” to pick a different file.
Pattern demonstrated
ipyfilechooser has no reactive accessors: selected/selected_path/selected_filename are plain @property getters, not traits, so they can’t be read with reactive_read() either. This template uses fc.register_callback(...) to push the chosen path into a reactive.value the moment the dialog closes.
What to change for your own data
- Point
sandbox_path/pathat any server-side directory you control;filter_patternrestricts the picker to matching files. - The
data()calc just doespd.read_csv; swap inpd.read_parquet,pd.read_excel, or your own loader, and adjustfilter_patternto match. - The plot branch switches on column names (
"lifeExp" in df.columns); replace with whatever branching (or a single fixed chart) fits your own files.
Security note
sandbox_path blocks ../ traversal attempts (verified in a real browser: the Select/Change button disables itself on an out-of-sandbox path). Always set it when exposing a file picker to end users.