Spreadsheet
Tables & grids
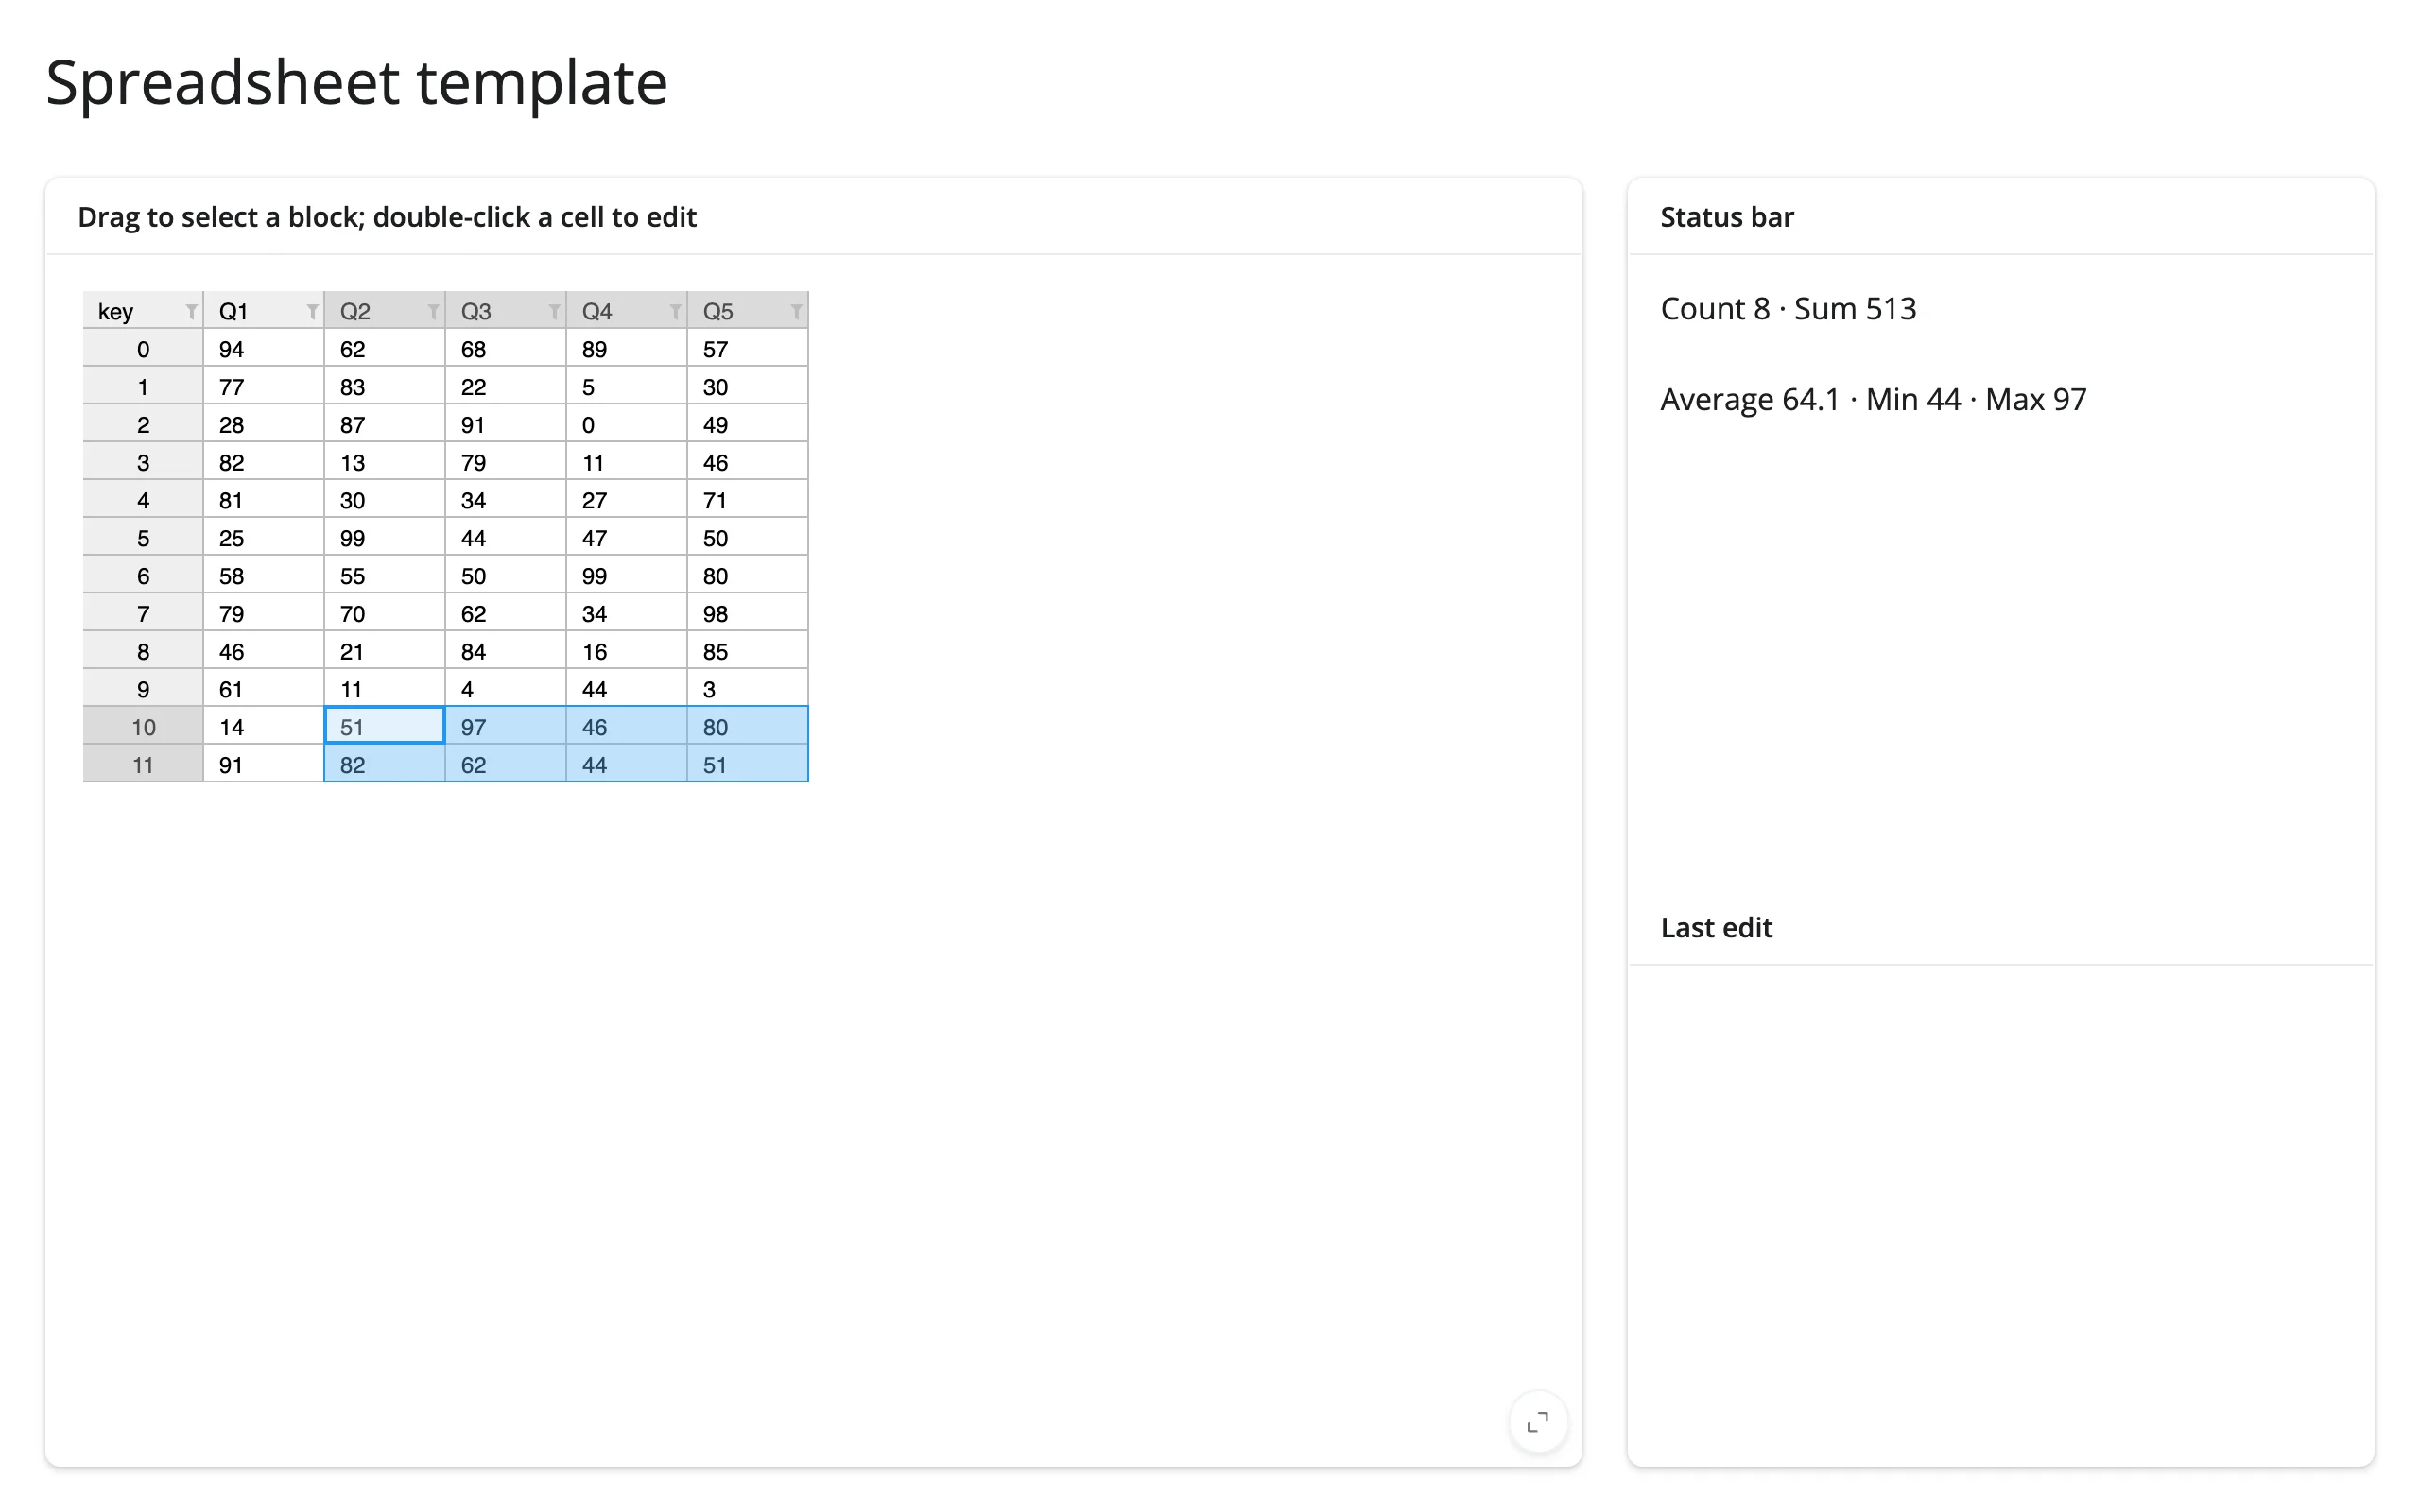
An editable, cell-selectable grid with a status bar reporting Count/Sum/Average/Min/Max for whatever rectangle of cells you drag over, plus a live edit log.
A starting point for a spreadsheet-like app: ipydatagrid with selection_mode="cell" and editable=True, paired with a status bar that recomputes summary statistics from whichever block of cells is currently selected, and a log of the last edit.
Run it
git clone --depth 1 https://github.com/posit-dev/py-shinywidgets
cd py-shinywidgets/website/gallery/templates/ipydatagrid-spreadsheet
uv run shiny run app.py
Source: app.py · Open in Shinylive
Try it
- Drag to select a rectangular block of cells; the status bar reports Count, Sum, Average, Min, and Max for that block.
- Double-click a cell to edit its value, then press Enter; “Last edit” shows the row, column, and new value.
Accessors demonstrated
grid.selected()– a list of cell-range dicts (r1/r2/c1/c2), one per selected block. Empty list when nothing is selected.grid.visible_data()– the currently visible/filtered/sorted DataFrame, used here to resolve selection ranges back to values.grid.edited_cell()– the most recent edit, as a dict withrow,column, andvalue.Noneuntil the first edit.
What to change for your own data
- Swap
dffor your own DataFrame. selection_mode="cell"also supports"row"and"column"; the status-bar logic would need to indexvisible_data()differently for those modes.
Known limitation
rate_policy/rate_delay on render_ipydatagrid do not affect selected(), which streams continuously during a drag (not just at release) and declares no default rate policy. A heavy downstream computation per tick can stall the browser during a long drag; keep per-tick work cheap or debounce it yourself. See docs/widget-guides/ipydatagrid/NOTES.md.