Live trading desk
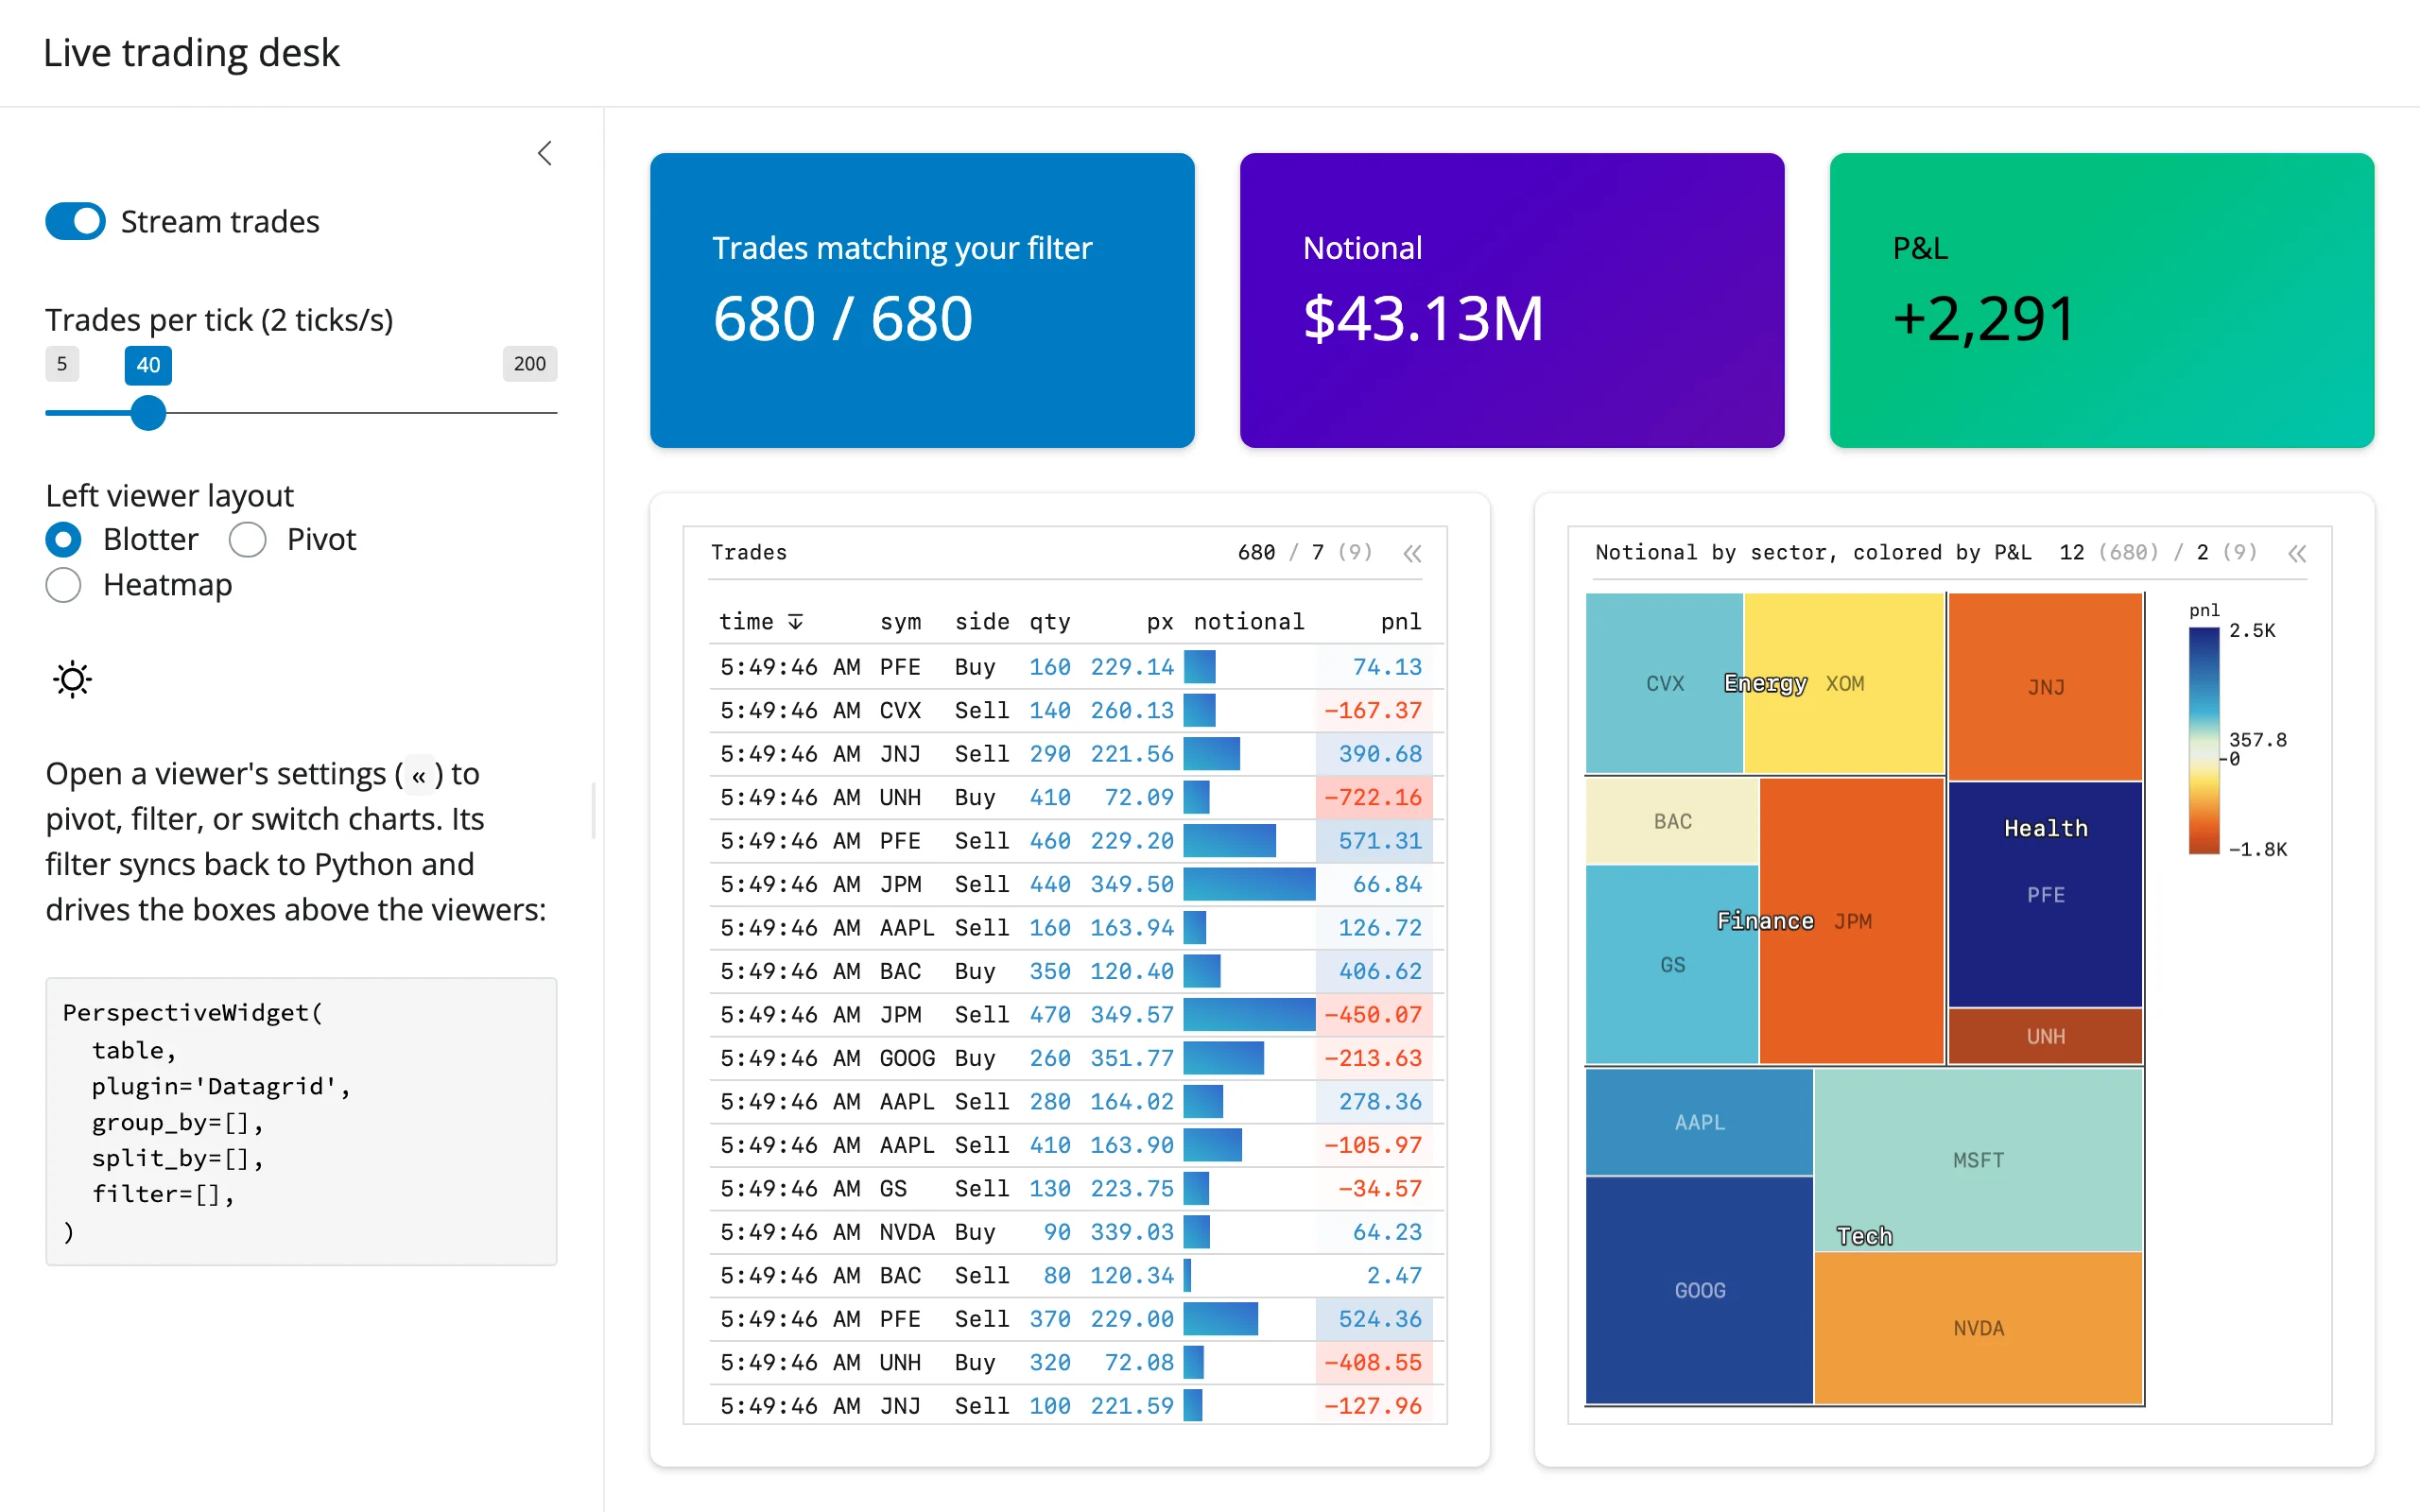
A single Perspective server-side table (a rolling window, capped at 3,000 rows) feeds two PerspectiveWidget viewers: a blotter/pivot/heatmap grid on the left, and a sector treemap on the right. A background effect streams new trades into the table twice a second; three value boxes above the viewers recompute, server-side, from exactly the blotter’s current filter – so pivoting, grouping, or typing a filter into the grid’s own settings panel immediately changes what the value boxes count, with no extra code to keep them in sync.
Run it
git clone --depth 1 https://github.com/posit-dev/py-shinywidgets
cd py-shinywidgets/website/gallery/showcases/trading-desk
uv run shiny run app.py
Source: app.py · Open in Shinylive
Try this
- Watch the value boxes update live as trades stream in.
- Switch Left viewer layout between Blotter / Pivot / Heatmap: the whole preset (plugin, grouping, columns, column styling) is swapped in one
hold_sync()batch. - Open the grid’s own settings panel (the
«affordance) and add a filter (e.g.sector == "Tech"): the value boxes above immediately recompute to match. - Flip dark mode: both viewers’ themes update in place.
Accessors demonstrated
grid.view_config()– the blotter viewer’s live configuration (plugin, group/split-by, sort, and criticallyfilter), read both by the config code panel and by thein_view()calc that drives the three value boxes. This is the accessor that makes “the boxes always match whatever the user is looking at” possible without re-deriving the filter logic in Python.
Verification
No extra packages needed. Confirmed the streaming accessor directly: Trades matching your filter read 680 / 680 at page load, then 880 / 880 about 2.5 seconds later (with streaming on at the default rate) – a real, growing count, not a static display. Switching Left viewer layout to Pivot visibly regrouped the blotter by sector/symbol/side and changed the treemap’s labels, confirmed in img/after_pivot.webp against img/hero.webp.
Source: promoted from docs/widget-guides/perspective/gallery/showcase_trading_desk.py (see NOTES.md).