Les Misérables network
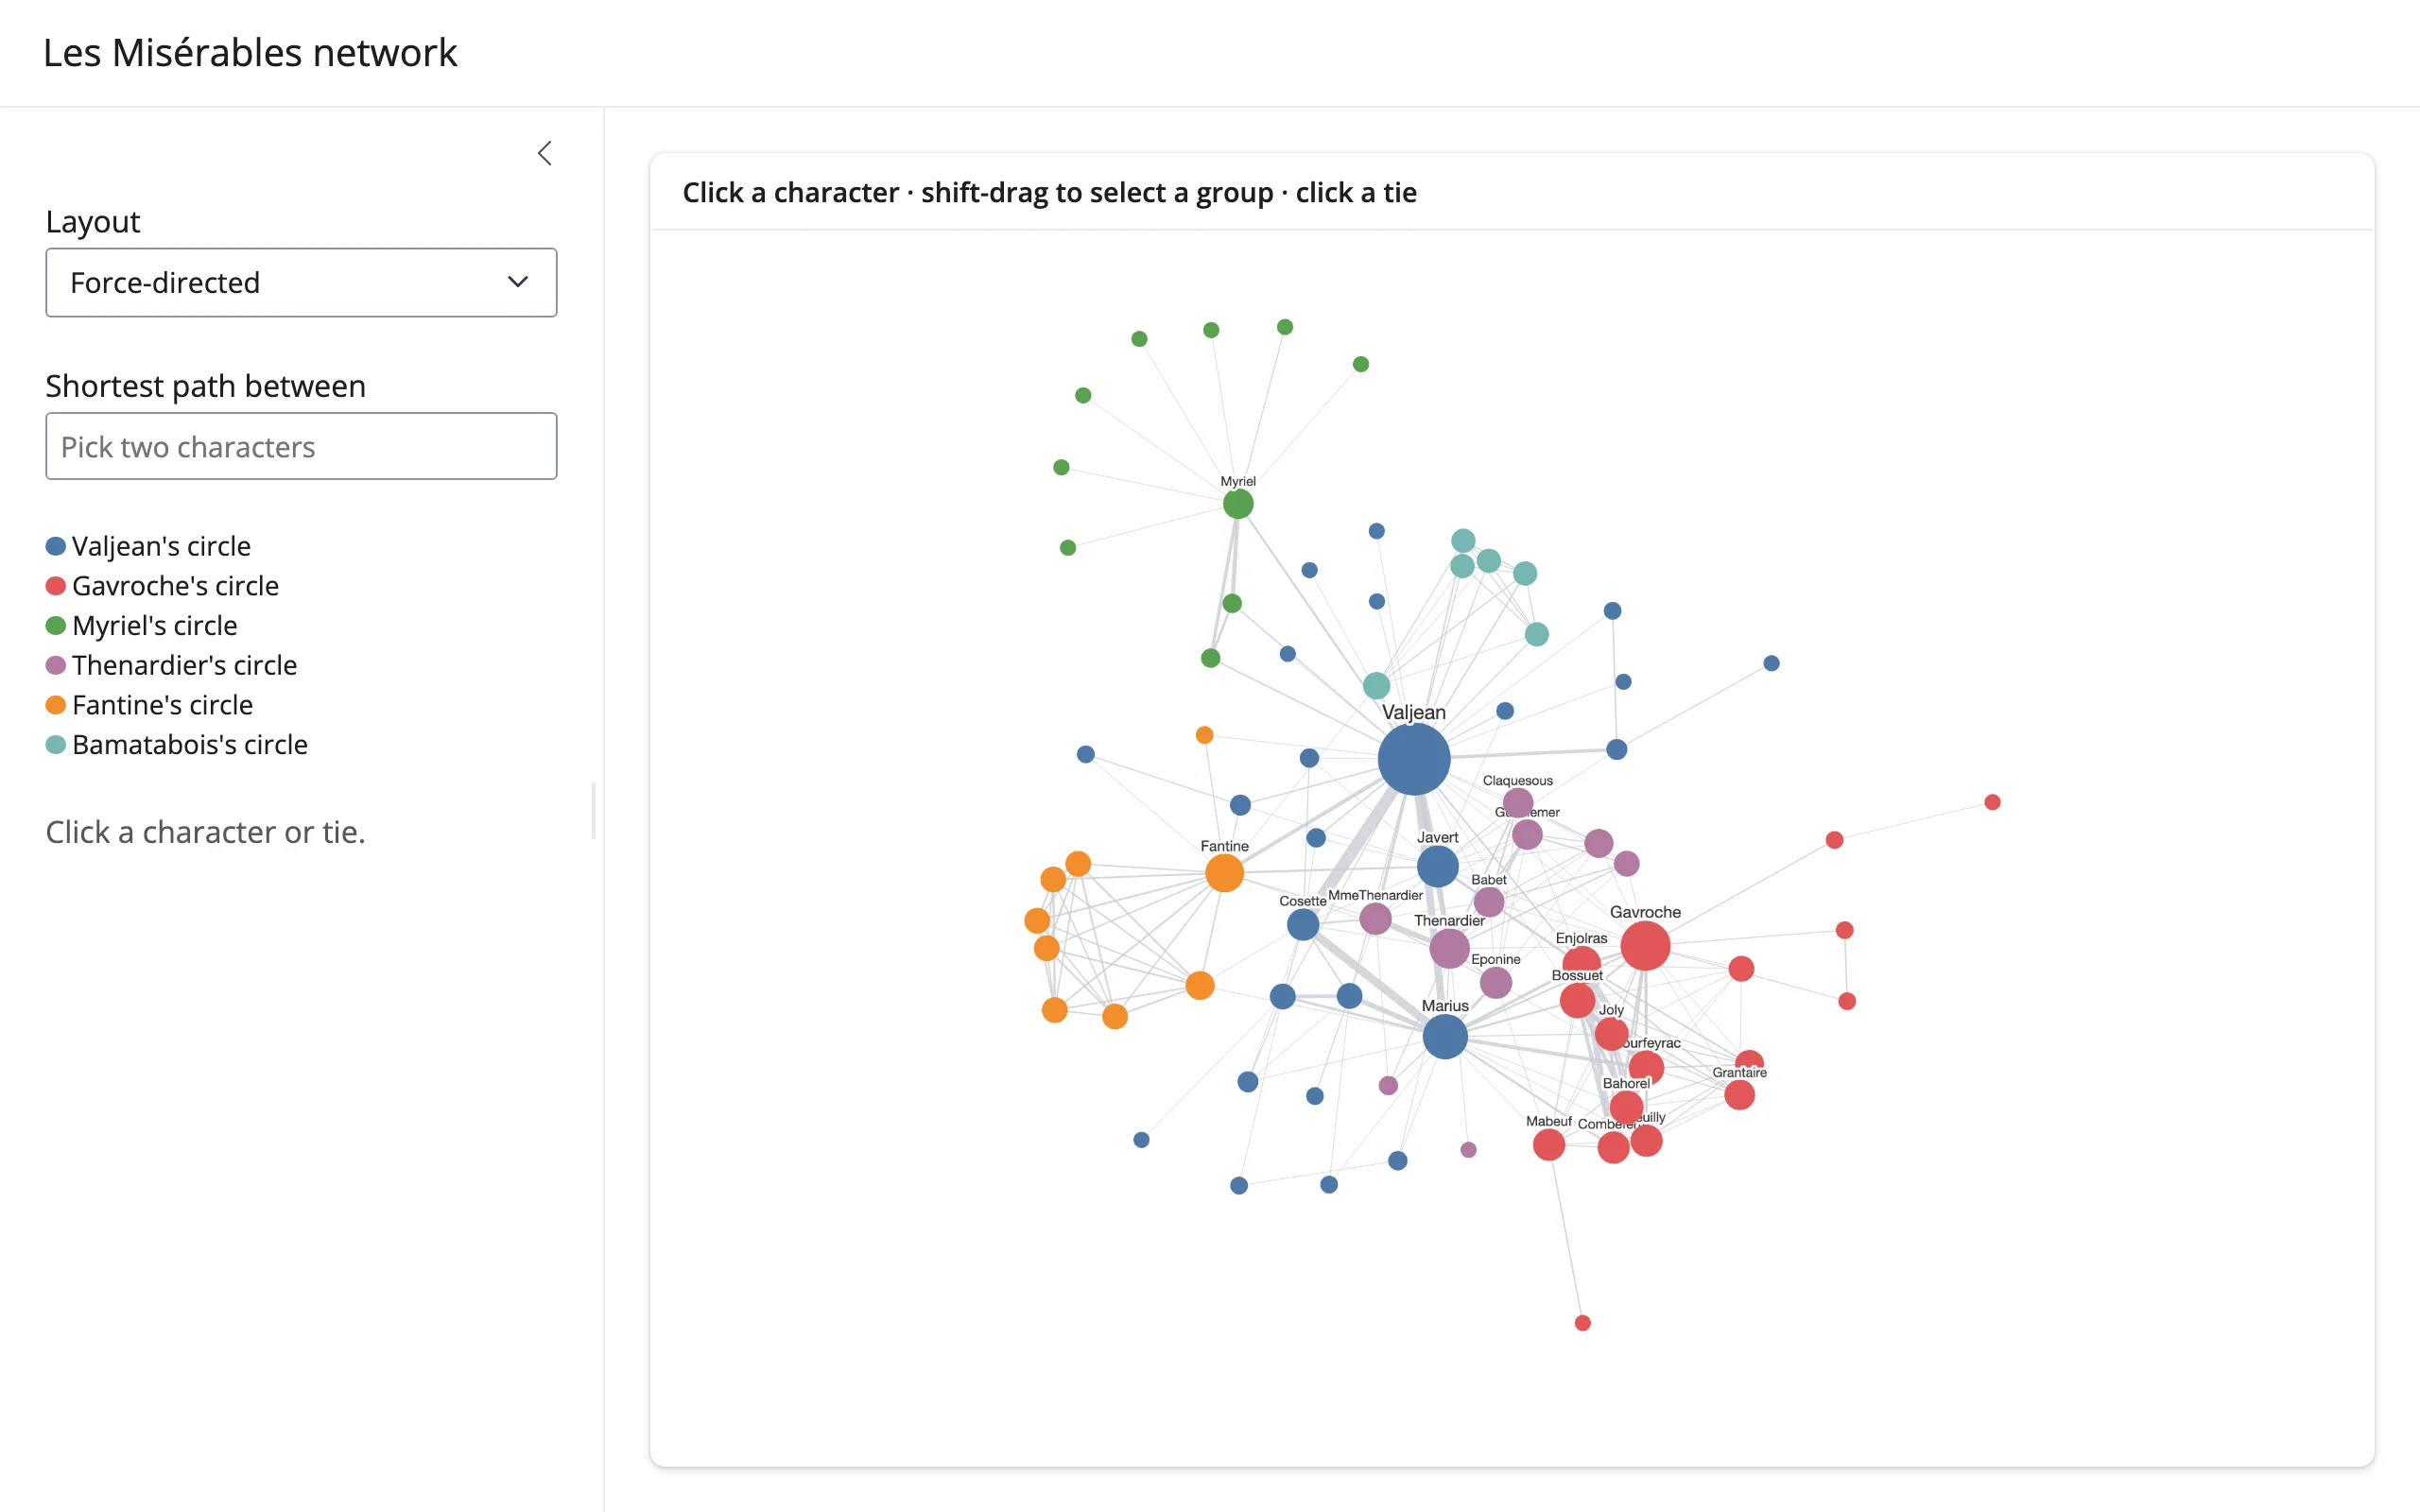
The classic Les Misérables character co-occurrence graph (bundled with networkx), with Louvain communities colored, node size mapped to degree, and a force-directed/concentric/ circle layout picker. Click a character to see their circle and top co-occurring characters; shift-drag a box to select a group and see its internal density; click a tie for its scene count; or pick two characters for the shortest path between them (computed by networkx, weighted by inverse scene count, so “strong ties” are short hops). Every one of these restyles the graph by toggling CSS classes on existing elements – the force-directed layout never reruns, so your pan/zoom position is never lost.
Run it
git clone --depth 1 https://github.com/posit-dev/py-shinywidgets
cd py-shinywidgets/website/gallery/showcases/les-miserables-network
uv run shiny run app.py
Source: app.py · Open in Shinylive
Try this
- Click Valjean (the largest node): the sidebar lists his five strongest ties, the graph fades everything except his immediate circle.
- Click a tie (edge) between two characters: see how many scenes they share.
- Shift-drag a box around a cluster: the sidebar reports the group’s size, internal tie count, and density.
- Pick two characters in Shortest path between: the path lights up on the graph.
- Switch Layout: force-directed, concentric (by degree), or a plain circle.
Accessors demonstrated
network.clicked_node()– the clicked node’s full ipycytoscape element dict (.dataholds the original attributes); drives both the sidebar’s character card and the class-based restyle.network.clicked_edge()– the clicked edge’s element dict, used for the tie’s scene count.network.selected_nodes()– the box-selected nodes’ data dicts, debounced by default (a box-select toggles many children’sselectedtrait in a burst). Replaced a hand-rolled loop that readreactive_read(n, "selected")on every child node widget directly;selected_nodes()is the dedicated accessor for exactly this (new on currentmain).
Verification
No extra packages needed beyond networkx (already bundled). A real Playwright click landed on a tie between Javert and a minor character (“Woman1”): the sidebar updated from “Click a character or tie.” to "Javert + Woman1: 1 scenes", and a dashed box-selection outline appeared around the clicked area – confirmed against the rendered sidebar text, not just a screenshot. See img/hero.webp and img/after_click.webp. A real shift-drag box-select over most of the canvas reported "72 characters · 249 ties inside the group · density 0.10" via selected_nodes(), with visible black selection outlines on every caught node – img/after_box_select.webp.
Source: promoted from docs/widget-guides/ipycytoscape/gallery/showcase_les_miserables.py (see NOTES.md).