AOI workbench
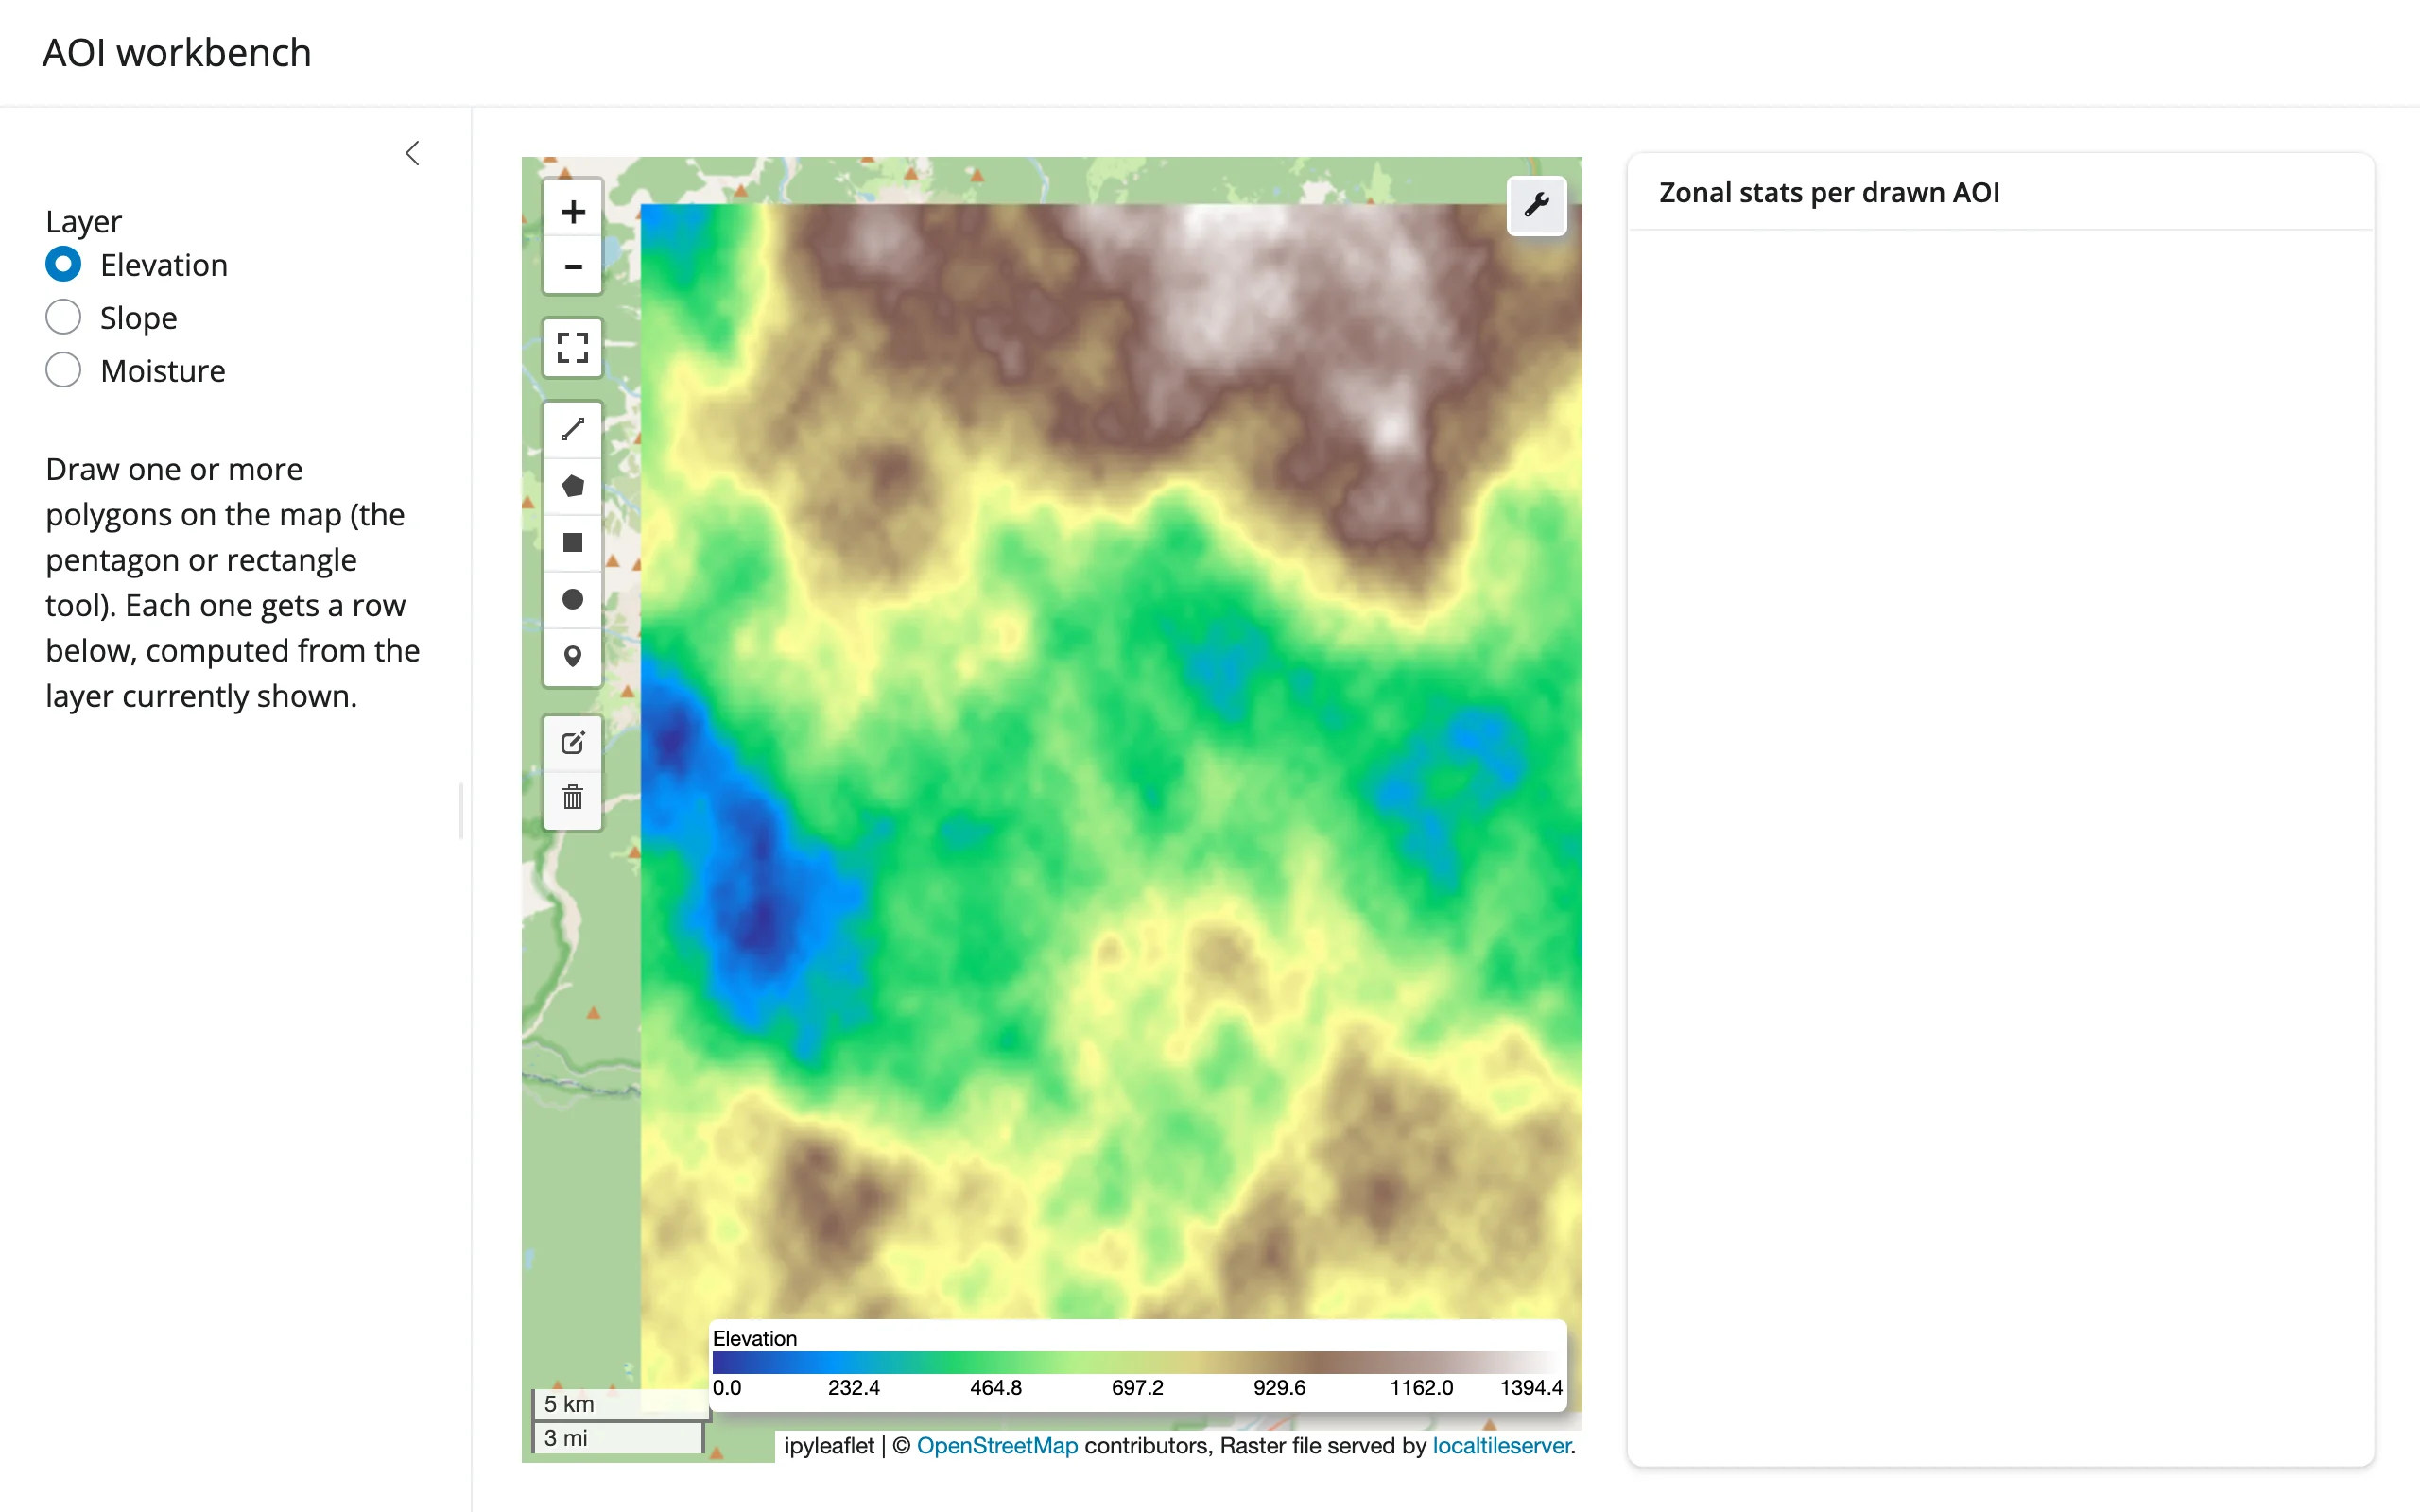
A leafmap.Map (built on ipyleaflet) serves a locally-generated multi-band raster through localtileserver, with leaflet-draw’s rectangle/polygon tools enabled. Draw one or more areas of interest, and a card to the right shows a zonal-stats table and a bar chart – computed in Python by clipping the current band to each drawn polygon with rioxarray/shapely.
Run it
git clone --depth 1 https://github.com/posit-dev/py-shinywidgets
cd py-shinywidgets/website/gallery/showcases/aoi-workbench
uv run --with leafmap --with rioxarray --with localtileserver shiny run app.py
Source: app.py · Open in Shinylive
Try this
- Draw a rectangle (or pentagon) on the map with the leaflet-draw toolbar. A row appears in the Zonal stats per drawn AOI table, and the bar chart below it updates, both driven entirely by
map.drawn_features(). - Draw a second shape: it gets its own row.
- Switch the Layer radio (Elevation / Slope / Moisture): the raster restyles and the zonal stats recompute against the newly selected band, for the same drawn polygons.
Accessors demonstrated
map.drawn_features()– the list of GeoJSON features from every shape currently on the map’s draw layer.None/empty until something is drawn; each entry is used here to clip the active raster band and compute mean/min/max/pixel-count.
Layout note
This is one ui.layout_columns() card (not two): layout_columns() recycles col_widths across its top-level children, so a second top-level card would reflow the whole grid. Giving the table a fixed height (rather than letting it fill) is also what lets the chart below it claim the rest of the card – two fill-hungry outputs stacked with no height split between them leaves the second with nothing to measure, so it never reveals itself.
Verification
Server boots clean (after one transient uv cache error on a loaded machine, resolved on retry). A real Playwright rectangle-draw gesture on the map produces a populated stats table (aoi=1, mean=471.7, min=290.1, max=734.3, pixels=11880) and a non-empty bar chart, confirmed against the rendered table text, not just a screenshot – see img/hero.webp (before) and img/after_draw.webp (after).
Source: promoted from docs/widget-guides/leafmap/gallery/showcase_aoi_workbench.py (see NOTES.md).